

Key Insights
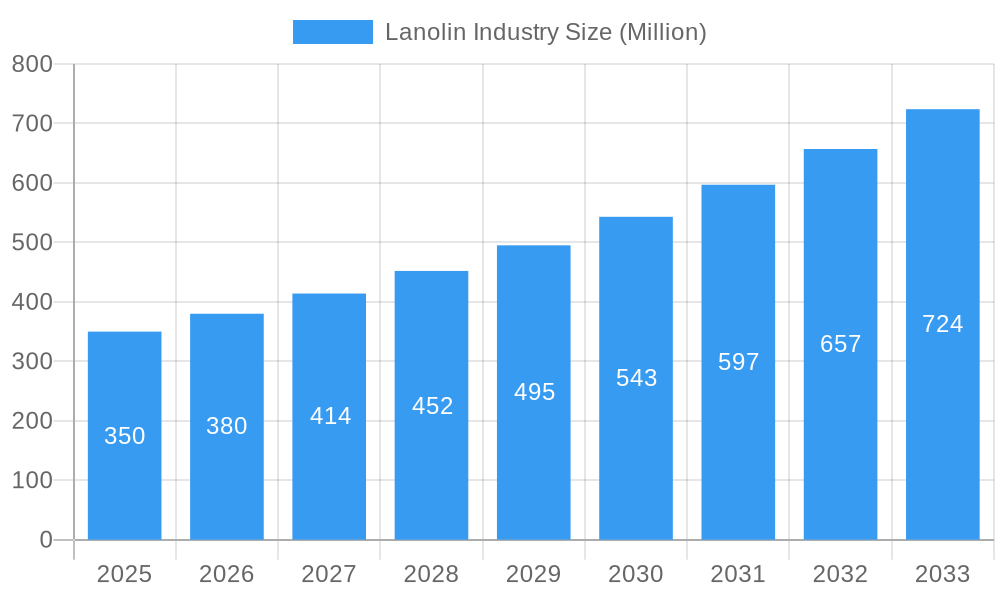
The global lanolin market, valued at approximately $445.439 million in the 2025 base year, is projected to expand at a compound annual growth rate (CAGR) of 3.22% through 2033. This growth is propelled by increasing demand across key sectors, including cosmetics and personal care, pharmaceuticals, and textiles. The rising consumer preference for natural and organic ingredients in beauty products is a significant driver for lanolin's adoption as a premium moisturizer and emollient. Concurrently, its recognized efficacy as a skin protectant and wound healing agent supports its expanding use in pharmaceutical formulations. Innovations in lanolin processing and purification are also enhancing product quality and expanding application potential.
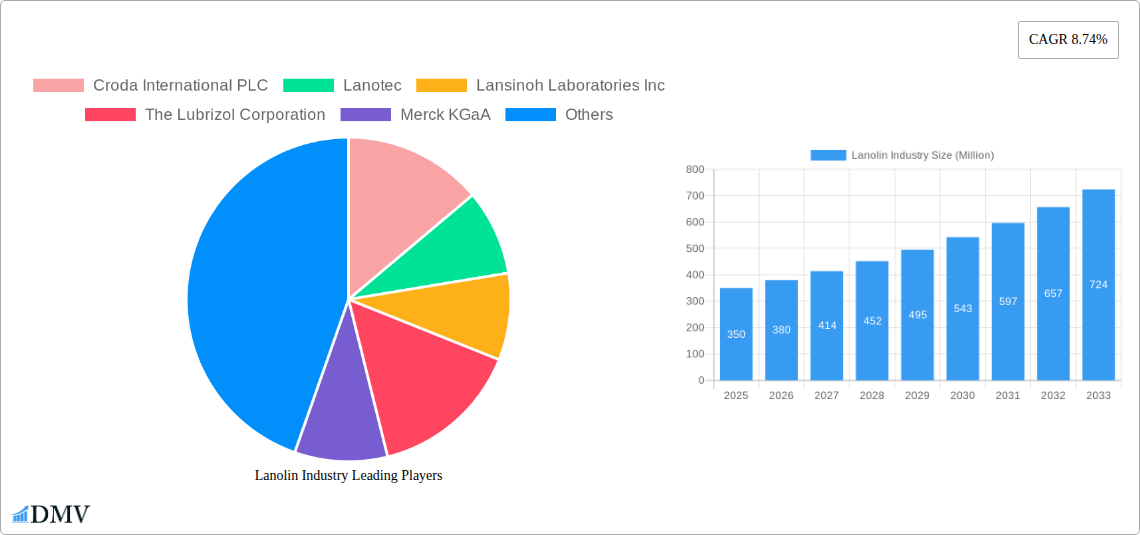
Lanolin Industry Market Size (In Million)
Despite positive growth prospects, the market encounters challenges. Volatility in raw material prices and supply chain disruptions linked to sheep wool production can impact lanolin availability and cost. The competitive landscape also includes synthetic alternatives offering potential cost advantages, emphasizing the need for continuous innovation and the development of high-value lanolin-based products. Nevertheless, the growing demand for sustainable ingredients and ongoing research into lanolin's versatile applications indicate sustained market expansion. Leading companies such as Croda International PLC, Lanotec, and Merck KGaA are actively investing in product development and market reach to leverage these opportunities.
Lanolin Industry Company Market Share
Lanolin Industry Market Report: 2019-2033
This comprehensive report provides a detailed analysis of the global lanolin industry, offering invaluable insights for stakeholders seeking to navigate this dynamic market. The study covers the period 2019-2033, with a focus on the 2025 estimated year and a forecast period extending to 2033. The report's in-depth analysis leverages extensive data and expert insights to provide a clear picture of market trends, competitive landscapes, and future growth prospects. The global lanolin market is projected to reach xx Million by 2033.
Lanolin Industry Market Composition & Trends
This section delves into the intricate structure of the lanolin market, examining market concentration, innovation drivers, regulatory frameworks, substitute products, end-user profiles, and merger and acquisition (M&A) activities. We analyze the market share distribution among key players such as Croda International PLC, Lanotec, Lansinoh Laboratories Inc, The Lubrizol Corporation, Merck KGaA, Nippon Fine Chemical, NK Chemicals, Rolex Lanolin Products Limited, Suru Chemicals, Wellman Advanced Materials, Yixin Chemical Co Ltd, and Zhejiang Garden Biochemical High-Tech Co Ltd (list not exhaustive), assessing their strategic moves and market influence.
- Market Concentration: The lanolin market exhibits a moderately concentrated structure, with a few major players controlling a significant portion of the market share. The top 5 companies collectively hold approximately xx% of the market share as of 2024.
- Innovation Catalysts: Research and development (R&D) investments into sustainable and high-performance lanolin derivatives are driving innovation. The emergence of biodegradable and environmentally friendly lanolin-based products is reshaping market dynamics.
- Regulatory Landscape: Varying regional regulations concerning the use of lanolin in cosmetics and pharmaceuticals influence market growth and product development. Compliance with these regulations is a key success factor for industry players.
- Substitute Products: The availability of synthetic alternatives poses a competitive challenge. However, the unique properties of lanolin, such as its emollient and moisturizing qualities, continue to support its demand in specific applications.
- End-User Profiles: Major end-use sectors include cosmetics and personal care, pharmaceuticals, textiles, and lubricants. The report analyzes the growth potential of each sector and its impact on overall market demand.
- M&A Activities: The past five years have witnessed several strategic mergers and acquisitions in the lanolin industry, totaling an estimated value of xx Million. These activities have reshaped the competitive landscape and spurred innovation.
Lanolin Industry Evolution
This section traces the evolution of the lanolin industry, analyzing market growth trajectories, technological advancements, and shifting consumer preferences. The historical period (2019-2024) reveals a compound annual growth rate (CAGR) of xx%, driven by increasing demand in the cosmetics and personal care sector. Technological advancements, such as the development of purified and refined lanolin derivatives, have broadened the application scope of lanolin. Consumer demand for natural and sustainable ingredients has fueled the growth of eco-friendly lanolin products. We project a CAGR of xx% from 2025 to 2033. The increasing adoption of lanolin in new applications, such as bio-lubricants and environmentally friendly industrial products, is expected to significantly boost market growth during the forecast period.
Leading Regions, Countries, or Segments in Lanolin Industry
This section identifies the leading regions, countries, or segments within the lanolin industry.
- Dominant Region: [Insert dominant region, e.g., North America] currently holds the largest market share due to high demand for lanolin-based products in the cosmetics and personal care industry.
- Key Drivers in the Dominant Region:
- Strong regulatory support for natural and sustainable ingredients.
- Significant investments in R&D for advanced lanolin derivatives.
- High per capita consumption of cosmetics and personal care products.
[Insert analysis of the dominant region's market share, growth drivers, and future outlook. Repeat this structure for other significant regions/countries/segments if necessary. Use approximately 300 words total across bullets and paragraphs to explain dominance factors].
Lanolin Industry Product Innovations
Recent years have witnessed significant product innovations in the lanolin industry. Companies are focusing on developing high-purity lanolin derivatives with enhanced performance characteristics, leading to the creation of products tailored to specific applications. For instance, the development of water-soluble lanolin derivatives has expanded its usability in cosmetics and personal care formulations. Moreover, advancements in extraction and purification techniques have resulted in more sustainable and environmentally friendly lanolin production processes. These innovations have significantly improved the overall quality and efficiency of lanolin-based products, driving market growth.
Propelling Factors for Lanolin Industry Growth
Several factors are driving the growth of the lanolin industry. These include:
- Technological Advancements: Development of new lanolin derivatives with improved properties.
- Economic Growth: Rising disposable incomes in developing economies are boosting demand for cosmetics and personal care products.
- Regulatory Support: Government initiatives promoting the use of natural and sustainable ingredients.
Obstacles in the Lanolin Industry Market
Despite its growth potential, the lanolin industry faces several challenges:
- Regulatory Hurdles: Stringent regulations in certain regions regarding the use of lanolin in specific applications.
- Supply Chain Disruptions: Fluctuations in raw material availability and pricing can impact production costs and profitability.
- Competitive Pressures: The presence of synthetic substitutes and other competing ingredients.
These obstacles could constrain market growth unless addressed effectively.
Future Opportunities in Lanolin Industry
Future opportunities for the lanolin industry lie in:
- New Market Penetration: Expansion into emerging markets with increasing demand for lanolin-based products.
- Technological Innovation: Development of novel lanolin derivatives with specialized applications (e.g., bio-lubricants).
- Sustainability Focus: Increased adoption of eco-friendly production methods.
Major Players in the Lanolin Industry Ecosystem
- Croda International PLC
- Lanotec
- Lansinoh Laboratories Inc
- The Lubrizol Corporation
- Merck KGaA
- Nippon Fine Chemical
- NK Chemicals
- Rolex Lanolin Products Limited
- Suru Chemicals
- Wellman Advanced Materials
- Yixin Chemical Co Ltd
- Zhejiang Garden Biochemical High-Tech Co Ltd *List Not Exhaustive
Key Developments in Lanolin Industry Industry
- April 2023: Lanotec launched a new product line of lanolin-based lubricants, including MPX (multi-purpose), MGX (marine), and EGX (electrical). These environmentally friendly products are expected to expand lanolin’s applications in commercial and residential sectors, potentially disrupting existing lubricant markets.
Strategic Lanolin Industry Market Forecast
The lanolin industry is poised for significant growth over the forecast period (2025-2033), driven by several factors. These include rising demand from the cosmetics and personal care sector, technological advancements leading to new product applications, and increasing consumer preference for natural ingredients. Furthermore, the development of sustainable and environmentally friendly lanolin production processes will enhance market appeal. These factors, combined with strategic investments in R&D and expansion into emerging markets, suggest a positive outlook for the global lanolin industry.
Lanolin Industry Segmentation
-
1. Application
- 1.1. Cosmetics and Personal Care
- 1.2. Pharmaceuticals
- 1.3. Anti-corrosive Applications
- 1.4. Lubricants
- 1.5. Other Applications (Paints, Paper)
Lanolin Industry Segmentation By Geography
-
1. Asia Pacific
- 1.1. China
- 1.2. India
- 1.3. Japan
- 1.4. South Korea
- 1.5. Rest of Asia Pacific
-
2. North America
- 2.1. United States
- 2.2. Canada
- 2.3. Mexico
-
3. Europe
- 3.1. Germany
- 3.2. United Kingdom
- 3.3. France
- 3.4. Italy
- 3.5. Rest of Europe
-
4. South America
- 4.1. Brazil
- 4.2. Argentina
- 4.3. Rest of South America
-
5. Middle East and Africa
- 5.1. Saudi Arabia
- 5.2. South Africa
- 5.3. Rest of Middle East and Africa
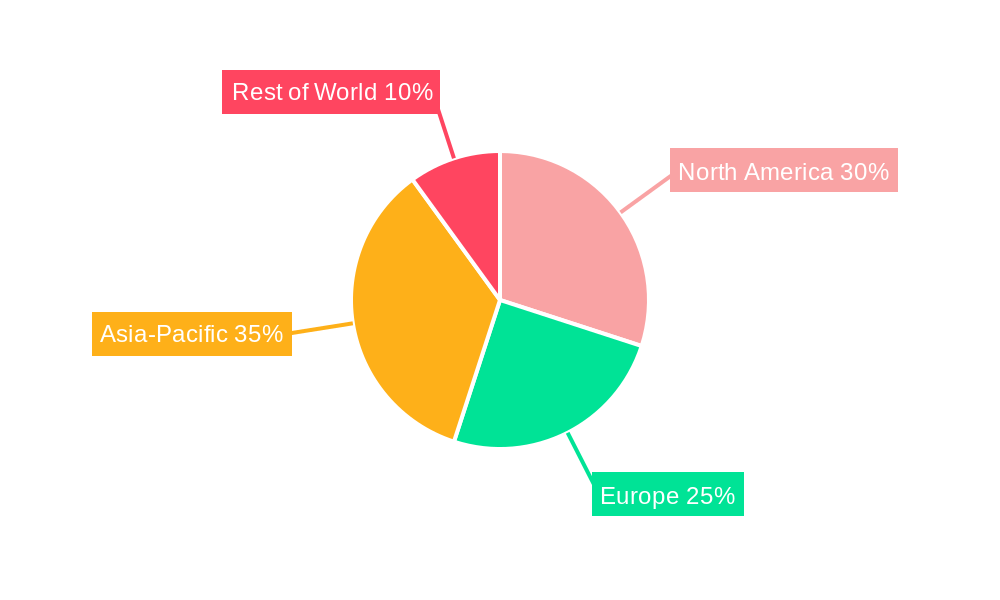
Lanolin Industry Regional Market Share
Geographic Coverage of Lanolin Industry
Lanolin Industry REPORT HIGHLIGHTS
| Aspects | Details |
|---|---|
| Study Period | 2020-2034 |
| Base Year | 2025 |
| Estimated Year | 2026 |
| Forecast Period | 2026-2034 |
| Historical Period | 2020-2025 |
| Growth Rate | CAGR of 3.22% from 2020-2034 |
| Segmentation |
|
Table of Contents
- 1. Introduction
- 1.1. Research Scope
- 1.2. Market Segmentation
- 1.3. Research Objective
- 1.4. Definitions and Assumptions
- 2. Executive Summary
- 2.1. Market Snapshot
- 3. Market Dynamics
- 3.1. Market Drivers
- 3.2. Market Restrains
- 3.3. Market Trends
- 3.4. Market Opportunities
- 4. Market Factor Analysis
- 4.1. Porters Five Forces
- 4.1.1. Bargaining Power of Suppliers
- 4.1.2. Bargaining Power of Buyers
- 4.1.3. Threat of New Entrants
- 4.1.4. Threat of Substitutes
- 4.1.5. Competitive Rivalry
- 4.2. PESTEL analysis
- 4.3. BCG Analysis
- 4.3.1. Stars (High Growth, High Market Share)
- 4.3.2. Cash Cows (Low Growth, High Market Share)
- 4.3.3. Question Mark (High Growth, Low Market Share)
- 4.3.4. Dogs (Low Growth, Low Market Share)
- 4.4. Ansoff Matrix Analysis
- 4.5. Supply Chain Analysis
- 4.6. Regulatory Landscape
- 4.7. Current Market Potential and Opportunity Assessment (TAM–SAM–SOM Framework)
- 4.8. DMV Analyst Note
- 4.1. Porters Five Forces
- 5. Market Analysis, Insights and Forecast 2021-2033
- 5.1. Market Analysis, Insights and Forecast - by Application
- 5.1.1. Cosmetics and Personal Care
- 5.1.2. Pharmaceuticals
- 5.1.3. Anti-corrosive Applications
- 5.1.4. Lubricants
- 5.1.5. Other Applications (Paints, Paper)
- 5.2. Market Analysis, Insights and Forecast - by Region
- 5.2.1. Asia Pacific
- 5.2.2. North America
- 5.2.3. Europe
- 5.2.4. South America
- 5.2.5. Middle East and Africa
- 5.1. Market Analysis, Insights and Forecast - by Application
- 6. Global Lanolin Industry Analysis, Insights and Forecast, 2021-2033
- 6.1. Market Analysis, Insights and Forecast - by Application
- 6.1.1. Cosmetics and Personal Care
- 6.1.2. Pharmaceuticals
- 6.1.3. Anti-corrosive Applications
- 6.1.4. Lubricants
- 6.1.5. Other Applications (Paints, Paper)
- 6.1. Market Analysis, Insights and Forecast - by Application
- 7. Asia Pacific Lanolin Industry Analysis, Insights and Forecast, 2020-2032
- 7.1. Market Analysis, Insights and Forecast - by Application
- 7.1.1. Cosmetics and Personal Care
- 7.1.2. Pharmaceuticals
- 7.1.3. Anti-corrosive Applications
- 7.1.4. Lubricants
- 7.1.5. Other Applications (Paints, Paper)
- 7.1. Market Analysis, Insights and Forecast - by Application
- 8. North America Lanolin Industry Analysis, Insights and Forecast, 2020-2032
- 8.1. Market Analysis, Insights and Forecast - by Application
- 8.1.1. Cosmetics and Personal Care
- 8.1.2. Pharmaceuticals
- 8.1.3. Anti-corrosive Applications
- 8.1.4. Lubricants
- 8.1.5. Other Applications (Paints, Paper)
- 8.1. Market Analysis, Insights and Forecast - by Application
- 9. Europe Lanolin Industry Analysis, Insights and Forecast, 2020-2032
- 9.1. Market Analysis, Insights and Forecast - by Application
- 9.1.1. Cosmetics and Personal Care
- 9.1.2. Pharmaceuticals
- 9.1.3. Anti-corrosive Applications
- 9.1.4. Lubricants
- 9.1.5. Other Applications (Paints, Paper)
- 9.1. Market Analysis, Insights and Forecast - by Application
- 10. South America Lanolin Industry Analysis, Insights and Forecast, 2020-2032
- 10.1. Market Analysis, Insights and Forecast - by Application
- 10.1.1. Cosmetics and Personal Care
- 10.1.2. Pharmaceuticals
- 10.1.3. Anti-corrosive Applications
- 10.1.4. Lubricants
- 10.1.5. Other Applications (Paints, Paper)
- 10.1. Market Analysis, Insights and Forecast - by Application
- 11. Middle East and Africa Lanolin Industry Analysis, Insights and Forecast, 2020-2032
- 11.1. Market Analysis, Insights and Forecast - by Application
- 11.1.1. Cosmetics and Personal Care
- 11.1.2. Pharmaceuticals
- 11.1.3. Anti-corrosive Applications
- 11.1.4. Lubricants
- 11.1.5. Other Applications (Paints, Paper)
- 11.1. Market Analysis, Insights and Forecast - by Application
- 12. Competitive Analysis
- 12.1. Company Profiles
- 12.1.1 Croda International PLC
- 12.1.1.1. Company Overview
- 12.1.1.2. Products
- 12.1.1.3. Company Financials
- 12.1.1.4. SWOT Analysis
- 12.1.2 Lanotec
- 12.1.2.1. Company Overview
- 12.1.2.2. Products
- 12.1.2.3. Company Financials
- 12.1.2.4. SWOT Analysis
- 12.1.3 Lansinoh Laboratories Inc
- 12.1.3.1. Company Overview
- 12.1.3.2. Products
- 12.1.3.3. Company Financials
- 12.1.3.4. SWOT Analysis
- 12.1.4 The Lubrizol Corporation
- 12.1.4.1. Company Overview
- 12.1.4.2. Products
- 12.1.4.3. Company Financials
- 12.1.4.4. SWOT Analysis
- 12.1.5 Merck KGaA
- 12.1.5.1. Company Overview
- 12.1.5.2. Products
- 12.1.5.3. Company Financials
- 12.1.5.4. SWOT Analysis
- 12.1.6 Nippon Fine Chemical
- 12.1.6.1. Company Overview
- 12.1.6.2. Products
- 12.1.6.3. Company Financials
- 12.1.6.4. SWOT Analysis
- 12.1.7 NK Chemicals
- 12.1.7.1. Company Overview
- 12.1.7.2. Products
- 12.1.7.3. Company Financials
- 12.1.7.4. SWOT Analysis
- 12.1.8 Rolex Lanolin Products Limited
- 12.1.8.1. Company Overview
- 12.1.8.2. Products
- 12.1.8.3. Company Financials
- 12.1.8.4. SWOT Analysis
- 12.1.9 Suru Chemicals
- 12.1.9.1. Company Overview
- 12.1.9.2. Products
- 12.1.9.3. Company Financials
- 12.1.9.4. SWOT Analysis
- 12.1.10 Wellman Advanced Materials
- 12.1.10.1. Company Overview
- 12.1.10.2. Products
- 12.1.10.3. Company Financials
- 12.1.10.4. SWOT Analysis
- 12.1.11 Yixin Chemical Co Ltd
- 12.1.11.1. Company Overview
- 12.1.11.2. Products
- 12.1.11.3. Company Financials
- 12.1.11.4. SWOT Analysis
- 12.1.12 Zhejiang Garden Biochemical High-Tech Co Ltd*List Not Exhaustive
- 12.1.12.1. Company Overview
- 12.1.12.2. Products
- 12.1.12.3. Company Financials
- 12.1.12.4. SWOT Analysis
- 12.1.1 Croda International PLC
- 12.2. Market Entropy
- 12.2.1 Company's Key Areas Served
- 12.2.2 Recent Developments
- 12.3. Company Market Share Analysis 2025
- 12.3.1 Top 5 Companies Market Share Analysis
- 12.3.2 Top 3 Companies Market Share Analysis
- 12.4. List of Potential Customers
- 13. Research Methodology
List of Figures
- Figure 1: Global Lanolin Industry Revenue Breakdown (million, %) by Region 2025 & 2033
- Figure 2: Asia Pacific Lanolin Industry Revenue (million), by Application 2025 & 2033
- Figure 3: Asia Pacific Lanolin Industry Revenue Share (%), by Application 2025 & 2033
- Figure 4: Asia Pacific Lanolin Industry Revenue (million), by Country 2025 & 2033
- Figure 5: Asia Pacific Lanolin Industry Revenue Share (%), by Country 2025 & 2033
- Figure 6: North America Lanolin Industry Revenue (million), by Application 2025 & 2033
- Figure 7: North America Lanolin Industry Revenue Share (%), by Application 2025 & 2033
- Figure 8: North America Lanolin Industry Revenue (million), by Country 2025 & 2033
- Figure 9: North America Lanolin Industry Revenue Share (%), by Country 2025 & 2033
- Figure 10: Europe Lanolin Industry Revenue (million), by Application 2025 & 2033
- Figure 11: Europe Lanolin Industry Revenue Share (%), by Application 2025 & 2033
- Figure 12: Europe Lanolin Industry Revenue (million), by Country 2025 & 2033
- Figure 13: Europe Lanolin Industry Revenue Share (%), by Country 2025 & 2033
- Figure 14: South America Lanolin Industry Revenue (million), by Application 2025 & 2033
- Figure 15: South America Lanolin Industry Revenue Share (%), by Application 2025 & 2033
- Figure 16: South America Lanolin Industry Revenue (million), by Country 2025 & 2033
- Figure 17: South America Lanolin Industry Revenue Share (%), by Country 2025 & 2033
- Figure 18: Middle East and Africa Lanolin Industry Revenue (million), by Application 2025 & 2033
- Figure 19: Middle East and Africa Lanolin Industry Revenue Share (%), by Application 2025 & 2033
- Figure 20: Middle East and Africa Lanolin Industry Revenue (million), by Country 2025 & 2033
- Figure 21: Middle East and Africa Lanolin Industry Revenue Share (%), by Country 2025 & 2033
List of Tables
- Table 1: Global Lanolin Industry Revenue million Forecast, by Application 2020 & 2033
- Table 2: Global Lanolin Industry Revenue million Forecast, by Region 2020 & 2033
- Table 3: Global Lanolin Industry Revenue million Forecast, by Application 2020 & 2033
- Table 4: Global Lanolin Industry Revenue million Forecast, by Country 2020 & 2033
- Table 5: China Lanolin Industry Revenue (million) Forecast, by Application 2020 & 2033
- Table 6: India Lanolin Industry Revenue (million) Forecast, by Application 2020 & 2033
- Table 7: Japan Lanolin Industry Revenue (million) Forecast, by Application 2020 & 2033
- Table 8: South Korea Lanolin Industry Revenue (million) Forecast, by Application 2020 & 2033
- Table 9: Rest of Asia Pacific Lanolin Industry Revenue (million) Forecast, by Application 2020 & 2033
- Table 10: Global Lanolin Industry Revenue million Forecast, by Application 2020 & 2033
- Table 11: Global Lanolin Industry Revenue million Forecast, by Country 2020 & 2033
- Table 12: United States Lanolin Industry Revenue (million) Forecast, by Application 2020 & 2033
- Table 13: Canada Lanolin Industry Revenue (million) Forecast, by Application 2020 & 2033
- Table 14: Mexico Lanolin Industry Revenue (million) Forecast, by Application 2020 & 2033
- Table 15: Global Lanolin Industry Revenue million Forecast, by Application 2020 & 2033
- Table 16: Global Lanolin Industry Revenue million Forecast, by Country 2020 & 2033
- Table 17: Germany Lanolin Industry Revenue (million) Forecast, by Application 2020 & 2033
- Table 18: United Kingdom Lanolin Industry Revenue (million) Forecast, by Application 2020 & 2033
- Table 19: France Lanolin Industry Revenue (million) Forecast, by Application 2020 & 2033
- Table 20: Italy Lanolin Industry Revenue (million) Forecast, by Application 2020 & 2033
- Table 21: Rest of Europe Lanolin Industry Revenue (million) Forecast, by Application 2020 & 2033
- Table 22: Global Lanolin Industry Revenue million Forecast, by Application 2020 & 2033
- Table 23: Global Lanolin Industry Revenue million Forecast, by Country 2020 & 2033
- Table 24: Brazil Lanolin Industry Revenue (million) Forecast, by Application 2020 & 2033
- Table 25: Argentina Lanolin Industry Revenue (million) Forecast, by Application 2020 & 2033
- Table 26: Rest of South America Lanolin Industry Revenue (million) Forecast, by Application 2020 & 2033
- Table 27: Global Lanolin Industry Revenue million Forecast, by Application 2020 & 2033
- Table 28: Global Lanolin Industry Revenue million Forecast, by Country 2020 & 2033
- Table 29: Saudi Arabia Lanolin Industry Revenue (million) Forecast, by Application 2020 & 2033
- Table 30: South Africa Lanolin Industry Revenue (million) Forecast, by Application 2020 & 2033
- Table 31: Rest of Middle East and Africa Lanolin Industry Revenue (million) Forecast, by Application 2020 & 2033
Frequently Asked Questions
1. What is the projected Compound Annual Growth Rate (CAGR) of the Lanolin Industry?
The projected CAGR is approximately 3.22%.
2. Which companies are prominent players in the Lanolin Industry?
Key companies in the market include Croda International PLC, Lanotec, Lansinoh Laboratories Inc, The Lubrizol Corporation, Merck KGaA, Nippon Fine Chemical, NK Chemicals, Rolex Lanolin Products Limited, Suru Chemicals, Wellman Advanced Materials, Yixin Chemical Co Ltd, Zhejiang Garden Biochemical High-Tech Co Ltd*List Not Exhaustive.
3. What are the main segments of the Lanolin Industry?
The market segments include Application.
4. Can you provide details about the market size?
The market size is estimated to be USD 445.439 million as of 2022.
5. What are some drivers contributing to market growth?
Increasing Applications in Skin Care Products; Growing Demand for Pharmaceuticals; Other Drivers.
6. What are the notable trends driving market growth?
Growing Demand from the Cosmetics and Personal Care Industry.
7. Are there any restraints impacting market growth?
Increasing Applications in Skin Care Products; Growing Demand for Pharmaceuticals; Other Drivers.
8. Can you provide examples of recent developments in the market?
April 2023: Lanotec launched a new product line of lanolin-based lubricants, including MPX for everyday multi-purpose use, MGX for marine applications, and EGX for electrical use. All these are environmentally friendly for a variety of commercial and residential applications.
9. What pricing options are available for accessing the report?
Pricing options include single-user, multi-user, and enterprise licenses priced at USD 4750, USD 5250, and USD 8750 respectively.
10. Is the market size provided in terms of value or volume?
The market size is provided in terms of value, measured in million.
11. Are there any specific market keywords associated with the report?
Yes, the market keyword associated with the report is "Lanolin Industry," which aids in identifying and referencing the specific market segment covered.
12. How do I determine which pricing option suits my needs best?
The pricing options vary based on user requirements and access needs. Individual users may opt for single-user licenses, while businesses requiring broader access may choose multi-user or enterprise licenses for cost-effective access to the report.
13. Are there any additional resources or data provided in the Lanolin Industry report?
While the report offers comprehensive insights, it's advisable to review the specific contents or supplementary materials provided to ascertain if additional resources or data are available.
14. How can I stay updated on further developments or reports in the Lanolin Industry?
To stay informed about further developments, trends, and reports in the Lanolin Industry, consider subscribing to industry newsletters, following relevant companies and organizations, or regularly checking reputable industry news sources and publications.
Methodology
Step 1 - Identification of Relevant Samples Size from Population Database


Step 2 - Approaches for Defining Global Market Size (Value, Volume* & Price*)

Note*: In applicable scenarios
Step 3 - Data Sources
Primary Research
- Web Analytics
- Survey Reports
- Research Institute
- Latest Research Reports
- Opinion Leaders
Secondary Research
- Annual Reports
- White Paper
- Latest Press Release
- Industry Association
- Paid Database
- Investor Presentations

Step 4 - Data Triangulation
Involves using different sources of information in order to increase the validity of a study
These sources are likely to be stakeholders in a program - participants, other researchers, program staff, other community members, and so on.
Then we put all data in single framework & apply various statistical tools to find out the dynamic on the market.
During the analysis stage, feedback from the stakeholder groups would be compared to determine areas of agreement as well as areas of divergence