

Key Insights
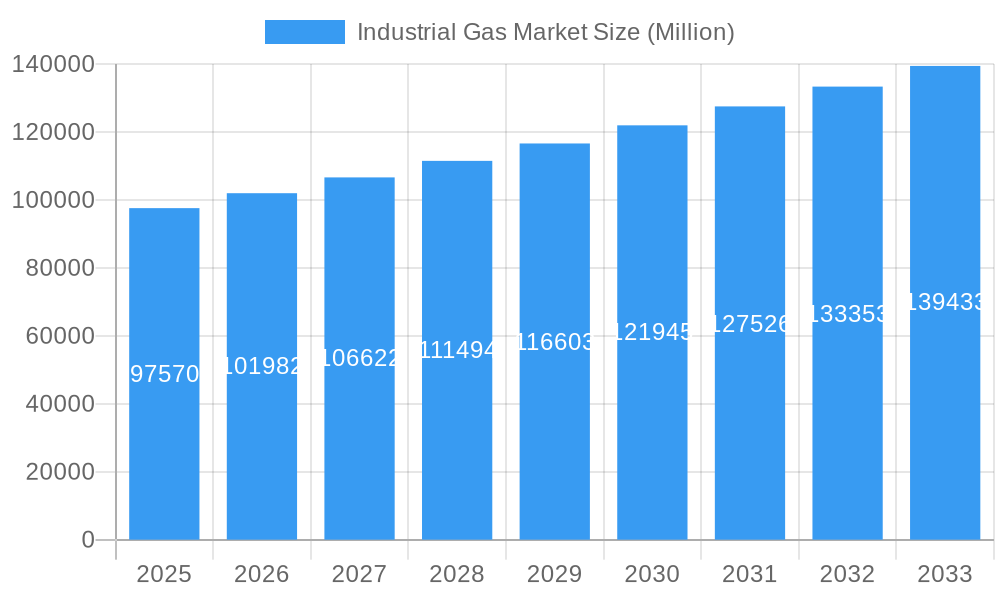
The global industrial gas market is poised for significant expansion, projected to reach $119.11 billion by 2025, exhibiting a compound annual growth rate (CAGR) of 4.4% from 2025 to 2033. This growth is propelled by increasing industrialization and escalating demand across key sectors. Prominent growth drivers include the thriving chemical processing and refining, electronics, and food and beverage industries, all of which are substantial consumers of industrial gases. The automotive and transportation sectors also contribute significantly, fueled by the growing need for high-purity gases in vehicle manufacturing and advanced fuel technologies. Additionally, the energy and power sector's shift towards cleaner energy solutions is driving demand for specific industrial gases. While Asia-Pacific, led by China and India, demonstrates robust growth potential due to rapid industrial development and infrastructure investments, North America and Europe, though mature, maintain substantial market value from their established industrial bases. Challenges such as fluctuating raw material prices and stringent environmental regulations are being addressed through technological advancements and a greater emphasis on sustainable gas production methods.
Industrial Gas Market Market Size (In Billion)
The market is segmented by product, with nitrogen, oxygen, and carbon dioxide representing the dominant segments. Hydrogen, helium, and argon also command significant market shares, serving specialized applications within the electronics and medical sectors. End-user industry analysis highlights the substantial contributions of chemical processing, electronics manufacturing, and metal fabrication. The medical and pharmaceutical sectors are anticipated to experience above-average growth, driven by increasing demand for specialized gases in healthcare. The competitive landscape features multinational corporations and regional players, with key entities such as Linde PLC, Air Products and Chemicals Inc., and Air Liquide leading through their extensive global presence and comprehensive product portfolios. Future market dynamics will be shaped by ongoing technological innovation and strategic partnerships. The forecast period of 2025-2033 indicates sustained market growth, with emerging economies and technological breakthroughs presenting significant expansion opportunities.
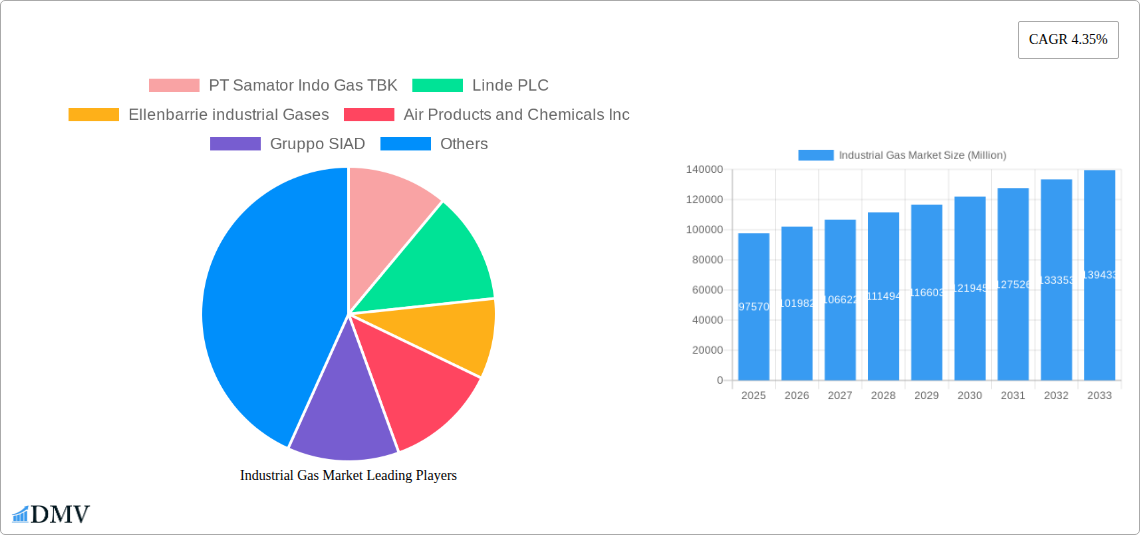
Industrial Gas Market Company Market Share
Industrial Gas Market: A Comprehensive Report (2019-2033)
This insightful report provides a detailed analysis of the global industrial gas market, encompassing historical data (2019-2024), current estimations (2025), and future projections (2025-2033). We delve into market dynamics, competitive landscapes, technological advancements, and key growth drivers to offer a comprehensive understanding of this crucial sector. The study covers a wide range of product types, end-user industries, and geographical regions, providing valuable insights for stakeholders across the value chain. The market is projected to reach xx Million by 2033.
Industrial Gas Market Composition & Trends
This section evaluates the market's competitive landscape, highlighting key trends shaping its evolution. We analyze market concentration, identifying major players and their respective market share distributions. Innovation catalysts, such as advancements in gas separation and purification technologies, are examined alongside the impact of regulatory landscapes on market growth. The analysis also includes an assessment of substitute products and their potential impact, and detailed profiles of end-user industries. Finally, significant mergers and acquisitions (M&A) activities are detailed, including estimated deal values, providing crucial insights into market consolidation and strategic shifts.
- Market Concentration: The industrial gas market is moderately concentrated, with a few major players holding significant market share. The top five players account for approximately xx% of the global market.
- M&A Activity: Significant M&A activity is observed, with deal values totaling xx Million in the past five years, driven by consolidation and expansion strategies.
- Regulatory Landscape: Stringent environmental regulations concerning emissions and safety standards are shaping industry practices and driving innovation in cleaner gas production.
- Substitute Products: The emergence of alternative technologies and materials poses some threat but overall the demand for industrial gases remains robust.
Industrial Gas Market Industry Evolution
This section explores the historical and projected growth trajectories of the industrial gas market. We analyze the influence of technological advancements, specifically in gas production, liquefaction, and transportation, on market expansion. Furthermore, we assess the shifting demands of end-user industries and their impact on product innovation and market segmentation. Specific data points, including compound annual growth rates (CAGR) and adoption rates of new technologies, are provided to illustrate the market's evolutionary path. The analysis highlights the increasing demand for high-purity gases and specialized gas mixtures, driven by evolving industry standards and applications. Furthermore, the growing focus on sustainability and reducing carbon footprints is influencing technological advancements and market dynamics.
Leading Regions, Countries, or Segments in Industrial Gas Market
This section pinpoints the leading regions, countries, and segments within the industrial gas market. The analysis identifies the dominant product types and end-user industries, focusing on factors driving their prominence.
Dominant Segments:
- Product Type: Nitrogen consistently dominates due to its widespread use across multiple industries, followed by Oxygen and Argon.
- End-user Industry: The Chemical Processing and Refining sector remains the largest consumer of industrial gases, driven by high-volume requirements.
Key Drivers of Dominance:
- Investment Trends: Significant investments in new production facilities and infrastructure are bolstering growth in leading regions.
- Regulatory Support: Government incentives and policies supporting industrial growth in key markets significantly impact regional dominance.
The dominance of specific regions and countries is further analyzed, considering factors such as industrial development, infrastructure, and government policies.
Industrial Gas Market Product Innovations
Recent years have witnessed significant product innovations, driven by advancements in gas separation technologies and the demand for high-purity gases. New gas mixtures tailored to specific applications are emerging, enhancing process efficiency and product quality in various industries. Furthermore, innovations in gas storage and delivery systems improve safety and reduce operational costs. This includes the development of lighter, more efficient cylinders and bulk storage solutions. These advancements improve performance metrics, contributing to the overall growth of the market.
Propelling Factors for Industrial Gas Market Growth
Several factors contribute to the robust growth of the industrial gas market. Technological advancements, particularly in gas production and purification, enhance efficiency and reduce costs, stimulating demand. Economic growth, especially in developing nations, fuels increased industrial activity, leading to higher gas consumption. Moreover, favorable government regulations and policies supporting industrial development further propel market expansion.
Obstacles in the Industrial Gas Market
Despite favorable growth trends, the industrial gas market faces certain challenges. Stringent environmental regulations increase production costs and necessitate investments in cleaner technologies. Supply chain disruptions, particularly in raw material sourcing, impact production and profitability. Intense competition among established players requires companies to constantly innovate and optimize their operations to maintain market share. These factors can lead to a xx% reduction in profit margins for some companies.
Future Opportunities in Industrial Gas Market
Emerging markets in developing economies present substantial growth opportunities. Furthermore, technological advancements, such as the development of carbon capture and utilization (CCU) technologies, open new avenues for revenue generation and sustainable practices. Growing demand for high-purity gases and specialized gas mixtures across various industries creates additional opportunities for market expansion.
Major Players in the Industrial Gas Market Ecosystem
- PT Samator Indo Gas TBK
- Linde PLC
- Ellenbarrie industrial Gases
- Air Products and Chemicals Inc
- Gruppo SIAD
- Bhuruka Gases Limited
- BASF SE
- Iwatani Corporation
- Asia Technical Gas Co Pte Ltd
- Sapio Group
- Messer Group GmbH
- Yingde Gases Group
- Air Liquide
- Nippon Sanso Holdings Corporation
- SOL SPA
Key Developments in Industrial Gas Market Industry
- January 2023: Iwatani Corporation's acquisition of Aspen Air US, LLC, expands its presence in the United States industrial gas sector.
- April 2023: Nippon Gases' agreement with Enel Green Power Italia for a new CO2 reuse plant showcases investment in sustainable practices and capacity expansion.
Strategic Industrial Gas Market Forecast
The industrial gas market is poised for continued growth, driven by increasing industrial activity globally and ongoing technological advancements. The demand for high-purity gases and specialized gas mixtures across diverse sectors will fuel market expansion. Further investments in sustainable practices and capacity expansions will contribute to the overall growth trajectory. The market is anticipated to witness significant consolidation through M&A activities, shaping the competitive landscape in the coming years.
Industrial Gas Market Segmentation
-
1. Product Type
- 1.1. Nitrogen
- 1.2. Oxygen
- 1.3. Carbon dioxide
- 1.4. Hydrogen
- 1.5. Helium
- 1.6. Argon
- 1.7. Ammonia
- 1.8. Methane
- 1.9. Propane
- 1.10. Butane
- 1.11. Other Product Types
-
2. End-user Industry
- 2.1. Chemical Processing and Refining
- 2.2. Electronics
- 2.3. Food and Beverage
- 2.4. Oil and Gas
- 2.5. Metal Manufacturing and Fabrication
- 2.6. Medical and Pharmaceutical
- 2.7. Automotive and Transportation
- 2.8. Energy and Power
- 2.9. Other End-user Industries
Industrial Gas Market Segmentation By Geography
-
1. Asia Pacific
- 1.1. China
- 1.2. India
- 1.3. Japan
- 1.4. South Korea
- 1.5. ASEAN Countries
- 1.6. Rest of Asia Pacific
-
2. North America
- 2.1. United States
- 2.2. Canada
- 2.3. Mexico
-
3. Europe
- 3.1. Germany
- 3.2. United Kingdom
- 3.3. France
- 3.4. Italy
- 3.5. NORDIC Countries
- 3.6. Rest of Europe
-
4. South America
- 4.1. Brazil
- 4.2. Argentina
- 4.3. Rest of South America
-
5. Middle East and Africa
- 5.1. Saudi Arabia
- 5.2. South Africa
- 5.3. Rest of Middle East and Africa
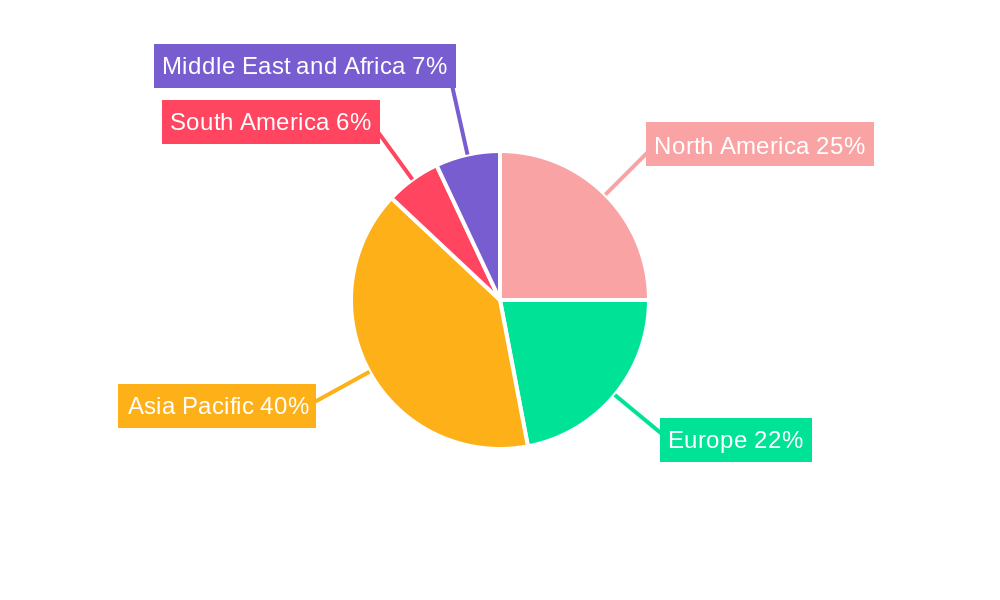
Industrial Gas Market Regional Market Share
Geographic Coverage of Industrial Gas Market
Industrial Gas Market REPORT HIGHLIGHTS
| Aspects | Details |
|---|---|
| Study Period | 2020-2034 |
| Base Year | 2025 |
| Estimated Year | 2026 |
| Forecast Period | 2026-2034 |
| Historical Period | 2020-2025 |
| Growth Rate | CAGR of 4.4% from 2020-2034 |
| Segmentation |
|
Table of Contents
- 1. Introduction
- 1.1. Research Scope
- 1.2. Market Segmentation
- 1.3. Research Objective
- 1.4. Definitions and Assumptions
- 2. Executive Summary
- 2.1. Market Snapshot
- 3. Market Dynamics
- 3.1. Market Drivers
- 3.2. Market Restrains
- 3.3. Market Trends
- 3.4. Market Opportunities
- 4. Market Factor Analysis
- 4.1. Porters Five Forces
- 4.1.1. Bargaining Power of Suppliers
- 4.1.2. Bargaining Power of Buyers
- 4.1.3. Threat of New Entrants
- 4.1.4. Threat of Substitutes
- 4.1.5. Competitive Rivalry
- 4.2. PESTEL analysis
- 4.3. BCG Analysis
- 4.3.1. Stars (High Growth, High Market Share)
- 4.3.2. Cash Cows (Low Growth, High Market Share)
- 4.3.3. Question Mark (High Growth, Low Market Share)
- 4.3.4. Dogs (Low Growth, Low Market Share)
- 4.4. Ansoff Matrix Analysis
- 4.5. Supply Chain Analysis
- 4.6. Regulatory Landscape
- 4.7. Current Market Potential and Opportunity Assessment (TAM–SAM–SOM Framework)
- 4.8. DMV Analyst Note
- 4.1. Porters Five Forces
- 5. Market Analysis, Insights and Forecast 2021-2033
- 5.1. Market Analysis, Insights and Forecast - by Product Type
- 5.1.1. Nitrogen
- 5.1.2. Oxygen
- 5.1.3. Carbon dioxide
- 5.1.4. Hydrogen
- 5.1.5. Helium
- 5.1.6. Argon
- 5.1.7. Ammonia
- 5.1.8. Methane
- 5.1.9. Propane
- 5.1.10. Butane
- 5.1.11. Other Product Types
- 5.2. Market Analysis, Insights and Forecast - by End-user Industry
- 5.2.1. Chemical Processing and Refining
- 5.2.2. Electronics
- 5.2.3. Food and Beverage
- 5.2.4. Oil and Gas
- 5.2.5. Metal Manufacturing and Fabrication
- 5.2.6. Medical and Pharmaceutical
- 5.2.7. Automotive and Transportation
- 5.2.8. Energy and Power
- 5.2.9. Other End-user Industries
- 5.3. Market Analysis, Insights and Forecast - by Region
- 5.3.1. Asia Pacific
- 5.3.2. North America
- 5.3.3. Europe
- 5.3.4. South America
- 5.3.5. Middle East and Africa
- 5.1. Market Analysis, Insights and Forecast - by Product Type
- 6. Global Industrial Gas Market Analysis, Insights and Forecast, 2021-2033
- 6.1. Market Analysis, Insights and Forecast - by Product Type
- 6.1.1. Nitrogen
- 6.1.2. Oxygen
- 6.1.3. Carbon dioxide
- 6.1.4. Hydrogen
- 6.1.5. Helium
- 6.1.6. Argon
- 6.1.7. Ammonia
- 6.1.8. Methane
- 6.1.9. Propane
- 6.1.10. Butane
- 6.1.11. Other Product Types
- 6.2. Market Analysis, Insights and Forecast - by End-user Industry
- 6.2.1. Chemical Processing and Refining
- 6.2.2. Electronics
- 6.2.3. Food and Beverage
- 6.2.4. Oil and Gas
- 6.2.5. Metal Manufacturing and Fabrication
- 6.2.6. Medical and Pharmaceutical
- 6.2.7. Automotive and Transportation
- 6.2.8. Energy and Power
- 6.2.9. Other End-user Industries
- 6.1. Market Analysis, Insights and Forecast - by Product Type
- 7. Asia Pacific Industrial Gas Market Analysis, Insights and Forecast, 2020-2032
- 7.1. Market Analysis, Insights and Forecast - by Product Type
- 7.1.1. Nitrogen
- 7.1.2. Oxygen
- 7.1.3. Carbon dioxide
- 7.1.4. Hydrogen
- 7.1.5. Helium
- 7.1.6. Argon
- 7.1.7. Ammonia
- 7.1.8. Methane
- 7.1.9. Propane
- 7.1.10. Butane
- 7.1.11. Other Product Types
- 7.2. Market Analysis, Insights and Forecast - by End-user Industry
- 7.2.1. Chemical Processing and Refining
- 7.2.2. Electronics
- 7.2.3. Food and Beverage
- 7.2.4. Oil and Gas
- 7.2.5. Metal Manufacturing and Fabrication
- 7.2.6. Medical and Pharmaceutical
- 7.2.7. Automotive and Transportation
- 7.2.8. Energy and Power
- 7.2.9. Other End-user Industries
- 7.1. Market Analysis, Insights and Forecast - by Product Type
- 8. North America Industrial Gas Market Analysis, Insights and Forecast, 2020-2032
- 8.1. Market Analysis, Insights and Forecast - by Product Type
- 8.1.1. Nitrogen
- 8.1.2. Oxygen
- 8.1.3. Carbon dioxide
- 8.1.4. Hydrogen
- 8.1.5. Helium
- 8.1.6. Argon
- 8.1.7. Ammonia
- 8.1.8. Methane
- 8.1.9. Propane
- 8.1.10. Butane
- 8.1.11. Other Product Types
- 8.2. Market Analysis, Insights and Forecast - by End-user Industry
- 8.2.1. Chemical Processing and Refining
- 8.2.2. Electronics
- 8.2.3. Food and Beverage
- 8.2.4. Oil and Gas
- 8.2.5. Metal Manufacturing and Fabrication
- 8.2.6. Medical and Pharmaceutical
- 8.2.7. Automotive and Transportation
- 8.2.8. Energy and Power
- 8.2.9. Other End-user Industries
- 8.1. Market Analysis, Insights and Forecast - by Product Type
- 9. Europe Industrial Gas Market Analysis, Insights and Forecast, 2020-2032
- 9.1. Market Analysis, Insights and Forecast - by Product Type
- 9.1.1. Nitrogen
- 9.1.2. Oxygen
- 9.1.3. Carbon dioxide
- 9.1.4. Hydrogen
- 9.1.5. Helium
- 9.1.6. Argon
- 9.1.7. Ammonia
- 9.1.8. Methane
- 9.1.9. Propane
- 9.1.10. Butane
- 9.1.11. Other Product Types
- 9.2. Market Analysis, Insights and Forecast - by End-user Industry
- 9.2.1. Chemical Processing and Refining
- 9.2.2. Electronics
- 9.2.3. Food and Beverage
- 9.2.4. Oil and Gas
- 9.2.5. Metal Manufacturing and Fabrication
- 9.2.6. Medical and Pharmaceutical
- 9.2.7. Automotive and Transportation
- 9.2.8. Energy and Power
- 9.2.9. Other End-user Industries
- 9.1. Market Analysis, Insights and Forecast - by Product Type
- 10. South America Industrial Gas Market Analysis, Insights and Forecast, 2020-2032
- 10.1. Market Analysis, Insights and Forecast - by Product Type
- 10.1.1. Nitrogen
- 10.1.2. Oxygen
- 10.1.3. Carbon dioxide
- 10.1.4. Hydrogen
- 10.1.5. Helium
- 10.1.6. Argon
- 10.1.7. Ammonia
- 10.1.8. Methane
- 10.1.9. Propane
- 10.1.10. Butane
- 10.1.11. Other Product Types
- 10.2. Market Analysis, Insights and Forecast - by End-user Industry
- 10.2.1. Chemical Processing and Refining
- 10.2.2. Electronics
- 10.2.3. Food and Beverage
- 10.2.4. Oil and Gas
- 10.2.5. Metal Manufacturing and Fabrication
- 10.2.6. Medical and Pharmaceutical
- 10.2.7. Automotive and Transportation
- 10.2.8. Energy and Power
- 10.2.9. Other End-user Industries
- 10.1. Market Analysis, Insights and Forecast - by Product Type
- 11. Middle East and Africa Industrial Gas Market Analysis, Insights and Forecast, 2020-2032
- 11.1. Market Analysis, Insights and Forecast - by Product Type
- 11.1.1. Nitrogen
- 11.1.2. Oxygen
- 11.1.3. Carbon dioxide
- 11.1.4. Hydrogen
- 11.1.5. Helium
- 11.1.6. Argon
- 11.1.7. Ammonia
- 11.1.8. Methane
- 11.1.9. Propane
- 11.1.10. Butane
- 11.1.11. Other Product Types
- 11.2. Market Analysis, Insights and Forecast - by End-user Industry
- 11.2.1. Chemical Processing and Refining
- 11.2.2. Electronics
- 11.2.3. Food and Beverage
- 11.2.4. Oil and Gas
- 11.2.5. Metal Manufacturing and Fabrication
- 11.2.6. Medical and Pharmaceutical
- 11.2.7. Automotive and Transportation
- 11.2.8. Energy and Power
- 11.2.9. Other End-user Industries
- 11.1. Market Analysis, Insights and Forecast - by Product Type
- 12. Competitive Analysis
- 12.1. Company Profiles
- 12.1.1 PT Samator Indo Gas TBK
- 12.1.1.1. Company Overview
- 12.1.1.2. Products
- 12.1.1.3. Company Financials
- 12.1.1.4. SWOT Analysis
- 12.1.2 Linde PLC
- 12.1.2.1. Company Overview
- 12.1.2.2. Products
- 12.1.2.3. Company Financials
- 12.1.2.4. SWOT Analysis
- 12.1.3 Ellenbarrie industrial Gases
- 12.1.3.1. Company Overview
- 12.1.3.2. Products
- 12.1.3.3. Company Financials
- 12.1.3.4. SWOT Analysis
- 12.1.4 Air Products and Chemicals Inc
- 12.1.4.1. Company Overview
- 12.1.4.2. Products
- 12.1.4.3. Company Financials
- 12.1.4.4. SWOT Analysis
- 12.1.5 Gruppo SIAD
- 12.1.5.1. Company Overview
- 12.1.5.2. Products
- 12.1.5.3. Company Financials
- 12.1.5.4. SWOT Analysis
- 12.1.6 Bhuruka Gases Limited
- 12.1.6.1. Company Overview
- 12.1.6.2. Products
- 12.1.6.3. Company Financials
- 12.1.6.4. SWOT Analysis
- 12.1.7 BASF SE
- 12.1.7.1. Company Overview
- 12.1.7.2. Products
- 12.1.7.3. Company Financials
- 12.1.7.4. SWOT Analysis
- 12.1.8 Iwatani Corporation
- 12.1.8.1. Company Overview
- 12.1.8.2. Products
- 12.1.8.3. Company Financials
- 12.1.8.4. SWOT Analysis
- 12.1.9 Asia Technical Gas Co Pte Ltd
- 12.1.9.1. Company Overview
- 12.1.9.2. Products
- 12.1.9.3. Company Financials
- 12.1.9.4. SWOT Analysis
- 12.1.10 Sapio Group
- 12.1.10.1. Company Overview
- 12.1.10.2. Products
- 12.1.10.3. Company Financials
- 12.1.10.4. SWOT Analysis
- 12.1.11 Messer Group GmbH
- 12.1.11.1. Company Overview
- 12.1.11.2. Products
- 12.1.11.3. Company Financials
- 12.1.11.4. SWOT Analysis
- 12.1.12 Yingde Gases Group*List Not Exhaustive
- 12.1.12.1. Company Overview
- 12.1.12.2. Products
- 12.1.12.3. Company Financials
- 12.1.12.4. SWOT Analysis
- 12.1.13 Air Liquide
- 12.1.13.1. Company Overview
- 12.1.13.2. Products
- 12.1.13.3. Company Financials
- 12.1.13.4. SWOT Analysis
- 12.1.14 Nippon Sanso Holdings Corporation
- 12.1.14.1. Company Overview
- 12.1.14.2. Products
- 12.1.14.3. Company Financials
- 12.1.14.4. SWOT Analysis
- 12.1.15 SOL SPA
- 12.1.15.1. Company Overview
- 12.1.15.2. Products
- 12.1.15.3. Company Financials
- 12.1.15.4. SWOT Analysis
- 12.1.1 PT Samator Indo Gas TBK
- 12.2. Market Entropy
- 12.2.1 Company's Key Areas Served
- 12.2.2 Recent Developments
- 12.3. Company Market Share Analysis 2025
- 12.3.1 Top 5 Companies Market Share Analysis
- 12.3.2 Top 3 Companies Market Share Analysis
- 12.4. List of Potential Customers
- 13. Research Methodology
List of Figures
- Figure 1: Global Industrial Gas Market Revenue Breakdown (billion, %) by Region 2025 & 2033
- Figure 2: Global Industrial Gas Market Volume Breakdown (K Tons, %) by Region 2025 & 2033
- Figure 3: Asia Pacific Industrial Gas Market Revenue (billion), by Product Type 2025 & 2033
- Figure 4: Asia Pacific Industrial Gas Market Volume (K Tons), by Product Type 2025 & 2033
- Figure 5: Asia Pacific Industrial Gas Market Revenue Share (%), by Product Type 2025 & 2033
- Figure 6: Asia Pacific Industrial Gas Market Volume Share (%), by Product Type 2025 & 2033
- Figure 7: Asia Pacific Industrial Gas Market Revenue (billion), by End-user Industry 2025 & 2033
- Figure 8: Asia Pacific Industrial Gas Market Volume (K Tons), by End-user Industry 2025 & 2033
- Figure 9: Asia Pacific Industrial Gas Market Revenue Share (%), by End-user Industry 2025 & 2033
- Figure 10: Asia Pacific Industrial Gas Market Volume Share (%), by End-user Industry 2025 & 2033
- Figure 11: Asia Pacific Industrial Gas Market Revenue (billion), by Country 2025 & 2033
- Figure 12: Asia Pacific Industrial Gas Market Volume (K Tons), by Country 2025 & 2033
- Figure 13: Asia Pacific Industrial Gas Market Revenue Share (%), by Country 2025 & 2033
- Figure 14: Asia Pacific Industrial Gas Market Volume Share (%), by Country 2025 & 2033
- Figure 15: North America Industrial Gas Market Revenue (billion), by Product Type 2025 & 2033
- Figure 16: North America Industrial Gas Market Volume (K Tons), by Product Type 2025 & 2033
- Figure 17: North America Industrial Gas Market Revenue Share (%), by Product Type 2025 & 2033
- Figure 18: North America Industrial Gas Market Volume Share (%), by Product Type 2025 & 2033
- Figure 19: North America Industrial Gas Market Revenue (billion), by End-user Industry 2025 & 2033
- Figure 20: North America Industrial Gas Market Volume (K Tons), by End-user Industry 2025 & 2033
- Figure 21: North America Industrial Gas Market Revenue Share (%), by End-user Industry 2025 & 2033
- Figure 22: North America Industrial Gas Market Volume Share (%), by End-user Industry 2025 & 2033
- Figure 23: North America Industrial Gas Market Revenue (billion), by Country 2025 & 2033
- Figure 24: North America Industrial Gas Market Volume (K Tons), by Country 2025 & 2033
- Figure 25: North America Industrial Gas Market Revenue Share (%), by Country 2025 & 2033
- Figure 26: North America Industrial Gas Market Volume Share (%), by Country 2025 & 2033
- Figure 27: Europe Industrial Gas Market Revenue (billion), by Product Type 2025 & 2033
- Figure 28: Europe Industrial Gas Market Volume (K Tons), by Product Type 2025 & 2033
- Figure 29: Europe Industrial Gas Market Revenue Share (%), by Product Type 2025 & 2033
- Figure 30: Europe Industrial Gas Market Volume Share (%), by Product Type 2025 & 2033
- Figure 31: Europe Industrial Gas Market Revenue (billion), by End-user Industry 2025 & 2033
- Figure 32: Europe Industrial Gas Market Volume (K Tons), by End-user Industry 2025 & 2033
- Figure 33: Europe Industrial Gas Market Revenue Share (%), by End-user Industry 2025 & 2033
- Figure 34: Europe Industrial Gas Market Volume Share (%), by End-user Industry 2025 & 2033
- Figure 35: Europe Industrial Gas Market Revenue (billion), by Country 2025 & 2033
- Figure 36: Europe Industrial Gas Market Volume (K Tons), by Country 2025 & 2033
- Figure 37: Europe Industrial Gas Market Revenue Share (%), by Country 2025 & 2033
- Figure 38: Europe Industrial Gas Market Volume Share (%), by Country 2025 & 2033
- Figure 39: South America Industrial Gas Market Revenue (billion), by Product Type 2025 & 2033
- Figure 40: South America Industrial Gas Market Volume (K Tons), by Product Type 2025 & 2033
- Figure 41: South America Industrial Gas Market Revenue Share (%), by Product Type 2025 & 2033
- Figure 42: South America Industrial Gas Market Volume Share (%), by Product Type 2025 & 2033
- Figure 43: South America Industrial Gas Market Revenue (billion), by End-user Industry 2025 & 2033
- Figure 44: South America Industrial Gas Market Volume (K Tons), by End-user Industry 2025 & 2033
- Figure 45: South America Industrial Gas Market Revenue Share (%), by End-user Industry 2025 & 2033
- Figure 46: South America Industrial Gas Market Volume Share (%), by End-user Industry 2025 & 2033
- Figure 47: South America Industrial Gas Market Revenue (billion), by Country 2025 & 2033
- Figure 48: South America Industrial Gas Market Volume (K Tons), by Country 2025 & 2033
- Figure 49: South America Industrial Gas Market Revenue Share (%), by Country 2025 & 2033
- Figure 50: South America Industrial Gas Market Volume Share (%), by Country 2025 & 2033
- Figure 51: Middle East and Africa Industrial Gas Market Revenue (billion), by Product Type 2025 & 2033
- Figure 52: Middle East and Africa Industrial Gas Market Volume (K Tons), by Product Type 2025 & 2033
- Figure 53: Middle East and Africa Industrial Gas Market Revenue Share (%), by Product Type 2025 & 2033
- Figure 54: Middle East and Africa Industrial Gas Market Volume Share (%), by Product Type 2025 & 2033
- Figure 55: Middle East and Africa Industrial Gas Market Revenue (billion), by End-user Industry 2025 & 2033
- Figure 56: Middle East and Africa Industrial Gas Market Volume (K Tons), by End-user Industry 2025 & 2033
- Figure 57: Middle East and Africa Industrial Gas Market Revenue Share (%), by End-user Industry 2025 & 2033
- Figure 58: Middle East and Africa Industrial Gas Market Volume Share (%), by End-user Industry 2025 & 2033
- Figure 59: Middle East and Africa Industrial Gas Market Revenue (billion), by Country 2025 & 2033
- Figure 60: Middle East and Africa Industrial Gas Market Volume (K Tons), by Country 2025 & 2033
- Figure 61: Middle East and Africa Industrial Gas Market Revenue Share (%), by Country 2025 & 2033
- Figure 62: Middle East and Africa Industrial Gas Market Volume Share (%), by Country 2025 & 2033
List of Tables
- Table 1: Global Industrial Gas Market Revenue billion Forecast, by Product Type 2020 & 2033
- Table 2: Global Industrial Gas Market Volume K Tons Forecast, by Product Type 2020 & 2033
- Table 3: Global Industrial Gas Market Revenue billion Forecast, by End-user Industry 2020 & 2033
- Table 4: Global Industrial Gas Market Volume K Tons Forecast, by End-user Industry 2020 & 2033
- Table 5: Global Industrial Gas Market Revenue billion Forecast, by Region 2020 & 2033
- Table 6: Global Industrial Gas Market Volume K Tons Forecast, by Region 2020 & 2033
- Table 7: Global Industrial Gas Market Revenue billion Forecast, by Product Type 2020 & 2033
- Table 8: Global Industrial Gas Market Volume K Tons Forecast, by Product Type 2020 & 2033
- Table 9: Global Industrial Gas Market Revenue billion Forecast, by End-user Industry 2020 & 2033
- Table 10: Global Industrial Gas Market Volume K Tons Forecast, by End-user Industry 2020 & 2033
- Table 11: Global Industrial Gas Market Revenue billion Forecast, by Country 2020 & 2033
- Table 12: Global Industrial Gas Market Volume K Tons Forecast, by Country 2020 & 2033
- Table 13: China Industrial Gas Market Revenue (billion) Forecast, by Application 2020 & 2033
- Table 14: China Industrial Gas Market Volume (K Tons) Forecast, by Application 2020 & 2033
- Table 15: India Industrial Gas Market Revenue (billion) Forecast, by Application 2020 & 2033
- Table 16: India Industrial Gas Market Volume (K Tons) Forecast, by Application 2020 & 2033
- Table 17: Japan Industrial Gas Market Revenue (billion) Forecast, by Application 2020 & 2033
- Table 18: Japan Industrial Gas Market Volume (K Tons) Forecast, by Application 2020 & 2033
- Table 19: South Korea Industrial Gas Market Revenue (billion) Forecast, by Application 2020 & 2033
- Table 20: South Korea Industrial Gas Market Volume (K Tons) Forecast, by Application 2020 & 2033
- Table 21: ASEAN Countries Industrial Gas Market Revenue (billion) Forecast, by Application 2020 & 2033
- Table 22: ASEAN Countries Industrial Gas Market Volume (K Tons) Forecast, by Application 2020 & 2033
- Table 23: Rest of Asia Pacific Industrial Gas Market Revenue (billion) Forecast, by Application 2020 & 2033
- Table 24: Rest of Asia Pacific Industrial Gas Market Volume (K Tons) Forecast, by Application 2020 & 2033
- Table 25: Global Industrial Gas Market Revenue billion Forecast, by Product Type 2020 & 2033
- Table 26: Global Industrial Gas Market Volume K Tons Forecast, by Product Type 2020 & 2033
- Table 27: Global Industrial Gas Market Revenue billion Forecast, by End-user Industry 2020 & 2033
- Table 28: Global Industrial Gas Market Volume K Tons Forecast, by End-user Industry 2020 & 2033
- Table 29: Global Industrial Gas Market Revenue billion Forecast, by Country 2020 & 2033
- Table 30: Global Industrial Gas Market Volume K Tons Forecast, by Country 2020 & 2033
- Table 31: United States Industrial Gas Market Revenue (billion) Forecast, by Application 2020 & 2033
- Table 32: United States Industrial Gas Market Volume (K Tons) Forecast, by Application 2020 & 2033
- Table 33: Canada Industrial Gas Market Revenue (billion) Forecast, by Application 2020 & 2033
- Table 34: Canada Industrial Gas Market Volume (K Tons) Forecast, by Application 2020 & 2033
- Table 35: Mexico Industrial Gas Market Revenue (billion) Forecast, by Application 2020 & 2033
- Table 36: Mexico Industrial Gas Market Volume (K Tons) Forecast, by Application 2020 & 2033
- Table 37: Global Industrial Gas Market Revenue billion Forecast, by Product Type 2020 & 2033
- Table 38: Global Industrial Gas Market Volume K Tons Forecast, by Product Type 2020 & 2033
- Table 39: Global Industrial Gas Market Revenue billion Forecast, by End-user Industry 2020 & 2033
- Table 40: Global Industrial Gas Market Volume K Tons Forecast, by End-user Industry 2020 & 2033
- Table 41: Global Industrial Gas Market Revenue billion Forecast, by Country 2020 & 2033
- Table 42: Global Industrial Gas Market Volume K Tons Forecast, by Country 2020 & 2033
- Table 43: Germany Industrial Gas Market Revenue (billion) Forecast, by Application 2020 & 2033
- Table 44: Germany Industrial Gas Market Volume (K Tons) Forecast, by Application 2020 & 2033
- Table 45: United Kingdom Industrial Gas Market Revenue (billion) Forecast, by Application 2020 & 2033
- Table 46: United Kingdom Industrial Gas Market Volume (K Tons) Forecast, by Application 2020 & 2033
- Table 47: France Industrial Gas Market Revenue (billion) Forecast, by Application 2020 & 2033
- Table 48: France Industrial Gas Market Volume (K Tons) Forecast, by Application 2020 & 2033
- Table 49: Italy Industrial Gas Market Revenue (billion) Forecast, by Application 2020 & 2033
- Table 50: Italy Industrial Gas Market Volume (K Tons) Forecast, by Application 2020 & 2033
- Table 51: NORDIC Countries Industrial Gas Market Revenue (billion) Forecast, by Application 2020 & 2033
- Table 52: NORDIC Countries Industrial Gas Market Volume (K Tons) Forecast, by Application 2020 & 2033
- Table 53: Rest of Europe Industrial Gas Market Revenue (billion) Forecast, by Application 2020 & 2033
- Table 54: Rest of Europe Industrial Gas Market Volume (K Tons) Forecast, by Application 2020 & 2033
- Table 55: Global Industrial Gas Market Revenue billion Forecast, by Product Type 2020 & 2033
- Table 56: Global Industrial Gas Market Volume K Tons Forecast, by Product Type 2020 & 2033
- Table 57: Global Industrial Gas Market Revenue billion Forecast, by End-user Industry 2020 & 2033
- Table 58: Global Industrial Gas Market Volume K Tons Forecast, by End-user Industry 2020 & 2033
- Table 59: Global Industrial Gas Market Revenue billion Forecast, by Country 2020 & 2033
- Table 60: Global Industrial Gas Market Volume K Tons Forecast, by Country 2020 & 2033
- Table 61: Brazil Industrial Gas Market Revenue (billion) Forecast, by Application 2020 & 2033
- Table 62: Brazil Industrial Gas Market Volume (K Tons) Forecast, by Application 2020 & 2033
- Table 63: Argentina Industrial Gas Market Revenue (billion) Forecast, by Application 2020 & 2033
- Table 64: Argentina Industrial Gas Market Volume (K Tons) Forecast, by Application 2020 & 2033
- Table 65: Rest of South America Industrial Gas Market Revenue (billion) Forecast, by Application 2020 & 2033
- Table 66: Rest of South America Industrial Gas Market Volume (K Tons) Forecast, by Application 2020 & 2033
- Table 67: Global Industrial Gas Market Revenue billion Forecast, by Product Type 2020 & 2033
- Table 68: Global Industrial Gas Market Volume K Tons Forecast, by Product Type 2020 & 2033
- Table 69: Global Industrial Gas Market Revenue billion Forecast, by End-user Industry 2020 & 2033
- Table 70: Global Industrial Gas Market Volume K Tons Forecast, by End-user Industry 2020 & 2033
- Table 71: Global Industrial Gas Market Revenue billion Forecast, by Country 2020 & 2033
- Table 72: Global Industrial Gas Market Volume K Tons Forecast, by Country 2020 & 2033
- Table 73: Saudi Arabia Industrial Gas Market Revenue (billion) Forecast, by Application 2020 & 2033
- Table 74: Saudi Arabia Industrial Gas Market Volume (K Tons) Forecast, by Application 2020 & 2033
- Table 75: South Africa Industrial Gas Market Revenue (billion) Forecast, by Application 2020 & 2033
- Table 76: South Africa Industrial Gas Market Volume (K Tons) Forecast, by Application 2020 & 2033
- Table 77: Rest of Middle East and Africa Industrial Gas Market Revenue (billion) Forecast, by Application 2020 & 2033
- Table 78: Rest of Middle East and Africa Industrial Gas Market Volume (K Tons) Forecast, by Application 2020 & 2033
Frequently Asked Questions
1. What is the projected Compound Annual Growth Rate (CAGR) of the Industrial Gas Market?
The projected CAGR is approximately 4.4%.
2. Which companies are prominent players in the Industrial Gas Market?
Key companies in the market include PT Samator Indo Gas TBK, Linde PLC, Ellenbarrie industrial Gases, Air Products and Chemicals Inc, Gruppo SIAD, Bhuruka Gases Limited, BASF SE, Iwatani Corporation, Asia Technical Gas Co Pte Ltd, Sapio Group, Messer Group GmbH, Yingde Gases Group*List Not Exhaustive, Air Liquide, Nippon Sanso Holdings Corporation, SOL SPA.
3. What are the main segments of the Industrial Gas Market?
The market segments include Product Type, End-user Industry.
4. Can you provide details about the market size?
The market size is estimated to be USD 119.11 billion as of 2022.
5. What are some drivers contributing to market growth?
Growing Need for Alternate Energy Sources; Increasing Demand For Frozen and Stored Food; Increasing Demand from the Healthcare Sector.
6. What are the notable trends driving market growth?
Increasing Demand from the Medical and Pharmaceutical Sector.
7. Are there any restraints impacting market growth?
Environmental Regulations and Safety Issues; Other Restraints.
8. Can you provide examples of recent developments in the market?
April 2023: Nippon Gases Operations, a division of Nippon Gases Italia, announced the signing of an agreement with Enel Green Power Italia to construct a new plant for the reuse, purification, and liquefaction of CO2, naturally present in the geothermal fluids of the Piancastagnaio power plants in the province of Siena for food purposes. The significant investment is part of a series of operations planned by the company in Italy to improve production capacity, competitiveness, and customer closeness, emphasizing long-term growth.
9. What pricing options are available for accessing the report?
Pricing options include single-user, multi-user, and enterprise licenses priced at USD 4750, USD 5250, and USD 8750 respectively.
10. Is the market size provided in terms of value or volume?
The market size is provided in terms of value, measured in billion and volume, measured in K Tons.
11. Are there any specific market keywords associated with the report?
Yes, the market keyword associated with the report is "Industrial Gas Market," which aids in identifying and referencing the specific market segment covered.
12. How do I determine which pricing option suits my needs best?
The pricing options vary based on user requirements and access needs. Individual users may opt for single-user licenses, while businesses requiring broader access may choose multi-user or enterprise licenses for cost-effective access to the report.
13. Are there any additional resources or data provided in the Industrial Gas Market report?
While the report offers comprehensive insights, it's advisable to review the specific contents or supplementary materials provided to ascertain if additional resources or data are available.
14. How can I stay updated on further developments or reports in the Industrial Gas Market?
To stay informed about further developments, trends, and reports in the Industrial Gas Market, consider subscribing to industry newsletters, following relevant companies and organizations, or regularly checking reputable industry news sources and publications.
Methodology
Step 1 - Identification of Relevant Samples Size from Population Database


Step 2 - Approaches for Defining Global Market Size (Value, Volume* & Price*)

Note*: In applicable scenarios
Step 3 - Data Sources
Primary Research
- Web Analytics
- Survey Reports
- Research Institute
- Latest Research Reports
- Opinion Leaders
Secondary Research
- Annual Reports
- White Paper
- Latest Press Release
- Industry Association
- Paid Database
- Investor Presentations

Step 4 - Data Triangulation
Involves using different sources of information in order to increase the validity of a study
These sources are likely to be stakeholders in a program - participants, other researchers, program staff, other community members, and so on.
Then we put all data in single framework & apply various statistical tools to find out the dynamic on the market.
During the analysis stage, feedback from the stakeholder groups would be compared to determine areas of agreement as well as areas of divergence