

Key Insights
The global hydrogen gas market, valued at $204.86 billion in 2025, is poised for significant expansion, projecting a compound annual growth rate (CAGR) of 8.6% between 2025 and 2033. This growth is primarily fueled by the escalating worldwide demand for sustainable energy, with notable applications in transportation and industrial sectors. The increasing integration of hydrogen fuel cells in vehicles, driven by supportive government policies and environmental imperatives, represents a key market stimulant. Moreover, the expanding use of hydrogen in industrial processes, including ammonia production, methanol synthesis, refining, and direct reduced iron (DRI) manufacturing, further bolsters market ascendancy. The global shift towards a low-carbon economy intensifies the demand for hydrogen, establishing it as a vital element in decarbonization efforts across diverse industries.
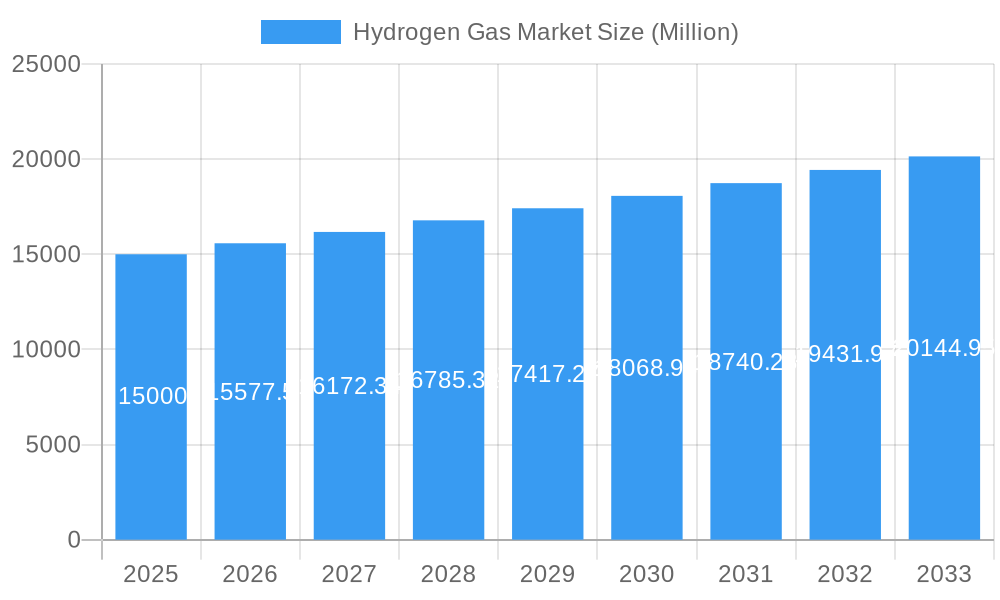
Hydrogen Gas Market Market Size (In Billion)
Despite its promising trajectory, the hydrogen gas market encounters certain limitations. The substantial production costs, particularly for electrolysis-based hydrogen, present a barrier to widespread adoption. Furthermore, the development of an extensive hydrogen infrastructure, encompassing pipelines and storage solutions, necessitates considerable capital investment and logistical planning. Addressing safety considerations associated with hydrogen handling and transportation is also paramount for sustained market advancement. Nevertheless, continuous innovation in hydrogen production, storage, and distribution technologies is expected to alleviate these obstacles and unlock greater market opportunities. Segmentation analysis indicates that while pipelines currently dominate distribution, high-pressure tube trailers and cylinders are projected to see increased adoption corresponding with rising application-specific demand. Geographically, the Asia-Pacific region, led by China and India, is anticipated to spearhead market growth, supported by robust industrialization and favorable governmental initiatives.
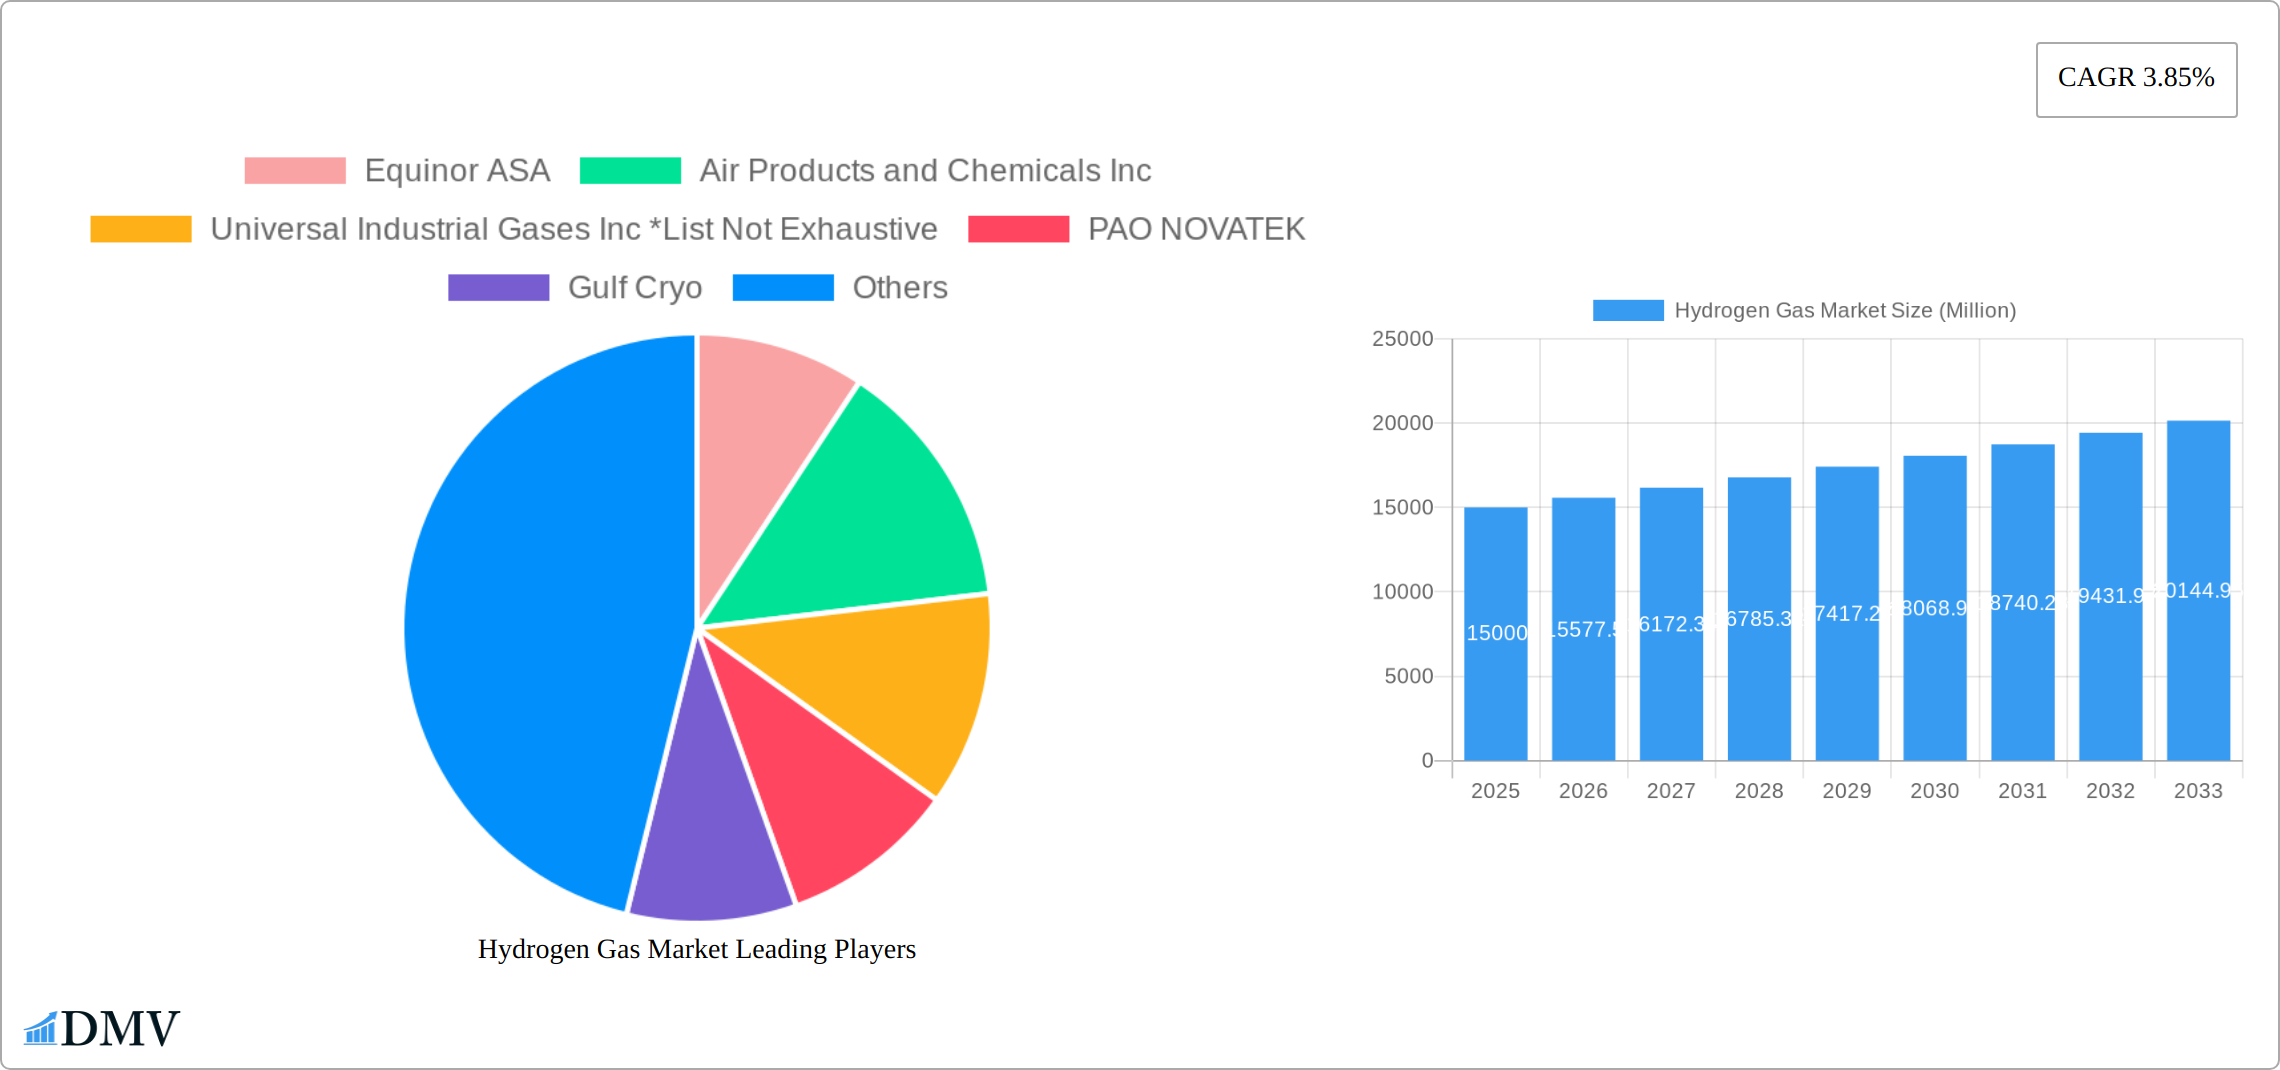
Hydrogen Gas Market Company Market Share
Hydrogen Gas Market Market Composition & Trends
The Hydrogen Gas Market is characterized by a dynamic interplay of market concentration, innovation catalysts, regulatory landscapes, substitute products, end-user profiles, and merger and acquisition activities. The market's concentration is driven by a few key players who hold significant market shares, with the top five companies, including Equinor ASA, Air Products and Chemicals Inc, and Linde plc, commanding approximately 40% of the market. Innovation is spurred by the need for cleaner energy solutions, leading to technological advancements in hydrogen production and storage. Regulatory landscapes vary by region, with Europe and North America leading in supportive policies for hydrogen energy. Substitute products like natural gas and electricity pose challenges, but hydrogen's versatility across applications from ammonia production to fuel cell vehicles offers unique advantages. End-user profiles range from industrial giants in chemical and refining sectors to emerging markets in fuel cell vehicles. M&A activities have been robust, with deal values reaching over $100 Million in the past year, reflecting the strategic consolidation and investment in the sector.
- Market Share Distribution: Top five companies hold 40% of the market.
- Innovation Catalysts: Need for cleaner energy solutions.
- Regulatory Landscapes: Europe and North America lead in supportive policies.
- Substitute Products: Natural gas and electricity.
- End-User Profiles: Industrial sectors and emerging fuel cell markets.
- M&A Activities: Over $100 Million in deal values in the past year.
Hydrogen Gas Market Industry Evolution
The Hydrogen Gas Market has evolved significantly over the study period from 2019 to 2033, with a notable growth trajectory fueled by technological advancements and shifting consumer demands. The base year of 2025 marked a turning point with an estimated market value of $xx Million, projected to grow at a compound annual growth rate (CAGR) of 6.5% during the forecast period from 2025 to 2033. Technological advancements have been pivotal, with breakthroughs in electrolysis and hydrogen storage enhancing efficiency and reducing costs. The adoption of hydrogen in fuel cell vehicles (FCV) has surged, with a 20% increase in demand noted in 2024. Consumer demands are shifting towards sustainable energy solutions, driving the market towards greener hydrogen production methods like green and blue hydrogen. The historical period from 2019 to 2024 saw a steady growth rate of 4.5%, reflecting the early stages of market adoption. As the market continues to evolve, the focus on infrastructure development, including pipelines and high-pressure tube trailers, will be crucial for sustaining growth and meeting rising demand.
Leading Regions, Countries, or Segments in Hydrogen Gas Market
The Hydrogen Gas Market exhibits varying degrees of dominance across regions, countries, and segments. Europe stands out as a leading region, driven by robust investment trends and regulatory support for hydrogen as a clean energy source. Within Europe, Germany emerges as a key player, with significant investments in hydrogen infrastructure and a projected market growth rate of 7% over the forecast period.
- Key Drivers in Europe:
- Investment trends: Over $500 Million invested in hydrogen projects in 2024.
- Regulatory support: European Green Deal promoting hydrogen as a key component of the energy mix.
In terms of distribution methods, pipelines are the dominant segment due to their efficiency and capacity to transport large volumes of hydrogen. The application segment of ammonia production remains a stronghold, with a market share of 30% in 2025, driven by the chemical industry's reliance on hydrogen for ammonia synthesis.
Dominance Factors for Pipelines:
Efficiency: Pipelines can transport large volumes of hydrogen over long distances.
Infrastructure: Existing natural gas pipelines can be repurposed for hydrogen transport.
Dominance Factors for Ammonia Production:
Industrial demand: High demand from the chemical industry.
Market share: 30% in 2025, reflecting the segment's importance in the overall market.
The dominance of these regions, countries, and segments is underpinned by a combination of strategic investments, supportive regulatory frameworks, and the inherent advantages of specific distribution and application methods.
Hydrogen Gas Market Product Innovations
Product innovations in the Hydrogen Gas Market are centered around enhancing production efficiency and expanding application areas. Recent advancements include the development of high-efficiency electrolyzers and novel storage solutions like metal hydride storage systems. These innovations not only improve the performance metrics of hydrogen production but also offer unique selling propositions such as lower energy consumption and higher safety standards. Technological advancements in purification technologies, like BASF's Puristar R0-20, are pivotal in ensuring the quality of hydrogen for various applications, including fuel cell vehicles and industrial processes.
Propelling Factors for Hydrogen Gas Market Growth
The Hydrogen Gas Market is experiencing significant growth driven by a confluence of technological advancements, economic shifts, and supportive regulatory frameworks. Technological progress in electrolysis, particularly advancements in membrane technology and catalyst efficiency, is dramatically reducing production costs and improving the overall efficiency of green hydrogen generation. Simultaneously, innovations in hydrogen storage and transportation, including the development of advanced materials and improved pressure vessel designs, are addressing critical logistical challenges. Economically, the plummeting cost of renewable energy sources like solar and wind power makes green hydrogen production increasingly competitive with traditional fossil fuel-based methods. This cost reduction is further fueled by economies of scale as production facilities expand. Furthermore, government incentives and supportive policies, such as tax credits, grants, and investment in infrastructure development, as exemplified by initiatives like the US Inflation Reduction Act and the European Green Deal, are creating a favorable investment climate and accelerating market adoption. These factors are collectively driving the market towards a projected CAGR of 6.5% from 2025 to 2033, although this figure may fluctuate based on global economic conditions and policy changes.
Obstacles in the Hydrogen Gas Market Market
Despite its growth potential, the Hydrogen Gas Market faces several obstacles. Regulatory challenges vary by region, with some areas lacking the necessary frameworks to support hydrogen infrastructure development. Supply chain disruptions, particularly in the wake of global events, can impact the availability of critical components for hydrogen production and distribution. Competitive pressures from alternative energy sources like natural gas and electricity pose a threat to market penetration. These obstacles could potentially limit market growth by up to 2% annually if not addressed.
Future Opportunities in Hydrogen Gas Market
Emerging opportunities in the Hydrogen Gas Market include the development of new markets in Asia-Pacific, driven by increasing industrial demand and government initiatives. Technological advancements in hydrogen fuel cells and storage systems open new avenues for consumer applications, particularly in transportation and energy storage. Shifts in consumer trends towards sustainability are likely to boost demand for green hydrogen, creating a fertile ground for market expansion.
Major Players in the Hydrogen Gas Market Ecosystem
- Equinor ASA
- Air Products and Chemicals Inc
- Universal Industrial Gases Inc *List Not Exhaustive
- PAO NOVATEK
- Gulf Cryo
- Lords Chloro Alkali Limited
- Gujarat Alkalies and Chemicals Limited
- Matheson Tri-Gas Inc
- BASF SE
- Aditya Birla Chemicals
- Linde plc
- TAIYO NIPPON SANSO CORPORATION
- Air Liquide
- Messer SE & Co KGaA
Key Developments in Hydrogen Gas Market Industry
- July 2022: Air Products and VPI's joint development agreement for the 'Humber Hydrogen Hub' (H3) signifies a major step towards establishing large-scale, low-carbon hydrogen production infrastructure in the UK, supporting the nation's decarbonization goals and showcasing the potential for large-scale hydrogen projects. This development highlights the increasing collaboration within the industry to create a robust hydrogen economy.
- June 2022: The collaboration between BASF and Shell to evaluate purification technologies for green hydrogen underscores the critical role of efficient processing in reducing the overall cost and improving the quality of green hydrogen, a key factor for broader market adoption.
- June 2022: Equinor and SSE Thermal's acquisition of Triton Power, including the Saltend Power Station, and its planned transition to hydrogen-based power generation demonstrates the significant potential for hydrogen to play a crucial role in decarbonizing the power sector and replacing fossil fuels in existing infrastructure.
Strategic Hydrogen Gas Market Market Forecast
The strategic forecast for the Hydrogen Gas Market is optimistic, driven by future opportunities and market potential. The market is expected to grow at a CAGR of 6.5% from 2025 to 2033, propelled by increasing investments in hydrogen infrastructure, technological advancements in production and storage, and a growing demand for sustainable energy solutions. Emerging markets in Asia-Pacific and technological breakthroughs in fuel cell applications are key areas of growth, positioning hydrogen as a pivotal player in the global energy transition.
Hydrogen Gas Market Segmentation
-
1. Distribution
- 1.1. Pipelines
- 1.2. High-pressure Tube Trailers
- 1.3. Cylinders
-
2. Application
- 2.1. Ammonia
- 2.2. Methanol
- 2.3. Refining
- 2.4. Direct Reduced Iron (DRI)
- 2.5. Fuel Cell Vehicles (FCV)
- 2.6. Other Ap
Hydrogen Gas Market Segmentation By Geography
-
1. Asia Pacific
- 1.1. China
- 1.2. India
- 1.3. Japan
- 1.4. South Korea
- 1.5. Malaysia
- 1.6. Thailand
- 1.7. Indonesia
- 1.8. Vietnam
- 1.9. Rest of Asia Pacific
-
2. North America
- 2.1. United States
- 2.2. Canada
- 2.3. Mexico
-
3. Europe
- 3.1. Germany
- 3.2. United Kingdom
- 3.3. Italy
- 3.4. France
- 3.5. Spain
- 3.6. NORDIC
- 3.7. Turkey
- 3.8. Russia
- 3.9. Rest of Europe
-
4. South America
- 4.1. Brazil
- 4.2. Argentina
- 4.3. Colombia
- 4.4. Rest of South America
-
5. Middle East and Africa
- 5.1. Saudi Arabia
- 5.2. South Africa
- 5.3. Nigeria
- 5.4. Qatar
- 5.5. Egypt
- 5.6. United Arab Emirates
- 5.7. Rest of Middle East and Africa
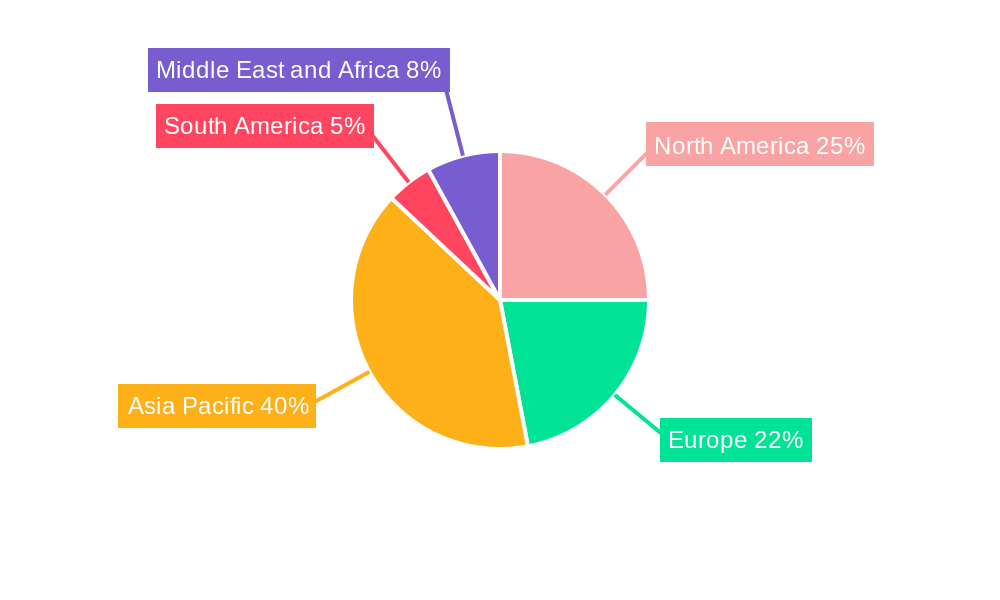
Hydrogen Gas Market Regional Market Share
Geographic Coverage of Hydrogen Gas Market
Hydrogen Gas Market REPORT HIGHLIGHTS
| Aspects | Details |
|---|---|
| Study Period | 2020-2034 |
| Base Year | 2025 |
| Estimated Year | 2026 |
| Forecast Period | 2026-2034 |
| Historical Period | 2020-2025 |
| Growth Rate | CAGR of 8.6% from 2020-2034 |
| Segmentation |
|
Table of Contents
- 1. Introduction
- 1.1. Research Scope
- 1.2. Market Segmentation
- 1.3. Research Objective
- 1.4. Definitions and Assumptions
- 2. Executive Summary
- 2.1. Market Snapshot
- 3. Market Dynamics
- 3.1. Market Drivers
- 3.2. Market Restrains
- 3.3. Market Trends
- 3.4. Market Opportunities
- 4. Market Factor Analysis
- 4.1. Porters Five Forces
- 4.1.1. Bargaining Power of Suppliers
- 4.1.2. Bargaining Power of Buyers
- 4.1.3. Threat of New Entrants
- 4.1.4. Threat of Substitutes
- 4.1.5. Competitive Rivalry
- 4.2. PESTEL analysis
- 4.3. BCG Analysis
- 4.3.1. Stars (High Growth, High Market Share)
- 4.3.2. Cash Cows (Low Growth, High Market Share)
- 4.3.3. Question Mark (High Growth, Low Market Share)
- 4.3.4. Dogs (Low Growth, Low Market Share)
- 4.4. Ansoff Matrix Analysis
- 4.5. Supply Chain Analysis
- 4.6. Regulatory Landscape
- 4.7. Current Market Potential and Opportunity Assessment (TAM–SAM–SOM Framework)
- 4.8. DMV Analyst Note
- 4.1. Porters Five Forces
- 5. Market Analysis, Insights and Forecast 2021-2033
- 5.1. Market Analysis, Insights and Forecast - by Distribution
- 5.1.1. Pipelines
- 5.1.2. High-pressure Tube Trailers
- 5.1.3. Cylinders
- 5.2. Market Analysis, Insights and Forecast - by Application
- 5.2.1. Ammonia
- 5.2.2. Methanol
- 5.2.3. Refining
- 5.2.4. Direct Reduced Iron (DRI)
- 5.2.5. Fuel Cell Vehicles (FCV)
- 5.2.6. Other Ap
- 5.3. Market Analysis, Insights and Forecast - by Region
- 5.3.1. Asia Pacific
- 5.3.2. North America
- 5.3.3. Europe
- 5.3.4. South America
- 5.3.5. Middle East and Africa
- 5.1. Market Analysis, Insights and Forecast - by Distribution
- 6. Global Hydrogen Gas Market Analysis, Insights and Forecast, 2021-2033
- 6.1. Market Analysis, Insights and Forecast - by Distribution
- 6.1.1. Pipelines
- 6.1.2. High-pressure Tube Trailers
- 6.1.3. Cylinders
- 6.2. Market Analysis, Insights and Forecast - by Application
- 6.2.1. Ammonia
- 6.2.2. Methanol
- 6.2.3. Refining
- 6.2.4. Direct Reduced Iron (DRI)
- 6.2.5. Fuel Cell Vehicles (FCV)
- 6.2.6. Other Ap
- 6.1. Market Analysis, Insights and Forecast - by Distribution
- 7. Asia Pacific Hydrogen Gas Market Analysis, Insights and Forecast, 2020-2032
- 7.1. Market Analysis, Insights and Forecast - by Distribution
- 7.1.1. Pipelines
- 7.1.2. High-pressure Tube Trailers
- 7.1.3. Cylinders
- 7.2. Market Analysis, Insights and Forecast - by Application
- 7.2.1. Ammonia
- 7.2.2. Methanol
- 7.2.3. Refining
- 7.2.4. Direct Reduced Iron (DRI)
- 7.2.5. Fuel Cell Vehicles (FCV)
- 7.2.6. Other Ap
- 7.1. Market Analysis, Insights and Forecast - by Distribution
- 8. North America Hydrogen Gas Market Analysis, Insights and Forecast, 2020-2032
- 8.1. Market Analysis, Insights and Forecast - by Distribution
- 8.1.1. Pipelines
- 8.1.2. High-pressure Tube Trailers
- 8.1.3. Cylinders
- 8.2. Market Analysis, Insights and Forecast - by Application
- 8.2.1. Ammonia
- 8.2.2. Methanol
- 8.2.3. Refining
- 8.2.4. Direct Reduced Iron (DRI)
- 8.2.5. Fuel Cell Vehicles (FCV)
- 8.2.6. Other Ap
- 8.1. Market Analysis, Insights and Forecast - by Distribution
- 9. Europe Hydrogen Gas Market Analysis, Insights and Forecast, 2020-2032
- 9.1. Market Analysis, Insights and Forecast - by Distribution
- 9.1.1. Pipelines
- 9.1.2. High-pressure Tube Trailers
- 9.1.3. Cylinders
- 9.2. Market Analysis, Insights and Forecast - by Application
- 9.2.1. Ammonia
- 9.2.2. Methanol
- 9.2.3. Refining
- 9.2.4. Direct Reduced Iron (DRI)
- 9.2.5. Fuel Cell Vehicles (FCV)
- 9.2.6. Other Ap
- 9.1. Market Analysis, Insights and Forecast - by Distribution
- 10. South America Hydrogen Gas Market Analysis, Insights and Forecast, 2020-2032
- 10.1. Market Analysis, Insights and Forecast - by Distribution
- 10.1.1. Pipelines
- 10.1.2. High-pressure Tube Trailers
- 10.1.3. Cylinders
- 10.2. Market Analysis, Insights and Forecast - by Application
- 10.2.1. Ammonia
- 10.2.2. Methanol
- 10.2.3. Refining
- 10.2.4. Direct Reduced Iron (DRI)
- 10.2.5. Fuel Cell Vehicles (FCV)
- 10.2.6. Other Ap
- 10.1. Market Analysis, Insights and Forecast - by Distribution
- 11. Middle East and Africa Hydrogen Gas Market Analysis, Insights and Forecast, 2020-2032
- 11.1. Market Analysis, Insights and Forecast - by Distribution
- 11.1.1. Pipelines
- 11.1.2. High-pressure Tube Trailers
- 11.1.3. Cylinders
- 11.2. Market Analysis, Insights and Forecast - by Application
- 11.2.1. Ammonia
- 11.2.2. Methanol
- 11.2.3. Refining
- 11.2.4. Direct Reduced Iron (DRI)
- 11.2.5. Fuel Cell Vehicles (FCV)
- 11.2.6. Other Ap
- 11.1. Market Analysis, Insights and Forecast - by Distribution
- 12. Competitive Analysis
- 12.1. Company Profiles
- 12.1.1 Equinor ASA
- 12.1.1.1. Company Overview
- 12.1.1.2. Products
- 12.1.1.3. Company Financials
- 12.1.1.4. SWOT Analysis
- 12.1.2 Air Products and Chemicals Inc
- 12.1.2.1. Company Overview
- 12.1.2.2. Products
- 12.1.2.3. Company Financials
- 12.1.2.4. SWOT Analysis
- 12.1.3 Universal Industrial Gases Inc *List Not Exhaustive
- 12.1.3.1. Company Overview
- 12.1.3.2. Products
- 12.1.3.3. Company Financials
- 12.1.3.4. SWOT Analysis
- 12.1.4 PAO NOVATEK
- 12.1.4.1. Company Overview
- 12.1.4.2. Products
- 12.1.4.3. Company Financials
- 12.1.4.4. SWOT Analysis
- 12.1.5 Gulf Cryo
- 12.1.5.1. Company Overview
- 12.1.5.2. Products
- 12.1.5.3. Company Financials
- 12.1.5.4. SWOT Analysis
- 12.1.6 Lords Chloro Alkali Limited
- 12.1.6.1. Company Overview
- 12.1.6.2. Products
- 12.1.6.3. Company Financials
- 12.1.6.4. SWOT Analysis
- 12.1.7 Gujarat Alkalies and Chemicals Limited
- 12.1.7.1. Company Overview
- 12.1.7.2. Products
- 12.1.7.3. Company Financials
- 12.1.7.4. SWOT Analysis
- 12.1.8 Matheson Tri-Gas Inc
- 12.1.8.1. Company Overview
- 12.1.8.2. Products
- 12.1.8.3. Company Financials
- 12.1.8.4. SWOT Analysis
- 12.1.9 BASF SE
- 12.1.9.1. Company Overview
- 12.1.9.2. Products
- 12.1.9.3. Company Financials
- 12.1.9.4. SWOT Analysis
- 12.1.10 Aditya Birla Chemicals
- 12.1.10.1. Company Overview
- 12.1.10.2. Products
- 12.1.10.3. Company Financials
- 12.1.10.4. SWOT Analysis
- 12.1.11 Linde plc
- 12.1.11.1. Company Overview
- 12.1.11.2. Products
- 12.1.11.3. Company Financials
- 12.1.11.4. SWOT Analysis
- 12.1.12 TAIYO NIPPON SANSO CORPORATION
- 12.1.12.1. Company Overview
- 12.1.12.2. Products
- 12.1.12.3. Company Financials
- 12.1.12.4. SWOT Analysis
- 12.1.13 Air Liquide
- 12.1.13.1. Company Overview
- 12.1.13.2. Products
- 12.1.13.3. Company Financials
- 12.1.13.4. SWOT Analysis
- 12.1.14 Messer SE & Co KGaA
- 12.1.14.1. Company Overview
- 12.1.14.2. Products
- 12.1.14.3. Company Financials
- 12.1.14.4. SWOT Analysis
- 12.1.1 Equinor ASA
- 12.2. Market Entropy
- 12.2.1 Company's Key Areas Served
- 12.2.2 Recent Developments
- 12.3. Company Market Share Analysis 2025
- 12.3.1 Top 5 Companies Market Share Analysis
- 12.3.2 Top 3 Companies Market Share Analysis
- 12.4. List of Potential Customers
- 13. Research Methodology
List of Figures
- Figure 1: Global Hydrogen Gas Market Revenue Breakdown (billion, %) by Region 2025 & 2033
- Figure 2: Global Hydrogen Gas Market Volume Breakdown (Million, %) by Region 2025 & 2033
- Figure 3: Asia Pacific Hydrogen Gas Market Revenue (billion), by Distribution 2025 & 2033
- Figure 4: Asia Pacific Hydrogen Gas Market Volume (Million), by Distribution 2025 & 2033
- Figure 5: Asia Pacific Hydrogen Gas Market Revenue Share (%), by Distribution 2025 & 2033
- Figure 6: Asia Pacific Hydrogen Gas Market Volume Share (%), by Distribution 2025 & 2033
- Figure 7: Asia Pacific Hydrogen Gas Market Revenue (billion), by Application 2025 & 2033
- Figure 8: Asia Pacific Hydrogen Gas Market Volume (Million), by Application 2025 & 2033
- Figure 9: Asia Pacific Hydrogen Gas Market Revenue Share (%), by Application 2025 & 2033
- Figure 10: Asia Pacific Hydrogen Gas Market Volume Share (%), by Application 2025 & 2033
- Figure 11: Asia Pacific Hydrogen Gas Market Revenue (billion), by Country 2025 & 2033
- Figure 12: Asia Pacific Hydrogen Gas Market Volume (Million), by Country 2025 & 2033
- Figure 13: Asia Pacific Hydrogen Gas Market Revenue Share (%), by Country 2025 & 2033
- Figure 14: Asia Pacific Hydrogen Gas Market Volume Share (%), by Country 2025 & 2033
- Figure 15: North America Hydrogen Gas Market Revenue (billion), by Distribution 2025 & 2033
- Figure 16: North America Hydrogen Gas Market Volume (Million), by Distribution 2025 & 2033
- Figure 17: North America Hydrogen Gas Market Revenue Share (%), by Distribution 2025 & 2033
- Figure 18: North America Hydrogen Gas Market Volume Share (%), by Distribution 2025 & 2033
- Figure 19: North America Hydrogen Gas Market Revenue (billion), by Application 2025 & 2033
- Figure 20: North America Hydrogen Gas Market Volume (Million), by Application 2025 & 2033
- Figure 21: North America Hydrogen Gas Market Revenue Share (%), by Application 2025 & 2033
- Figure 22: North America Hydrogen Gas Market Volume Share (%), by Application 2025 & 2033
- Figure 23: North America Hydrogen Gas Market Revenue (billion), by Country 2025 & 2033
- Figure 24: North America Hydrogen Gas Market Volume (Million), by Country 2025 & 2033
- Figure 25: North America Hydrogen Gas Market Revenue Share (%), by Country 2025 & 2033
- Figure 26: North America Hydrogen Gas Market Volume Share (%), by Country 2025 & 2033
- Figure 27: Europe Hydrogen Gas Market Revenue (billion), by Distribution 2025 & 2033
- Figure 28: Europe Hydrogen Gas Market Volume (Million), by Distribution 2025 & 2033
- Figure 29: Europe Hydrogen Gas Market Revenue Share (%), by Distribution 2025 & 2033
- Figure 30: Europe Hydrogen Gas Market Volume Share (%), by Distribution 2025 & 2033
- Figure 31: Europe Hydrogen Gas Market Revenue (billion), by Application 2025 & 2033
- Figure 32: Europe Hydrogen Gas Market Volume (Million), by Application 2025 & 2033
- Figure 33: Europe Hydrogen Gas Market Revenue Share (%), by Application 2025 & 2033
- Figure 34: Europe Hydrogen Gas Market Volume Share (%), by Application 2025 & 2033
- Figure 35: Europe Hydrogen Gas Market Revenue (billion), by Country 2025 & 2033
- Figure 36: Europe Hydrogen Gas Market Volume (Million), by Country 2025 & 2033
- Figure 37: Europe Hydrogen Gas Market Revenue Share (%), by Country 2025 & 2033
- Figure 38: Europe Hydrogen Gas Market Volume Share (%), by Country 2025 & 2033
- Figure 39: South America Hydrogen Gas Market Revenue (billion), by Distribution 2025 & 2033
- Figure 40: South America Hydrogen Gas Market Volume (Million), by Distribution 2025 & 2033
- Figure 41: South America Hydrogen Gas Market Revenue Share (%), by Distribution 2025 & 2033
- Figure 42: South America Hydrogen Gas Market Volume Share (%), by Distribution 2025 & 2033
- Figure 43: South America Hydrogen Gas Market Revenue (billion), by Application 2025 & 2033
- Figure 44: South America Hydrogen Gas Market Volume (Million), by Application 2025 & 2033
- Figure 45: South America Hydrogen Gas Market Revenue Share (%), by Application 2025 & 2033
- Figure 46: South America Hydrogen Gas Market Volume Share (%), by Application 2025 & 2033
- Figure 47: South America Hydrogen Gas Market Revenue (billion), by Country 2025 & 2033
- Figure 48: South America Hydrogen Gas Market Volume (Million), by Country 2025 & 2033
- Figure 49: South America Hydrogen Gas Market Revenue Share (%), by Country 2025 & 2033
- Figure 50: South America Hydrogen Gas Market Volume Share (%), by Country 2025 & 2033
- Figure 51: Middle East and Africa Hydrogen Gas Market Revenue (billion), by Distribution 2025 & 2033
- Figure 52: Middle East and Africa Hydrogen Gas Market Volume (Million), by Distribution 2025 & 2033
- Figure 53: Middle East and Africa Hydrogen Gas Market Revenue Share (%), by Distribution 2025 & 2033
- Figure 54: Middle East and Africa Hydrogen Gas Market Volume Share (%), by Distribution 2025 & 2033
- Figure 55: Middle East and Africa Hydrogen Gas Market Revenue (billion), by Application 2025 & 2033
- Figure 56: Middle East and Africa Hydrogen Gas Market Volume (Million), by Application 2025 & 2033
- Figure 57: Middle East and Africa Hydrogen Gas Market Revenue Share (%), by Application 2025 & 2033
- Figure 58: Middle East and Africa Hydrogen Gas Market Volume Share (%), by Application 2025 & 2033
- Figure 59: Middle East and Africa Hydrogen Gas Market Revenue (billion), by Country 2025 & 2033
- Figure 60: Middle East and Africa Hydrogen Gas Market Volume (Million), by Country 2025 & 2033
- Figure 61: Middle East and Africa Hydrogen Gas Market Revenue Share (%), by Country 2025 & 2033
- Figure 62: Middle East and Africa Hydrogen Gas Market Volume Share (%), by Country 2025 & 2033
List of Tables
- Table 1: Global Hydrogen Gas Market Revenue billion Forecast, by Distribution 2020 & 2033
- Table 2: Global Hydrogen Gas Market Volume Million Forecast, by Distribution 2020 & 2033
- Table 3: Global Hydrogen Gas Market Revenue billion Forecast, by Application 2020 & 2033
- Table 4: Global Hydrogen Gas Market Volume Million Forecast, by Application 2020 & 2033
- Table 5: Global Hydrogen Gas Market Revenue billion Forecast, by Region 2020 & 2033
- Table 6: Global Hydrogen Gas Market Volume Million Forecast, by Region 2020 & 2033
- Table 7: Global Hydrogen Gas Market Revenue billion Forecast, by Distribution 2020 & 2033
- Table 8: Global Hydrogen Gas Market Volume Million Forecast, by Distribution 2020 & 2033
- Table 9: Global Hydrogen Gas Market Revenue billion Forecast, by Application 2020 & 2033
- Table 10: Global Hydrogen Gas Market Volume Million Forecast, by Application 2020 & 2033
- Table 11: Global Hydrogen Gas Market Revenue billion Forecast, by Country 2020 & 2033
- Table 12: Global Hydrogen Gas Market Volume Million Forecast, by Country 2020 & 2033
- Table 13: China Hydrogen Gas Market Revenue (billion) Forecast, by Application 2020 & 2033
- Table 14: China Hydrogen Gas Market Volume (Million) Forecast, by Application 2020 & 2033
- Table 15: India Hydrogen Gas Market Revenue (billion) Forecast, by Application 2020 & 2033
- Table 16: India Hydrogen Gas Market Volume (Million) Forecast, by Application 2020 & 2033
- Table 17: Japan Hydrogen Gas Market Revenue (billion) Forecast, by Application 2020 & 2033
- Table 18: Japan Hydrogen Gas Market Volume (Million) Forecast, by Application 2020 & 2033
- Table 19: South Korea Hydrogen Gas Market Revenue (billion) Forecast, by Application 2020 & 2033
- Table 20: South Korea Hydrogen Gas Market Volume (Million) Forecast, by Application 2020 & 2033
- Table 21: Malaysia Hydrogen Gas Market Revenue (billion) Forecast, by Application 2020 & 2033
- Table 22: Malaysia Hydrogen Gas Market Volume (Million) Forecast, by Application 2020 & 2033
- Table 23: Thailand Hydrogen Gas Market Revenue (billion) Forecast, by Application 2020 & 2033
- Table 24: Thailand Hydrogen Gas Market Volume (Million) Forecast, by Application 2020 & 2033
- Table 25: Indonesia Hydrogen Gas Market Revenue (billion) Forecast, by Application 2020 & 2033
- Table 26: Indonesia Hydrogen Gas Market Volume (Million) Forecast, by Application 2020 & 2033
- Table 27: Vietnam Hydrogen Gas Market Revenue (billion) Forecast, by Application 2020 & 2033
- Table 28: Vietnam Hydrogen Gas Market Volume (Million) Forecast, by Application 2020 & 2033
- Table 29: Rest of Asia Pacific Hydrogen Gas Market Revenue (billion) Forecast, by Application 2020 & 2033
- Table 30: Rest of Asia Pacific Hydrogen Gas Market Volume (Million) Forecast, by Application 2020 & 2033
- Table 31: Global Hydrogen Gas Market Revenue billion Forecast, by Distribution 2020 & 2033
- Table 32: Global Hydrogen Gas Market Volume Million Forecast, by Distribution 2020 & 2033
- Table 33: Global Hydrogen Gas Market Revenue billion Forecast, by Application 2020 & 2033
- Table 34: Global Hydrogen Gas Market Volume Million Forecast, by Application 2020 & 2033
- Table 35: Global Hydrogen Gas Market Revenue billion Forecast, by Country 2020 & 2033
- Table 36: Global Hydrogen Gas Market Volume Million Forecast, by Country 2020 & 2033
- Table 37: United States Hydrogen Gas Market Revenue (billion) Forecast, by Application 2020 & 2033
- Table 38: United States Hydrogen Gas Market Volume (Million) Forecast, by Application 2020 & 2033
- Table 39: Canada Hydrogen Gas Market Revenue (billion) Forecast, by Application 2020 & 2033
- Table 40: Canada Hydrogen Gas Market Volume (Million) Forecast, by Application 2020 & 2033
- Table 41: Mexico Hydrogen Gas Market Revenue (billion) Forecast, by Application 2020 & 2033
- Table 42: Mexico Hydrogen Gas Market Volume (Million) Forecast, by Application 2020 & 2033
- Table 43: Global Hydrogen Gas Market Revenue billion Forecast, by Distribution 2020 & 2033
- Table 44: Global Hydrogen Gas Market Volume Million Forecast, by Distribution 2020 & 2033
- Table 45: Global Hydrogen Gas Market Revenue billion Forecast, by Application 2020 & 2033
- Table 46: Global Hydrogen Gas Market Volume Million Forecast, by Application 2020 & 2033
- Table 47: Global Hydrogen Gas Market Revenue billion Forecast, by Country 2020 & 2033
- Table 48: Global Hydrogen Gas Market Volume Million Forecast, by Country 2020 & 2033
- Table 49: Germany Hydrogen Gas Market Revenue (billion) Forecast, by Application 2020 & 2033
- Table 50: Germany Hydrogen Gas Market Volume (Million) Forecast, by Application 2020 & 2033
- Table 51: United Kingdom Hydrogen Gas Market Revenue (billion) Forecast, by Application 2020 & 2033
- Table 52: United Kingdom Hydrogen Gas Market Volume (Million) Forecast, by Application 2020 & 2033
- Table 53: Italy Hydrogen Gas Market Revenue (billion) Forecast, by Application 2020 & 2033
- Table 54: Italy Hydrogen Gas Market Volume (Million) Forecast, by Application 2020 & 2033
- Table 55: France Hydrogen Gas Market Revenue (billion) Forecast, by Application 2020 & 2033
- Table 56: France Hydrogen Gas Market Volume (Million) Forecast, by Application 2020 & 2033
- Table 57: Spain Hydrogen Gas Market Revenue (billion) Forecast, by Application 2020 & 2033
- Table 58: Spain Hydrogen Gas Market Volume (Million) Forecast, by Application 2020 & 2033
- Table 59: NORDIC Hydrogen Gas Market Revenue (billion) Forecast, by Application 2020 & 2033
- Table 60: NORDIC Hydrogen Gas Market Volume (Million) Forecast, by Application 2020 & 2033
- Table 61: Turkey Hydrogen Gas Market Revenue (billion) Forecast, by Application 2020 & 2033
- Table 62: Turkey Hydrogen Gas Market Volume (Million) Forecast, by Application 2020 & 2033
- Table 63: Russia Hydrogen Gas Market Revenue (billion) Forecast, by Application 2020 & 2033
- Table 64: Russia Hydrogen Gas Market Volume (Million) Forecast, by Application 2020 & 2033
- Table 65: Rest of Europe Hydrogen Gas Market Revenue (billion) Forecast, by Application 2020 & 2033
- Table 66: Rest of Europe Hydrogen Gas Market Volume (Million) Forecast, by Application 2020 & 2033
- Table 67: Global Hydrogen Gas Market Revenue billion Forecast, by Distribution 2020 & 2033
- Table 68: Global Hydrogen Gas Market Volume Million Forecast, by Distribution 2020 & 2033
- Table 69: Global Hydrogen Gas Market Revenue billion Forecast, by Application 2020 & 2033
- Table 70: Global Hydrogen Gas Market Volume Million Forecast, by Application 2020 & 2033
- Table 71: Global Hydrogen Gas Market Revenue billion Forecast, by Country 2020 & 2033
- Table 72: Global Hydrogen Gas Market Volume Million Forecast, by Country 2020 & 2033
- Table 73: Brazil Hydrogen Gas Market Revenue (billion) Forecast, by Application 2020 & 2033
- Table 74: Brazil Hydrogen Gas Market Volume (Million) Forecast, by Application 2020 & 2033
- Table 75: Argentina Hydrogen Gas Market Revenue (billion) Forecast, by Application 2020 & 2033
- Table 76: Argentina Hydrogen Gas Market Volume (Million) Forecast, by Application 2020 & 2033
- Table 77: Colombia Hydrogen Gas Market Revenue (billion) Forecast, by Application 2020 & 2033
- Table 78: Colombia Hydrogen Gas Market Volume (Million) Forecast, by Application 2020 & 2033
- Table 79: Rest of South America Hydrogen Gas Market Revenue (billion) Forecast, by Application 2020 & 2033
- Table 80: Rest of South America Hydrogen Gas Market Volume (Million) Forecast, by Application 2020 & 2033
- Table 81: Global Hydrogen Gas Market Revenue billion Forecast, by Distribution 2020 & 2033
- Table 82: Global Hydrogen Gas Market Volume Million Forecast, by Distribution 2020 & 2033
- Table 83: Global Hydrogen Gas Market Revenue billion Forecast, by Application 2020 & 2033
- Table 84: Global Hydrogen Gas Market Volume Million Forecast, by Application 2020 & 2033
- Table 85: Global Hydrogen Gas Market Revenue billion Forecast, by Country 2020 & 2033
- Table 86: Global Hydrogen Gas Market Volume Million Forecast, by Country 2020 & 2033
- Table 87: Saudi Arabia Hydrogen Gas Market Revenue (billion) Forecast, by Application 2020 & 2033
- Table 88: Saudi Arabia Hydrogen Gas Market Volume (Million) Forecast, by Application 2020 & 2033
- Table 89: South Africa Hydrogen Gas Market Revenue (billion) Forecast, by Application 2020 & 2033
- Table 90: South Africa Hydrogen Gas Market Volume (Million) Forecast, by Application 2020 & 2033
- Table 91: Nigeria Hydrogen Gas Market Revenue (billion) Forecast, by Application 2020 & 2033
- Table 92: Nigeria Hydrogen Gas Market Volume (Million) Forecast, by Application 2020 & 2033
- Table 93: Qatar Hydrogen Gas Market Revenue (billion) Forecast, by Application 2020 & 2033
- Table 94: Qatar Hydrogen Gas Market Volume (Million) Forecast, by Application 2020 & 2033
- Table 95: Egypt Hydrogen Gas Market Revenue (billion) Forecast, by Application 2020 & 2033
- Table 96: Egypt Hydrogen Gas Market Volume (Million) Forecast, by Application 2020 & 2033
- Table 97: United Arab Emirates Hydrogen Gas Market Revenue (billion) Forecast, by Application 2020 & 2033
- Table 98: United Arab Emirates Hydrogen Gas Market Volume (Million) Forecast, by Application 2020 & 2033
- Table 99: Rest of Middle East and Africa Hydrogen Gas Market Revenue (billion) Forecast, by Application 2020 & 2033
- Table 100: Rest of Middle East and Africa Hydrogen Gas Market Volume (Million) Forecast, by Application 2020 & 2033
Frequently Asked Questions
1. What is the projected Compound Annual Growth Rate (CAGR) of the Hydrogen Gas Market?
The projected CAGR is approximately 8.6%.
2. Which companies are prominent players in the Hydrogen Gas Market?
Key companies in the market include Equinor ASA, Air Products and Chemicals Inc, Universal Industrial Gases Inc *List Not Exhaustive, PAO NOVATEK, Gulf Cryo, Lords Chloro Alkali Limited, Gujarat Alkalies and Chemicals Limited, Matheson Tri-Gas Inc, BASF SE, Aditya Birla Chemicals, Linde plc, TAIYO NIPPON SANSO CORPORATION, Air Liquide, Messer SE & Co KGaA.
3. What are the main segments of the Hydrogen Gas Market?
The market segments include Distribution, Application.
4. Can you provide details about the market size?
The market size is estimated to be USD 204.86 billion as of 2022.
5. What are some drivers contributing to market growth?
Increasing Demand From Chemical Industry; Expanding Usage Of Hydrogen In Refinery.
6. What are the notable trends driving market growth?
Ammonia Production to Dominate the Market Demand.
7. Are there any restraints impacting market growth?
High Production Cost Of Blue And Green Hydrogen; High Transportation And Storage Cost.
8. Can you provide examples of recent developments in the market?
July 2022: Air Products and VPI (a power generator company) signed a joint development agreement for driving the 'Humber Hydrogen Hub' or 'H3', which seeks to develop an 800 MW low-carbon hydrogen production facility in Immingham, United Kingdom.
9. What pricing options are available for accessing the report?
Pricing options include single-user, multi-user, and enterprise licenses priced at USD 4750, USD 5250, and USD 8750 respectively.
10. Is the market size provided in terms of value or volume?
The market size is provided in terms of value, measured in billion and volume, measured in Million.
11. Are there any specific market keywords associated with the report?
Yes, the market keyword associated with the report is "Hydrogen Gas Market," which aids in identifying and referencing the specific market segment covered.
12. How do I determine which pricing option suits my needs best?
The pricing options vary based on user requirements and access needs. Individual users may opt for single-user licenses, while businesses requiring broader access may choose multi-user or enterprise licenses for cost-effective access to the report.
13. Are there any additional resources or data provided in the Hydrogen Gas Market report?
While the report offers comprehensive insights, it's advisable to review the specific contents or supplementary materials provided to ascertain if additional resources or data are available.
14. How can I stay updated on further developments or reports in the Hydrogen Gas Market?
To stay informed about further developments, trends, and reports in the Hydrogen Gas Market, consider subscribing to industry newsletters, following relevant companies and organizations, or regularly checking reputable industry news sources and publications.
Methodology
Step 1 - Identification of Relevant Samples Size from Population Database


Step 2 - Approaches for Defining Global Market Size (Value, Volume* & Price*)

Note*: In applicable scenarios
Step 3 - Data Sources
Primary Research
- Web Analytics
- Survey Reports
- Research Institute
- Latest Research Reports
- Opinion Leaders
Secondary Research
- Annual Reports
- White Paper
- Latest Press Release
- Industry Association
- Paid Database
- Investor Presentations

Step 4 - Data Triangulation
Involves using different sources of information in order to increase the validity of a study
These sources are likely to be stakeholders in a program - participants, other researchers, program staff, other community members, and so on.
Then we put all data in single framework & apply various statistical tools to find out the dynamic on the market.
During the analysis stage, feedback from the stakeholder groups would be compared to determine areas of agreement as well as areas of divergence