

Key Insights
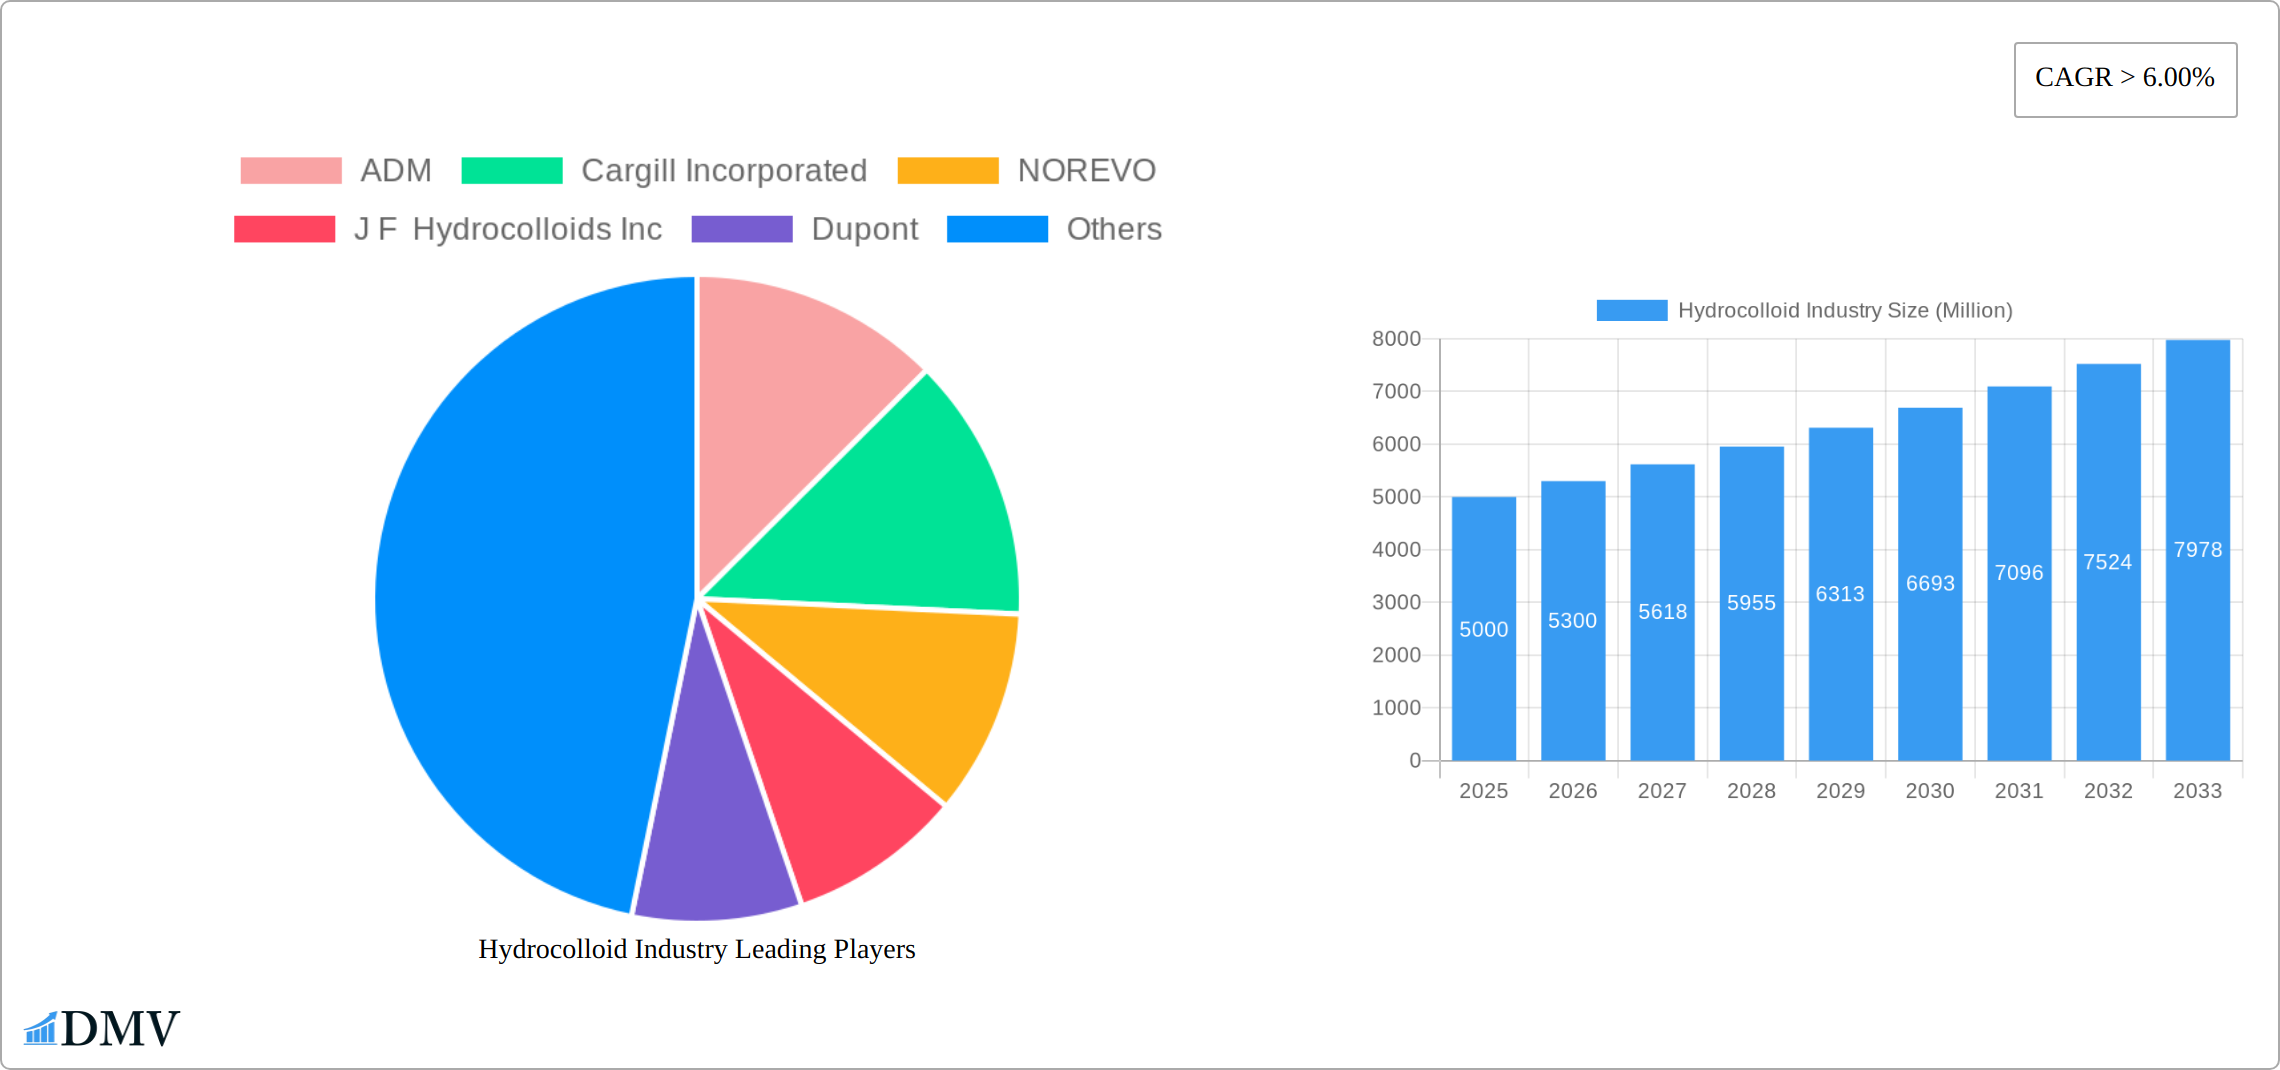
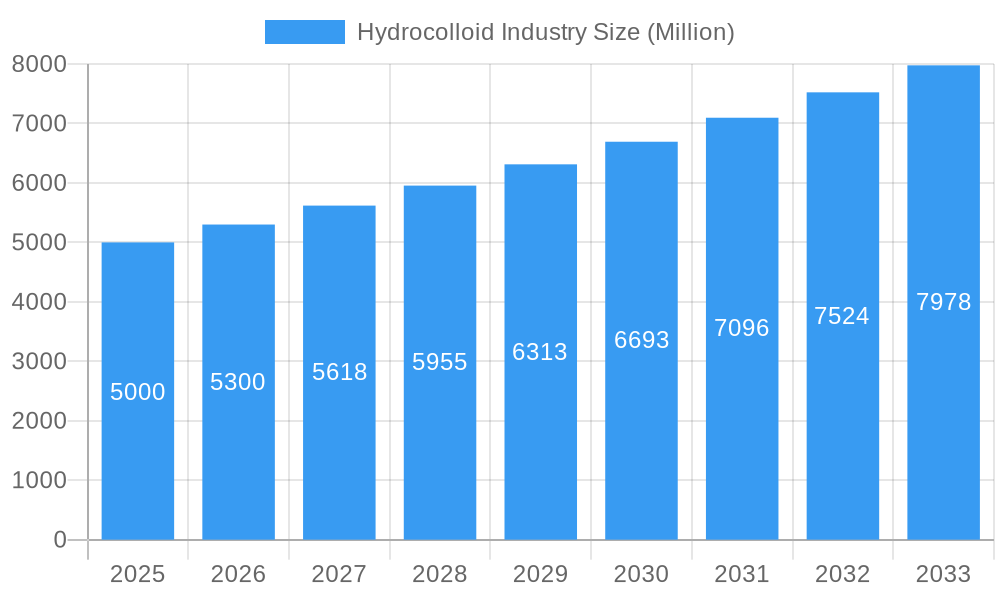
The global hydrocolloid market, valued at approximately $XX million in 2025, is projected to experience robust growth, exhibiting a Compound Annual Growth Rate (CAGR) exceeding 6.00% from 2025 to 2033. This expansion is fueled by several key drivers. The rising demand for convenient and processed foods across various applications, including bakery and confectionery, meat and poultry products, beverages, and dairy, significantly contributes to the market's growth trajectory. Consumer preference for natural and clean-label ingredients is also driving demand for naturally sourced hydrocolloids, such as pectin and carrageenan. Furthermore, the increasing adoption of hydrocolloids as functional ingredients, offering properties like thickening, stabilization, and fat replacement, further fuels market expansion. Innovation in hydrocolloid technology, leading to enhanced functionalities and improved performance, is another factor driving growth. The market is segmented by application, source (natural and synthetic), type (gelatin, carrageenan, pectin, xanthan gum, guar gum, and others), and function (thickener, stabilizer, coating agent, fat replacer, and gelling agent). Leading players like ADM, Cargill, and Ingredion are significantly contributing to market growth through product innovation, strategic partnerships, and expansions.
Hydrocolloid Industry Market Size (In Billion)
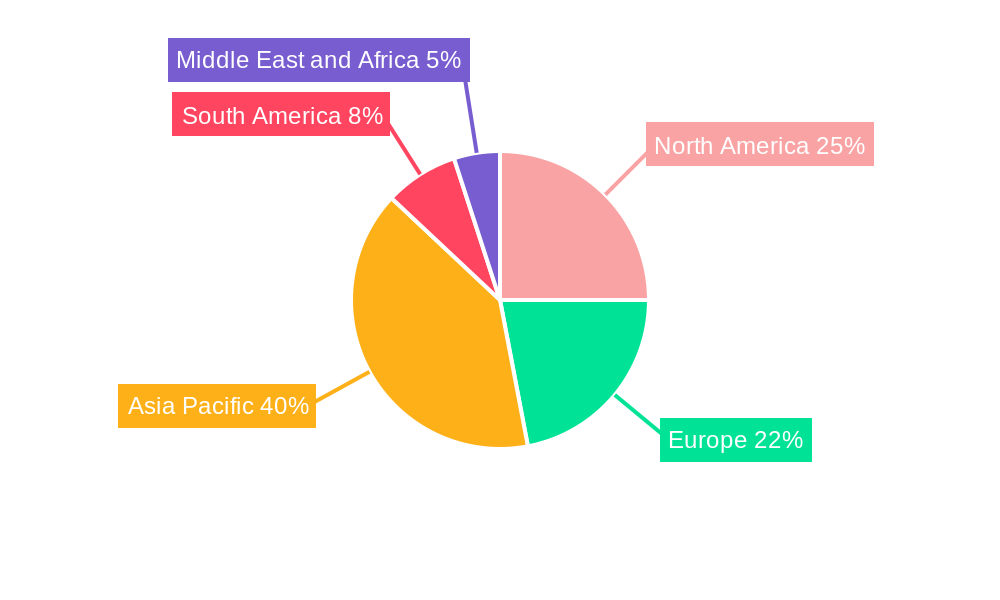
Geographical analysis reveals a diverse market landscape. The Asia-Pacific region, particularly China and India, is anticipated to dominate the market due to rapid economic growth, increasing population, and rising demand for processed foods. North America and Europe are also substantial markets, driven by high consumer disposable incomes and preference for convenient and functional foods. However, price fluctuations in raw materials and regulatory hurdles related to the use of certain hydrocolloids pose challenges to market growth. Despite these restraints, the overall outlook for the hydrocolloid market remains positive, driven by strong demand, technological advancements, and expanding application areas. The market's future depends on several factors, including sustained consumer demand for functional foods, continued technological advancements in hydrocolloid production, and strategic initiatives by industry players to cater to evolving market needs.
Hydrocolloid Industry Company Market Share
Hydrocolloid Industry Market Report: 2019-2033
This comprehensive report provides an in-depth analysis of the global hydrocolloid industry, projecting a market value of $XX Billion by 2033. The study covers the historical period (2019-2024), base year (2025), and forecast period (2025-2033), offering valuable insights for stakeholders across the value chain. This report meticulously analyzes market trends, competitive dynamics, and future growth opportunities, providing actionable intelligence for informed decision-making.
Hydrocolloid Industry Market Composition & Trends
The global hydrocolloid market, valued at $XX Billion in 2025, is characterized by a moderately concentrated landscape with key players such as ADM, Cargill Incorporated, and Ingredion Incorporated holding significant market share. Innovation in hydrocolloid technology, driven by consumer demand for clean-label products and functional foods, is a major catalyst for growth. The regulatory environment, particularly concerning food safety and labeling regulations, plays a crucial role in shaping market dynamics. Substitute products, such as synthetic polymers, present competitive challenges, while the increasing prevalence of plant-based and clean label products fuels demand for natural hydrocolloids. The industry has witnessed significant M&A activity in recent years, with deal values reaching $XX Billion in the last five years, driven by strategic expansion and technological synergies.
- Market Share Distribution (2025): ADM (XX%), Cargill Incorporated (XX%), Ingredion Incorporated (XX%), Others (XX%). (Note: Exact figures are proprietary to the full report.)
- M&A Deal Value (2019-2024): $XX Billion
- Key End-User Segments: Food & Beverage, Pharmaceuticals, Cosmetics.
Hydrocolloid Industry Industry Evolution
The hydrocolloid market has experienced robust growth over the past decade, driven by rising consumer demand for healthier, more convenient foods and beverages. Technological advancements, particularly in extraction and modification techniques, have enhanced the functionality and versatility of hydrocolloids, expanding their application across diverse industries. The shift towards clean-label products and natural ingredients has spurred the demand for natural hydrocolloids like pectin and carrageenan, impacting market segmentation. From 2019 to 2024, the market witnessed a Compound Annual Growth Rate (CAGR) of XX%, and this trajectory is expected to continue, with a projected CAGR of XX% from 2025 to 2033. The increasing adoption of hydrocolloids as stabilizers and thickeners in processed foods and beverages is a key driver, as is their use as fat replacers in health-conscious products.
Leading Regions, Countries, or Segments in Hydrocolloid Industry
The North American region currently dominates the global hydrocolloid market, driven by significant demand from the food and beverage industry and the presence of major hydrocolloid manufacturers. Within applications, the Bakery and Confectionary sector is a major consumer, followed by Beverages and Dairy Products. Natural sources of hydrocolloids are preferred by consumers increasingly focusing on clean label products, leading to robust growth in that segment. Gelatin, Carrageenan, and Pectin remain the dominant hydrocolloid types.
- Key Drivers (North America): Strong food processing industry, established supply chains, regulatory support for innovative food ingredients.
- Key Drivers (Bakery & Confectionary): Increasing demand for texture modification and improved shelf life of products.
- Key Drivers (Natural Sources): Growing consumer preference for natural and clean-label ingredients.
Hydrocolloid Industry Product Innovations
Recent breakthroughs in the hydrocolloid industry center on developing innovative hydrocolloids with superior functionalities. These include improved gelling properties, enhanced thermal stability, and advanced texture modification capabilities, directly addressing the rising demand for customized textural and functional attributes in diverse food and beverage applications. Companies are actively engaged in developing tailored hydrocolloid blends to optimize product performance and meet specific consumer needs. This includes the development of sustainable and ethically sourced hydrocolloids, responding to growing consumer concerns about environmental impact.
Propelling Factors for Hydrocolloid Industry Growth
The hydrocolloid industry's growth is driven by several factors: the rising demand for processed foods and beverages, technological advancements resulting in improved product performance, and increasing consumer preference for natural and clean-label ingredients. Government regulations promoting food safety and labeling transparency also stimulate market expansion. Furthermore, the growing health and wellness consciousness fuels demand for hydrocolloids as fat replacers and texturizers in low-calorie and functional foods.
Obstacles in the Hydrocolloid Industry Market
Despite its growth, the hydrocolloid industry faces significant challenges. These include volatile raw material prices, supply chain disruptions affecting both sourcing and distribution, and fierce competition amongst established and emerging market players. Strict regulatory requirements concerning food safety and labeling add further complexity, coupled with increasing consumer scrutiny regarding the sustainability and environmental impact of certain hydrocolloid sources. Addressing these challenges requires innovative sourcing strategies, robust supply chain management, and a commitment to transparent and sustainable practices.
Future Opportunities in Hydrocolloid Industry
Future opportunities lie in the development of novel hydrocolloids with enhanced functionalities and the expansion into new and emerging markets. The growing demand for plant-based and vegan products presents an attractive opportunity for hydrocolloid manufacturers, as does the increased use of hydrocolloids in emerging applications, such as pharmaceuticals and personal care products.
Major Players in the Hydrocolloid Industry Ecosystem
- ADM
- Cargill Incorporated
- NOREVO
- J F Hydrocolloids Inc
- Dupont
- Ashland
- DSM
- AGARMEX SA DE CV
- Ingredion Incorporated
- B Braun Melsungen AG
- Tate & Lyle
- CP Kelco U S Inc
Key Developments in Hydrocolloid Industry Industry
- September 2021: Ingredion signed a new strategic distribution agreement with Batory Foods, expanding its reach in the US.
- February 2021: IFF completed its merger with DuPont's Nutrition & Biosciences business.
- September 2020: W Hydrocolloids Inc. acquired Cargill's stake in Philippine Bio-Industries Inc.
Strategic Hydrocolloid Industry Market Forecast
The hydrocolloid market is poised for substantial growth in the years to come, driven by the aforementioned factors. The growing emphasis on natural, clean-label ingredients, combined with the ongoing development of innovative hydrocolloid solutions, will continue to fuel market expansion. Emerging applications, particularly in sectors beyond food and beverage, and increased regional market penetration will create significant opportunities for growth. These factors collectively make the hydrocolloid industry a highly attractive prospect for investors and industry participants. Further research into sustainable sourcing and production methods will be key to long-term market success.
Hydrocolloid Industry Segmentation
-
1. Source
- 1.1. Natural
- 1.2. Synthetic
-
2. Type
- 2.1. Gelatin
- 2.2. Carrageenan
- 2.3. Pectin
- 2.4. Xanthum Gum
- 2.5. Guar Gum
- 2.6. Other Types
-
3. Function
- 3.1. Thickener
- 3.2. Stablizer
- 3.3. Coating Agent
- 3.4. Fat Replacer
- 3.5. Gelling Agent
-
4. Application
- 4.1. Bakery and Confectionary
- 4.2. Meat and Poultry Products
- 4.3. Beverages
- 4.4. Sauces and Dressings
- 4.5. Dairy Products
- 4.6. Other Applications
Hydrocolloid Industry Segmentation By Geography
-
1. Asia Pacific
- 1.1. China
- 1.2. India
- 1.3. Japan
- 1.4. South Korea
- 1.5. Rest of Asia Pacific
-
2. North America
- 2.1. United States
- 2.2. Canada
- 2.3. Mexico
-
3. Europe
- 3.1. Germany
- 3.2. United Kingdom
- 3.3. Italy
- 3.4. France
- 3.5. Rest of Europe
-
4. South America
- 4.1. Brazil
- 4.2. Argentina
- 4.3. Rest of South America
-
5. Middle East and Africa
- 5.1. Saudi Arabia
- 5.2. South Africa
- 5.3. Rest of Middle East and Africa
Hydrocolloid Industry Regional Market Share
Geographic Coverage of Hydrocolloid Industry
Hydrocolloid Industry REPORT HIGHLIGHTS
| Aspects | Details |
|---|---|
| Study Period | 2020-2034 |
| Base Year | 2025 |
| Estimated Year | 2026 |
| Forecast Period | 2026-2034 |
| Historical Period | 2020-2025 |
| Growth Rate | CAGR of 5% from 2020-2034 |
| Segmentation |
|
Table of Contents
- 1. Introduction
- 1.1. Research Scope
- 1.2. Market Segmentation
- 1.3. Research Objective
- 1.4. Definitions and Assumptions
- 2. Executive Summary
- 2.1. Market Snapshot
- 3. Market Dynamics
- 3.1. Market Drivers
- 3.2. Market Restrains
- 3.3. Market Trends
- 3.4. Market Opportunities
- 4. Market Factor Analysis
- 4.1. Porters Five Forces
- 4.1.1. Bargaining Power of Suppliers
- 4.1.2. Bargaining Power of Buyers
- 4.1.3. Threat of New Entrants
- 4.1.4. Threat of Substitutes
- 4.1.5. Competitive Rivalry
- 4.2. PESTEL analysis
- 4.3. BCG Analysis
- 4.3.1. Stars (High Growth, High Market Share)
- 4.3.2. Cash Cows (Low Growth, High Market Share)
- 4.3.3. Question Mark (High Growth, Low Market Share)
- 4.3.4. Dogs (Low Growth, Low Market Share)
- 4.4. Ansoff Matrix Analysis
- 4.5. Supply Chain Analysis
- 4.6. Regulatory Landscape
- 4.7. Current Market Potential and Opportunity Assessment (TAM–SAM–SOM Framework)
- 4.8. DMV Analyst Note
- 4.1. Porters Five Forces
- 5. Market Analysis, Insights and Forecast 2021-2033
- 5.1. Market Analysis, Insights and Forecast - by Source
- 5.1.1. Natural
- 5.1.2. Synthetic
- 5.2. Market Analysis, Insights and Forecast - by Type
- 5.2.1. Gelatin
- 5.2.2. Carrageenan
- 5.2.3. Pectin
- 5.2.4. Xanthum Gum
- 5.2.5. Guar Gum
- 5.2.6. Other Types
- 5.3. Market Analysis, Insights and Forecast - by Function
- 5.3.1. Thickener
- 5.3.2. Stablizer
- 5.3.3. Coating Agent
- 5.3.4. Fat Replacer
- 5.3.5. Gelling Agent
- 5.4. Market Analysis, Insights and Forecast - by Application
- 5.4.1. Bakery and Confectionary
- 5.4.2. Meat and Poultry Products
- 5.4.3. Beverages
- 5.4.4. Sauces and Dressings
- 5.4.5. Dairy Products
- 5.4.6. Other Applications
- 5.5. Market Analysis, Insights and Forecast - by Region
- 5.5.1. Asia Pacific
- 5.5.2. North America
- 5.5.3. Europe
- 5.5.4. South America
- 5.5.5. Middle East and Africa
- 5.1. Market Analysis, Insights and Forecast - by Source
- 6. Global Hydrocolloid Industry Analysis, Insights and Forecast, 2021-2033
- 6.1. Market Analysis, Insights and Forecast - by Source
- 6.1.1. Natural
- 6.1.2. Synthetic
- 6.2. Market Analysis, Insights and Forecast - by Type
- 6.2.1. Gelatin
- 6.2.2. Carrageenan
- 6.2.3. Pectin
- 6.2.4. Xanthum Gum
- 6.2.5. Guar Gum
- 6.2.6. Other Types
- 6.3. Market Analysis, Insights and Forecast - by Function
- 6.3.1. Thickener
- 6.3.2. Stablizer
- 6.3.3. Coating Agent
- 6.3.4. Fat Replacer
- 6.3.5. Gelling Agent
- 6.4. Market Analysis, Insights and Forecast - by Application
- 6.4.1. Bakery and Confectionary
- 6.4.2. Meat and Poultry Products
- 6.4.3. Beverages
- 6.4.4. Sauces and Dressings
- 6.4.5. Dairy Products
- 6.4.6. Other Applications
- 6.1. Market Analysis, Insights and Forecast - by Source
- 7. Asia Pacific Hydrocolloid Industry Analysis, Insights and Forecast, 2020-2032
- 7.1. Market Analysis, Insights and Forecast - by Source
- 7.1.1. Natural
- 7.1.2. Synthetic
- 7.2. Market Analysis, Insights and Forecast - by Type
- 7.2.1. Gelatin
- 7.2.2. Carrageenan
- 7.2.3. Pectin
- 7.2.4. Xanthum Gum
- 7.2.5. Guar Gum
- 7.2.6. Other Types
- 7.3. Market Analysis, Insights and Forecast - by Function
- 7.3.1. Thickener
- 7.3.2. Stablizer
- 7.3.3. Coating Agent
- 7.3.4. Fat Replacer
- 7.3.5. Gelling Agent
- 7.4. Market Analysis, Insights and Forecast - by Application
- 7.4.1. Bakery and Confectionary
- 7.4.2. Meat and Poultry Products
- 7.4.3. Beverages
- 7.4.4. Sauces and Dressings
- 7.4.5. Dairy Products
- 7.4.6. Other Applications
- 7.1. Market Analysis, Insights and Forecast - by Source
- 8. North America Hydrocolloid Industry Analysis, Insights and Forecast, 2020-2032
- 8.1. Market Analysis, Insights and Forecast - by Source
- 8.1.1. Natural
- 8.1.2. Synthetic
- 8.2. Market Analysis, Insights and Forecast - by Type
- 8.2.1. Gelatin
- 8.2.2. Carrageenan
- 8.2.3. Pectin
- 8.2.4. Xanthum Gum
- 8.2.5. Guar Gum
- 8.2.6. Other Types
- 8.3. Market Analysis, Insights and Forecast - by Function
- 8.3.1. Thickener
- 8.3.2. Stablizer
- 8.3.3. Coating Agent
- 8.3.4. Fat Replacer
- 8.3.5. Gelling Agent
- 8.4. Market Analysis, Insights and Forecast - by Application
- 8.4.1. Bakery and Confectionary
- 8.4.2. Meat and Poultry Products
- 8.4.3. Beverages
- 8.4.4. Sauces and Dressings
- 8.4.5. Dairy Products
- 8.4.6. Other Applications
- 8.1. Market Analysis, Insights and Forecast - by Source
- 9. Europe Hydrocolloid Industry Analysis, Insights and Forecast, 2020-2032
- 9.1. Market Analysis, Insights and Forecast - by Source
- 9.1.1. Natural
- 9.1.2. Synthetic
- 9.2. Market Analysis, Insights and Forecast - by Type
- 9.2.1. Gelatin
- 9.2.2. Carrageenan
- 9.2.3. Pectin
- 9.2.4. Xanthum Gum
- 9.2.5. Guar Gum
- 9.2.6. Other Types
- 9.3. Market Analysis, Insights and Forecast - by Function
- 9.3.1. Thickener
- 9.3.2. Stablizer
- 9.3.3. Coating Agent
- 9.3.4. Fat Replacer
- 9.3.5. Gelling Agent
- 9.4. Market Analysis, Insights and Forecast - by Application
- 9.4.1. Bakery and Confectionary
- 9.4.2. Meat and Poultry Products
- 9.4.3. Beverages
- 9.4.4. Sauces and Dressings
- 9.4.5. Dairy Products
- 9.4.6. Other Applications
- 9.1. Market Analysis, Insights and Forecast - by Source
- 10. South America Hydrocolloid Industry Analysis, Insights and Forecast, 2020-2032
- 10.1. Market Analysis, Insights and Forecast - by Source
- 10.1.1. Natural
- 10.1.2. Synthetic
- 10.2. Market Analysis, Insights and Forecast - by Type
- 10.2.1. Gelatin
- 10.2.2. Carrageenan
- 10.2.3. Pectin
- 10.2.4. Xanthum Gum
- 10.2.5. Guar Gum
- 10.2.6. Other Types
- 10.3. Market Analysis, Insights and Forecast - by Function
- 10.3.1. Thickener
- 10.3.2. Stablizer
- 10.3.3. Coating Agent
- 10.3.4. Fat Replacer
- 10.3.5. Gelling Agent
- 10.4. Market Analysis, Insights and Forecast - by Application
- 10.4.1. Bakery and Confectionary
- 10.4.2. Meat and Poultry Products
- 10.4.3. Beverages
- 10.4.4. Sauces and Dressings
- 10.4.5. Dairy Products
- 10.4.6. Other Applications
- 10.1. Market Analysis, Insights and Forecast - by Source
- 11. Middle East and Africa Hydrocolloid Industry Analysis, Insights and Forecast, 2020-2032
- 11.1. Market Analysis, Insights and Forecast - by Source
- 11.1.1. Natural
- 11.1.2. Synthetic
- 11.2. Market Analysis, Insights and Forecast - by Type
- 11.2.1. Gelatin
- 11.2.2. Carrageenan
- 11.2.3. Pectin
- 11.2.4. Xanthum Gum
- 11.2.5. Guar Gum
- 11.2.6. Other Types
- 11.3. Market Analysis, Insights and Forecast - by Function
- 11.3.1. Thickener
- 11.3.2. Stablizer
- 11.3.3. Coating Agent
- 11.3.4. Fat Replacer
- 11.3.5. Gelling Agent
- 11.4. Market Analysis, Insights and Forecast - by Application
- 11.4.1. Bakery and Confectionary
- 11.4.2. Meat and Poultry Products
- 11.4.3. Beverages
- 11.4.4. Sauces and Dressings
- 11.4.5. Dairy Products
- 11.4.6. Other Applications
- 11.1. Market Analysis, Insights and Forecast - by Source
- 12. Competitive Analysis
- 12.1. Company Profiles
- 12.1.1 ADM
- 12.1.1.1. Company Overview
- 12.1.1.2. Products
- 12.1.1.3. Company Financials
- 12.1.1.4. SWOT Analysis
- 12.1.2 Cargill Incorporated
- 12.1.2.1. Company Overview
- 12.1.2.2. Products
- 12.1.2.3. Company Financials
- 12.1.2.4. SWOT Analysis
- 12.1.3 NOREVO
- 12.1.3.1. Company Overview
- 12.1.3.2. Products
- 12.1.3.3. Company Financials
- 12.1.3.4. SWOT Analysis
- 12.1.4 J F Hydrocolloids Inc
- 12.1.4.1. Company Overview
- 12.1.4.2. Products
- 12.1.4.3. Company Financials
- 12.1.4.4. SWOT Analysis
- 12.1.5 Dupont
- 12.1.5.1. Company Overview
- 12.1.5.2. Products
- 12.1.5.3. Company Financials
- 12.1.5.4. SWOT Analysis
- 12.1.6 Ashland
- 12.1.6.1. Company Overview
- 12.1.6.2. Products
- 12.1.6.3. Company Financials
- 12.1.6.4. SWOT Analysis
- 12.1.7 DSM
- 12.1.7.1. Company Overview
- 12.1.7.2. Products
- 12.1.7.3. Company Financials
- 12.1.7.4. SWOT Analysis
- 12.1.8 AGARMEX SA DE CV
- 12.1.8.1. Company Overview
- 12.1.8.2. Products
- 12.1.8.3. Company Financials
- 12.1.8.4. SWOT Analysis
- 12.1.9 Ingredion Incorporated
- 12.1.9.1. Company Overview
- 12.1.9.2. Products
- 12.1.9.3. Company Financials
- 12.1.9.4. SWOT Analysis
- 12.1.10 B Braun Melsungen AG
- 12.1.10.1. Company Overview
- 12.1.10.2. Products
- 12.1.10.3. Company Financials
- 12.1.10.4. SWOT Analysis
- 12.1.11 Tate & Lyle*List Not Exhaustive
- 12.1.11.1. Company Overview
- 12.1.11.2. Products
- 12.1.11.3. Company Financials
- 12.1.11.4. SWOT Analysis
- 12.1.12 CP Kelco U S Inc
- 12.1.12.1. Company Overview
- 12.1.12.2. Products
- 12.1.12.3. Company Financials
- 12.1.12.4. SWOT Analysis
- 12.1.1 ADM
- 12.2. Market Entropy
- 12.2.1 Company's Key Areas Served
- 12.2.2 Recent Developments
- 12.3. Company Market Share Analysis 2025
- 12.3.1 Top 5 Companies Market Share Analysis
- 12.3.2 Top 3 Companies Market Share Analysis
- 12.4. List of Potential Customers
- 13. Research Methodology
List of Figures
- Figure 1: Global Hydrocolloid Industry Revenue Breakdown (million, %) by Region 2025 & 2033
- Figure 2: Asia Pacific Hydrocolloid Industry Revenue (million), by Source 2025 & 2033
- Figure 3: Asia Pacific Hydrocolloid Industry Revenue Share (%), by Source 2025 & 2033
- Figure 4: Asia Pacific Hydrocolloid Industry Revenue (million), by Type 2025 & 2033
- Figure 5: Asia Pacific Hydrocolloid Industry Revenue Share (%), by Type 2025 & 2033
- Figure 6: Asia Pacific Hydrocolloid Industry Revenue (million), by Function 2025 & 2033
- Figure 7: Asia Pacific Hydrocolloid Industry Revenue Share (%), by Function 2025 & 2033
- Figure 8: Asia Pacific Hydrocolloid Industry Revenue (million), by Application 2025 & 2033
- Figure 9: Asia Pacific Hydrocolloid Industry Revenue Share (%), by Application 2025 & 2033
- Figure 10: Asia Pacific Hydrocolloid Industry Revenue (million), by Country 2025 & 2033
- Figure 11: Asia Pacific Hydrocolloid Industry Revenue Share (%), by Country 2025 & 2033
- Figure 12: North America Hydrocolloid Industry Revenue (million), by Source 2025 & 2033
- Figure 13: North America Hydrocolloid Industry Revenue Share (%), by Source 2025 & 2033
- Figure 14: North America Hydrocolloid Industry Revenue (million), by Type 2025 & 2033
- Figure 15: North America Hydrocolloid Industry Revenue Share (%), by Type 2025 & 2033
- Figure 16: North America Hydrocolloid Industry Revenue (million), by Function 2025 & 2033
- Figure 17: North America Hydrocolloid Industry Revenue Share (%), by Function 2025 & 2033
- Figure 18: North America Hydrocolloid Industry Revenue (million), by Application 2025 & 2033
- Figure 19: North America Hydrocolloid Industry Revenue Share (%), by Application 2025 & 2033
- Figure 20: North America Hydrocolloid Industry Revenue (million), by Country 2025 & 2033
- Figure 21: North America Hydrocolloid Industry Revenue Share (%), by Country 2025 & 2033
- Figure 22: Europe Hydrocolloid Industry Revenue (million), by Source 2025 & 2033
- Figure 23: Europe Hydrocolloid Industry Revenue Share (%), by Source 2025 & 2033
- Figure 24: Europe Hydrocolloid Industry Revenue (million), by Type 2025 & 2033
- Figure 25: Europe Hydrocolloid Industry Revenue Share (%), by Type 2025 & 2033
- Figure 26: Europe Hydrocolloid Industry Revenue (million), by Function 2025 & 2033
- Figure 27: Europe Hydrocolloid Industry Revenue Share (%), by Function 2025 & 2033
- Figure 28: Europe Hydrocolloid Industry Revenue (million), by Application 2025 & 2033
- Figure 29: Europe Hydrocolloid Industry Revenue Share (%), by Application 2025 & 2033
- Figure 30: Europe Hydrocolloid Industry Revenue (million), by Country 2025 & 2033
- Figure 31: Europe Hydrocolloid Industry Revenue Share (%), by Country 2025 & 2033
- Figure 32: South America Hydrocolloid Industry Revenue (million), by Source 2025 & 2033
- Figure 33: South America Hydrocolloid Industry Revenue Share (%), by Source 2025 & 2033
- Figure 34: South America Hydrocolloid Industry Revenue (million), by Type 2025 & 2033
- Figure 35: South America Hydrocolloid Industry Revenue Share (%), by Type 2025 & 2033
- Figure 36: South America Hydrocolloid Industry Revenue (million), by Function 2025 & 2033
- Figure 37: South America Hydrocolloid Industry Revenue Share (%), by Function 2025 & 2033
- Figure 38: South America Hydrocolloid Industry Revenue (million), by Application 2025 & 2033
- Figure 39: South America Hydrocolloid Industry Revenue Share (%), by Application 2025 & 2033
- Figure 40: South America Hydrocolloid Industry Revenue (million), by Country 2025 & 2033
- Figure 41: South America Hydrocolloid Industry Revenue Share (%), by Country 2025 & 2033
- Figure 42: Middle East and Africa Hydrocolloid Industry Revenue (million), by Source 2025 & 2033
- Figure 43: Middle East and Africa Hydrocolloid Industry Revenue Share (%), by Source 2025 & 2033
- Figure 44: Middle East and Africa Hydrocolloid Industry Revenue (million), by Type 2025 & 2033
- Figure 45: Middle East and Africa Hydrocolloid Industry Revenue Share (%), by Type 2025 & 2033
- Figure 46: Middle East and Africa Hydrocolloid Industry Revenue (million), by Function 2025 & 2033
- Figure 47: Middle East and Africa Hydrocolloid Industry Revenue Share (%), by Function 2025 & 2033
- Figure 48: Middle East and Africa Hydrocolloid Industry Revenue (million), by Application 2025 & 2033
- Figure 49: Middle East and Africa Hydrocolloid Industry Revenue Share (%), by Application 2025 & 2033
- Figure 50: Middle East and Africa Hydrocolloid Industry Revenue (million), by Country 2025 & 2033
- Figure 51: Middle East and Africa Hydrocolloid Industry Revenue Share (%), by Country 2025 & 2033
List of Tables
- Table 1: Global Hydrocolloid Industry Revenue million Forecast, by Source 2020 & 2033
- Table 2: Global Hydrocolloid Industry Revenue million Forecast, by Type 2020 & 2033
- Table 3: Global Hydrocolloid Industry Revenue million Forecast, by Function 2020 & 2033
- Table 4: Global Hydrocolloid Industry Revenue million Forecast, by Application 2020 & 2033
- Table 5: Global Hydrocolloid Industry Revenue million Forecast, by Region 2020 & 2033
- Table 6: Global Hydrocolloid Industry Revenue million Forecast, by Source 2020 & 2033
- Table 7: Global Hydrocolloid Industry Revenue million Forecast, by Type 2020 & 2033
- Table 8: Global Hydrocolloid Industry Revenue million Forecast, by Function 2020 & 2033
- Table 9: Global Hydrocolloid Industry Revenue million Forecast, by Application 2020 & 2033
- Table 10: Global Hydrocolloid Industry Revenue million Forecast, by Country 2020 & 2033
- Table 11: China Hydrocolloid Industry Revenue (million) Forecast, by Application 2020 & 2033
- Table 12: India Hydrocolloid Industry Revenue (million) Forecast, by Application 2020 & 2033
- Table 13: Japan Hydrocolloid Industry Revenue (million) Forecast, by Application 2020 & 2033
- Table 14: South Korea Hydrocolloid Industry Revenue (million) Forecast, by Application 2020 & 2033
- Table 15: Rest of Asia Pacific Hydrocolloid Industry Revenue (million) Forecast, by Application 2020 & 2033
- Table 16: Global Hydrocolloid Industry Revenue million Forecast, by Source 2020 & 2033
- Table 17: Global Hydrocolloid Industry Revenue million Forecast, by Type 2020 & 2033
- Table 18: Global Hydrocolloid Industry Revenue million Forecast, by Function 2020 & 2033
- Table 19: Global Hydrocolloid Industry Revenue million Forecast, by Application 2020 & 2033
- Table 20: Global Hydrocolloid Industry Revenue million Forecast, by Country 2020 & 2033
- Table 21: United States Hydrocolloid Industry Revenue (million) Forecast, by Application 2020 & 2033
- Table 22: Canada Hydrocolloid Industry Revenue (million) Forecast, by Application 2020 & 2033
- Table 23: Mexico Hydrocolloid Industry Revenue (million) Forecast, by Application 2020 & 2033
- Table 24: Global Hydrocolloid Industry Revenue million Forecast, by Source 2020 & 2033
- Table 25: Global Hydrocolloid Industry Revenue million Forecast, by Type 2020 & 2033
- Table 26: Global Hydrocolloid Industry Revenue million Forecast, by Function 2020 & 2033
- Table 27: Global Hydrocolloid Industry Revenue million Forecast, by Application 2020 & 2033
- Table 28: Global Hydrocolloid Industry Revenue million Forecast, by Country 2020 & 2033
- Table 29: Germany Hydrocolloid Industry Revenue (million) Forecast, by Application 2020 & 2033
- Table 30: United Kingdom Hydrocolloid Industry Revenue (million) Forecast, by Application 2020 & 2033
- Table 31: Italy Hydrocolloid Industry Revenue (million) Forecast, by Application 2020 & 2033
- Table 32: France Hydrocolloid Industry Revenue (million) Forecast, by Application 2020 & 2033
- Table 33: Rest of Europe Hydrocolloid Industry Revenue (million) Forecast, by Application 2020 & 2033
- Table 34: Global Hydrocolloid Industry Revenue million Forecast, by Source 2020 & 2033
- Table 35: Global Hydrocolloid Industry Revenue million Forecast, by Type 2020 & 2033
- Table 36: Global Hydrocolloid Industry Revenue million Forecast, by Function 2020 & 2033
- Table 37: Global Hydrocolloid Industry Revenue million Forecast, by Application 2020 & 2033
- Table 38: Global Hydrocolloid Industry Revenue million Forecast, by Country 2020 & 2033
- Table 39: Brazil Hydrocolloid Industry Revenue (million) Forecast, by Application 2020 & 2033
- Table 40: Argentina Hydrocolloid Industry Revenue (million) Forecast, by Application 2020 & 2033
- Table 41: Rest of South America Hydrocolloid Industry Revenue (million) Forecast, by Application 2020 & 2033
- Table 42: Global Hydrocolloid Industry Revenue million Forecast, by Source 2020 & 2033
- Table 43: Global Hydrocolloid Industry Revenue million Forecast, by Type 2020 & 2033
- Table 44: Global Hydrocolloid Industry Revenue million Forecast, by Function 2020 & 2033
- Table 45: Global Hydrocolloid Industry Revenue million Forecast, by Application 2020 & 2033
- Table 46: Global Hydrocolloid Industry Revenue million Forecast, by Country 2020 & 2033
- Table 47: Saudi Arabia Hydrocolloid Industry Revenue (million) Forecast, by Application 2020 & 2033
- Table 48: South Africa Hydrocolloid Industry Revenue (million) Forecast, by Application 2020 & 2033
- Table 49: Rest of Middle East and Africa Hydrocolloid Industry Revenue (million) Forecast, by Application 2020 & 2033
Frequently Asked Questions
1. What is the projected Compound Annual Growth Rate (CAGR) of the Hydrocolloid Industry?
The projected CAGR is approximately 5%.
2. Which companies are prominent players in the Hydrocolloid Industry?
Key companies in the market include ADM, Cargill Incorporated, NOREVO, J F Hydrocolloids Inc, Dupont, Ashland, DSM, AGARMEX SA DE CV, Ingredion Incorporated, B Braun Melsungen AG, Tate & Lyle*List Not Exhaustive, CP Kelco U S Inc.
3. What are the main segments of the Hydrocolloid Industry?
The market segments include Source, Type, Function, Application.
4. Can you provide details about the market size?
The market size is estimated to be USD 13614.8 million as of 2022.
5. What are some drivers contributing to market growth?
Growing Demand in the Food and Beverage Industry; Increased R&D and Innovations in Hydrocolloids.
6. What are the notable trends driving market growth?
Increasing Demand from the Gelatin Segment.
7. Are there any restraints impacting market growth?
Adherence to International Quality Standards and Regulations; Unfavorable Conditions Arising Due to the COVID-19 Outbreak.
8. Can you provide examples of recent developments in the market?
In September 2021, Ingredion signed a new strategic distribution agreement with Batory Foods that consolidates Ingredion's reach in the west and central midwest in the United States.
9. What pricing options are available for accessing the report?
Pricing options include single-user, multi-user, and enterprise licenses priced at USD 4750, USD 5250, and USD 8750 respectively.
10. Is the market size provided in terms of value or volume?
The market size is provided in terms of value, measured in million.
11. Are there any specific market keywords associated with the report?
Yes, the market keyword associated with the report is "Hydrocolloid Industry," which aids in identifying and referencing the specific market segment covered.
12. How do I determine which pricing option suits my needs best?
The pricing options vary based on user requirements and access needs. Individual users may opt for single-user licenses, while businesses requiring broader access may choose multi-user or enterprise licenses for cost-effective access to the report.
13. Are there any additional resources or data provided in the Hydrocolloid Industry report?
While the report offers comprehensive insights, it's advisable to review the specific contents or supplementary materials provided to ascertain if additional resources or data are available.
14. How can I stay updated on further developments or reports in the Hydrocolloid Industry?
To stay informed about further developments, trends, and reports in the Hydrocolloid Industry, consider subscribing to industry newsletters, following relevant companies and organizations, or regularly checking reputable industry news sources and publications.
Methodology
Step 1 - Identification of Relevant Samples Size from Population Database


Step 2 - Approaches for Defining Global Market Size (Value, Volume* & Price*)

Note*: In applicable scenarios
Step 3 - Data Sources
Primary Research
- Web Analytics
- Survey Reports
- Research Institute
- Latest Research Reports
- Opinion Leaders
Secondary Research
- Annual Reports
- White Paper
- Latest Press Release
- Industry Association
- Paid Database
- Investor Presentations

Step 4 - Data Triangulation
Involves using different sources of information in order to increase the validity of a study
These sources are likely to be stakeholders in a program - participants, other researchers, program staff, other community members, and so on.
Then we put all data in single framework & apply various statistical tools to find out the dynamic on the market.
During the analysis stage, feedback from the stakeholder groups would be compared to determine areas of agreement as well as areas of divergence