

Key Insights
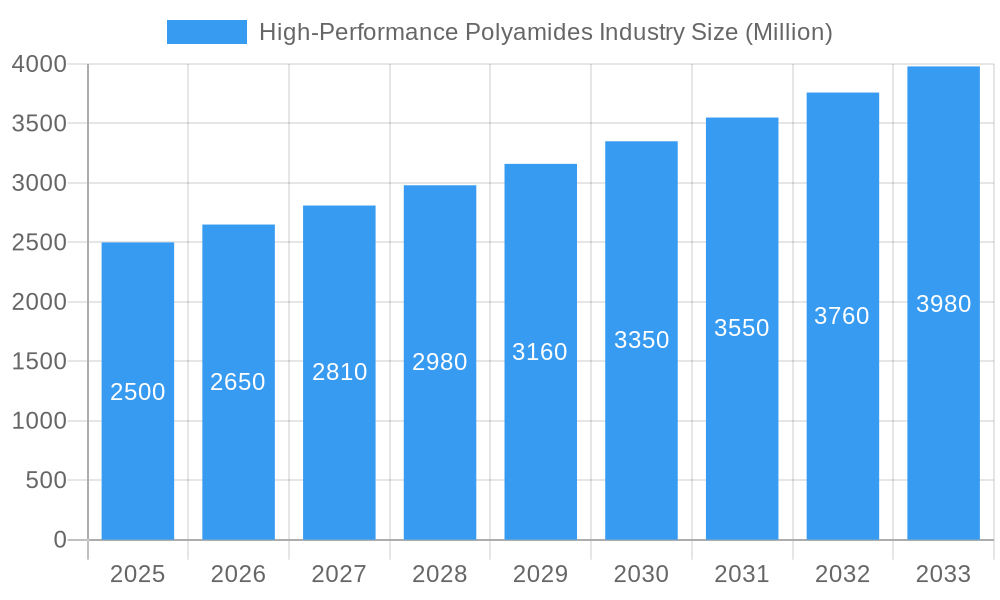
The High-Performance Polyamides (HPP) market is poised for substantial expansion, driven by escalating demand across critical sectors. The market, valued at $2.23 billion in the base year of 2025, is projected to achieve a Compound Annual Growth Rate (CAGR) of 5.5% from 2025 to 2033. This growth trajectory is underpinned by several pivotal factors.
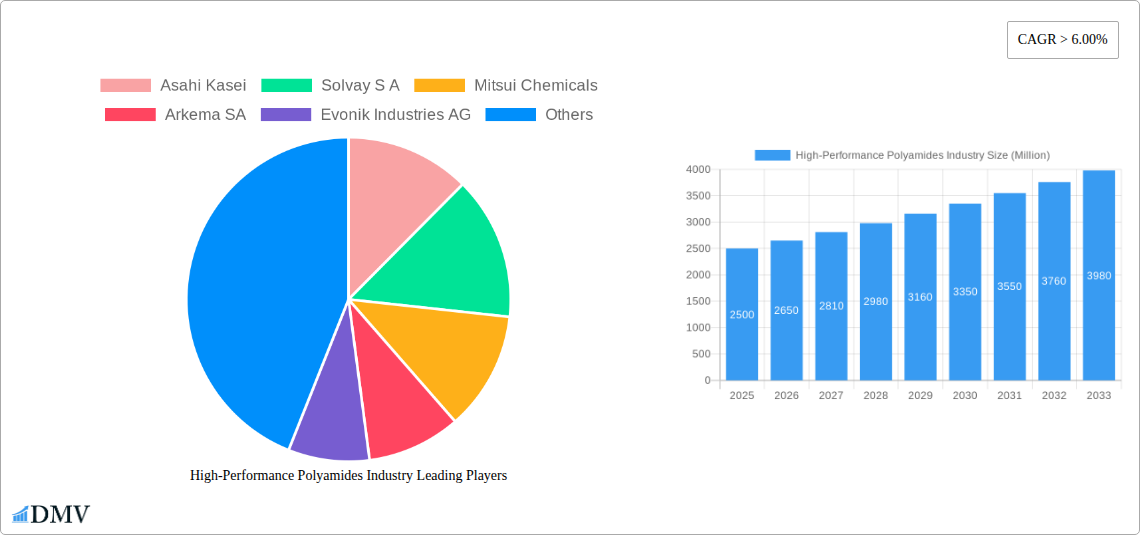
High-Performance Polyamides Industry Market Size (In Billion)
The automotive industry's imperative for lightweighting to enhance fuel efficiency and reduce emissions significantly boosts HPP adoption for components like engine parts and interior trims. Likewise, aerospace and defense sectors leverage HPP's superior strength-to-weight ratio and extreme temperature resistance for advanced aircraft and defense systems. The medical field benefits from HPP's biocompatibility and sterilizability, making it integral to medical devices and implants. Furthermore, the burgeoning electronics industry's requirement for advanced materials in connectors and insulators is a key demand driver.
High-Performance Polyamides Industry Company Market Share
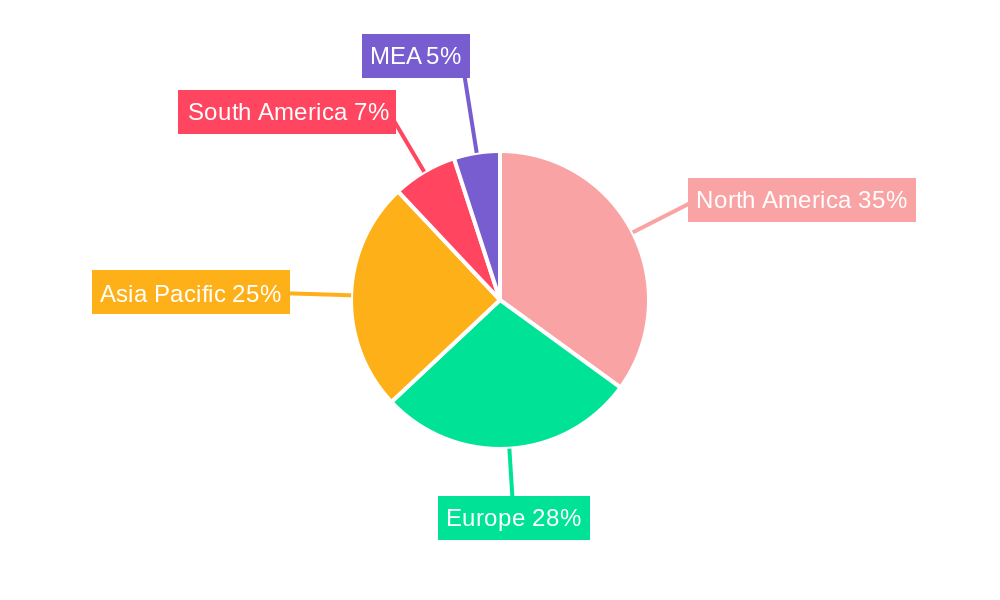
The HPP market is segmented by type, with Polyamide 11, Polyamide 46, Polyphthalamides, and Polyamide 6T emerging as prominent categories, each offering distinct properties tailored for specific applications. Geographically, North America and Asia-Pacific are anticipated to lead market growth due to robust industrial activity and technological innovation.
Challenges impacting market progression include raw material price volatility, especially for HPP production monomers. Additionally, the higher initial cost of HPP compared to conventional alternatives may limit adoption in price-sensitive applications.
However, ongoing technological advancements in HPP, focusing on enhanced performance and cost-effectiveness, are expected to offset these constraints. The development of sustainable and recyclable HPP variants is also gaining traction, fortifying the market's long-term prospects. Intensified competition among key players such as Asahi Kasei, Solvay SA, and BASF SE, alongside continuous research and development, will define the future market landscape.
High-Performance Polyamides Industry Market Report: 2019-2033
This comprehensive report provides a detailed analysis of the High-Performance Polyamides industry, offering invaluable insights for stakeholders seeking to navigate this dynamic market. Covering the period from 2019 to 2033, with a base year of 2025 and a forecast period of 2025-2033, this report examines market size, growth drivers, competitive landscape, and future opportunities. Key players such as Asahi Kasei, Solvay S.A., Mitsui Chemicals, Arkema SA, Evonik Industries AG, Teknor Apex Company, Toray Industries Inc, BASF SE, DuPont, and Lanxess are thoroughly analyzed. The report segments the market by type (Polyamide 11, Polyamide 46, Polyphthalamides, Polyamide 6T, Other Types) and end-user industry (Automotive, Aerospace and Defense, Medical, Industrial, Electrical and Electronics, Other End-user Industries). The total market value in 2025 is estimated at xx Million.
High-Performance Polyamides Industry Market Composition & Trends
This section delves into the intricacies of the high-performance polyamides market, examining its concentration, innovation drivers, regulatory landscape, substitute products, end-user profiles, and merger & acquisition (M&A) activities. The market is characterized by a moderately concentrated landscape, with the top 10 players holding an estimated xx% market share in 2025. Innovation is driven by the need for lighter, stronger, and more durable materials across diverse applications. Stringent regulatory frameworks concerning material safety and environmental impact are shaping industry practices. Competition from alternative materials, such as high-performance thermoplastics, is a key factor to consider.
- Market Share Distribution (2025): Top 3 players hold xx%, next 7 players hold xx%, fragmented market holds xx%.
- M&A Activity (2019-2024): Total deal value estimated at xx Million, with an average deal size of xx Million. Key drivers for M&A activity include expanding product portfolios and accessing new technologies.
- End-User Profile: The automotive and aerospace & defense sectors are major consumers, driven by stringent requirements for lightweighting and high-performance characteristics.
High-Performance Polyamides Industry Industry Evolution
This section traces the evolution of the high-performance polyamides market, examining growth trajectories, technological advancements, and evolving consumer preferences. The market experienced a Compound Annual Growth Rate (CAGR) of xx% during the historical period (2019-2024) and is projected to grow at a CAGR of xx% during the forecast period (2025-2033), reaching an estimated value of xx Million by 2033. Key technological advancements include the development of new polymer chemistries with enhanced properties, leading to wider applications and increased adoption rates. Consumer demand for sustainable and recyclable materials is pushing the industry toward eco-friendly solutions.
Leading Regions, Countries, or Segments in High-Performance Polyamides Industry
This section identifies the dominant regions, countries, and segments within the high-performance polyamides market.
Dominant Region: North America is projected to hold the largest market share in 2025, driven by strong demand from the automotive and aerospace industries. Asia-Pacific is expected to exhibit the highest growth rate.
Key Drivers:
- Automotive: Stringent fuel efficiency regulations and the increasing adoption of electric vehicles are driving demand for lightweight polyamides in automotive components.
- Aerospace & Defense: The need for high-strength, lightweight materials in aircraft and defense systems is a key driver for growth.
- Polyamide 6T: Its high temperature resistance and chemical stability make it particularly suitable for high-performance applications.
- Investment Trends: Significant investments in R&D and manufacturing capacity expansion are fueling market growth.
- Regulatory Support: Government initiatives promoting the use of sustainable and high-performance materials are boosting demand.
Detailed analysis of dominance factors reveals strong government support, advanced manufacturing capabilities, and a robust automotive and aerospace sector as primary contributors to regional leadership.
High-Performance Polyamides Industry Product Innovations
Recent innovations focus on enhancing the mechanical properties, thermal stability, and chemical resistance of high-performance polyamides. New grades with improved flame retardancy and biodegradability are gaining traction. These advancements expand the range of applications to include demanding sectors such as medical devices and electronics. Unique selling propositions include superior strength-to-weight ratios, enhanced durability, and improved chemical resistance, enabling lighter, more efficient, and longer-lasting products.
Propelling Factors for High-Performance Polyamides Industry Growth
Several factors are driving the growth of the high-performance polyamides market. Technological advancements, such as the development of new polymer chemistries with improved properties, are expanding the range of applications. Economic growth in key end-use sectors, particularly the automotive and aerospace industries, is fueling demand. Favorable government regulations and policies promoting the use of sustainable materials are also contributing to market expansion.
Obstacles in the High-Performance Polyamides Industry Market
The high-performance polyamides market faces several challenges. Fluctuations in raw material prices and supply chain disruptions can impact production costs and profitability. Stringent environmental regulations and the need for sustainable solutions are increasing compliance costs. Intense competition from substitute materials, such as other high-performance thermoplastics, is putting pressure on margins.
Future Opportunities in High-Performance Polyamides Industry
The market presents significant growth opportunities in emerging applications such as 3D printing, electric vehicles, and renewable energy technologies. The development of new grades with enhanced properties, such as improved biodegradability and recyclability, will unlock new markets. Expanding into developing economies with growing industrial sectors offers significant potential for future growth.
Major Players in the High-Performance Polyamides Industry Ecosystem
Key Developments in High-Performance Polyamides Industry Industry
- 2023-Q3: Arkema SA launched a new grade of polyamide 11 with enhanced biodegradability.
- 2022-Q4: Solvay S.A. announced a strategic partnership to develop new high-performance polyamide compounds for electric vehicle applications.
- 2021-Q2: BASF SE invested xx Million in expanding its polyamide production capacity.
- 2020-Q1: Mitsui Chemicals acquired a smaller polyamide producer, expanding its market share. (Further details on specific acquisitions and their values are unavailable and hence are not included)
Strategic High-Performance Polyamides Industry Market Forecast
The high-performance polyamides market is poised for robust growth, driven by increasing demand from key end-use sectors and technological advancements. Emerging applications in electric vehicles, renewable energy, and 3D printing will fuel future growth. The market's potential is substantial, offering significant opportunities for established players and new entrants alike. Sustainable solutions and innovative materials will play a crucial role in shaping the industry's future.
High-Performance Polyamides Industry Segmentation
-
1. Type
- 1.1. Polyamide 11
- 1.2. Polyamide 46
- 1.3. Polyphthalamides
- 1.4. Polyamide 6T
- 1.5. Other Types
-
2. End-user Industry
- 2.1. Automotive
- 2.2. Aerospace and Defense
- 2.3. Medical
- 2.4. Industrial
- 2.5. Electrical and Electronics
- 2.6. Other End-user Industries
High-Performance Polyamides Industry Segmentation By Geography
-
1. Asia Pacific
- 1.1. China
- 1.2. India
- 1.3. Japan
- 1.4. South Korea
- 1.5. Rest of Asia Pacific
-
2. North America
- 2.1. United States
- 2.2. Canada
- 2.3. Mexico
-
3. Europe
- 3.1. Germany
- 3.2. United Kingdom
- 3.3. France
- 3.4. Italy
- 3.5. Rest of Europe
-
4. South America
- 4.1. Brazil
- 4.2. Argentina
- 4.3. Rest of South America
-
5. Middle East and Africa
- 5.1. Saudi Arabia
- 5.2. South Africa
- 5.3. Rest of Middle East and Africa
High-Performance Polyamides Industry Regional Market Share
Geographic Coverage of High-Performance Polyamides Industry
High-Performance Polyamides Industry REPORT HIGHLIGHTS
| Aspects | Details |
|---|---|
| Study Period | 2020-2034 |
| Base Year | 2025 |
| Estimated Year | 2026 |
| Forecast Period | 2026-2034 |
| Historical Period | 2020-2025 |
| Growth Rate | CAGR of 5.5% from 2020-2034 |
| Segmentation |
|
Table of Contents
- 1. Introduction
- 1.1. Research Scope
- 1.2. Market Segmentation
- 1.3. Research Objective
- 1.4. Definitions and Assumptions
- 2. Executive Summary
- 2.1. Market Snapshot
- 3. Market Dynamics
- 3.1. Market Drivers
- 3.2. Market Restrains
- 3.3. Market Trends
- 3.4. Market Opportunities
- 4. Market Factor Analysis
- 4.1. Porters Five Forces
- 4.1.1. Bargaining Power of Suppliers
- 4.1.2. Bargaining Power of Buyers
- 4.1.3. Threat of New Entrants
- 4.1.4. Threat of Substitutes
- 4.1.5. Competitive Rivalry
- 4.2. PESTEL analysis
- 4.3. BCG Analysis
- 4.3.1. Stars (High Growth, High Market Share)
- 4.3.2. Cash Cows (Low Growth, High Market Share)
- 4.3.3. Question Mark (High Growth, Low Market Share)
- 4.3.4. Dogs (Low Growth, Low Market Share)
- 4.4. Ansoff Matrix Analysis
- 4.5. Supply Chain Analysis
- 4.6. Regulatory Landscape
- 4.7. Current Market Potential and Opportunity Assessment (TAM–SAM–SOM Framework)
- 4.8. DMV Analyst Note
- 4.1. Porters Five Forces
- 5. Market Analysis, Insights and Forecast 2021-2033
- 5.1. Market Analysis, Insights and Forecast - by Type
- 5.1.1. Polyamide 11
- 5.1.2. Polyamide 46
- 5.1.3. Polyphthalamides
- 5.1.4. Polyamide 6T
- 5.1.5. Other Types
- 5.2. Market Analysis, Insights and Forecast - by End-user Industry
- 5.2.1. Automotive
- 5.2.2. Aerospace and Defense
- 5.2.3. Medical
- 5.2.4. Industrial
- 5.2.5. Electrical and Electronics
- 5.2.6. Other End-user Industries
- 5.3. Market Analysis, Insights and Forecast - by Region
- 5.3.1. Asia Pacific
- 5.3.2. North America
- 5.3.3. Europe
- 5.3.4. South America
- 5.3.5. Middle East and Africa
- 5.1. Market Analysis, Insights and Forecast - by Type
- 6. Global High-Performance Polyamides Industry Analysis, Insights and Forecast, 2021-2033
- 6.1. Market Analysis, Insights and Forecast - by Type
- 6.1.1. Polyamide 11
- 6.1.2. Polyamide 46
- 6.1.3. Polyphthalamides
- 6.1.4. Polyamide 6T
- 6.1.5. Other Types
- 6.2. Market Analysis, Insights and Forecast - by End-user Industry
- 6.2.1. Automotive
- 6.2.2. Aerospace and Defense
- 6.2.3. Medical
- 6.2.4. Industrial
- 6.2.5. Electrical and Electronics
- 6.2.6. Other End-user Industries
- 6.1. Market Analysis, Insights and Forecast - by Type
- 7. Asia Pacific High-Performance Polyamides Industry Analysis, Insights and Forecast, 2020-2032
- 7.1. Market Analysis, Insights and Forecast - by Type
- 7.1.1. Polyamide 11
- 7.1.2. Polyamide 46
- 7.1.3. Polyphthalamides
- 7.1.4. Polyamide 6T
- 7.1.5. Other Types
- 7.2. Market Analysis, Insights and Forecast - by End-user Industry
- 7.2.1. Automotive
- 7.2.2. Aerospace and Defense
- 7.2.3. Medical
- 7.2.4. Industrial
- 7.2.5. Electrical and Electronics
- 7.2.6. Other End-user Industries
- 7.1. Market Analysis, Insights and Forecast - by Type
- 8. North America High-Performance Polyamides Industry Analysis, Insights and Forecast, 2020-2032
- 8.1. Market Analysis, Insights and Forecast - by Type
- 8.1.1. Polyamide 11
- 8.1.2. Polyamide 46
- 8.1.3. Polyphthalamides
- 8.1.4. Polyamide 6T
- 8.1.5. Other Types
- 8.2. Market Analysis, Insights and Forecast - by End-user Industry
- 8.2.1. Automotive
- 8.2.2. Aerospace and Defense
- 8.2.3. Medical
- 8.2.4. Industrial
- 8.2.5. Electrical and Electronics
- 8.2.6. Other End-user Industries
- 8.1. Market Analysis, Insights and Forecast - by Type
- 9. Europe High-Performance Polyamides Industry Analysis, Insights and Forecast, 2020-2032
- 9.1. Market Analysis, Insights and Forecast - by Type
- 9.1.1. Polyamide 11
- 9.1.2. Polyamide 46
- 9.1.3. Polyphthalamides
- 9.1.4. Polyamide 6T
- 9.1.5. Other Types
- 9.2. Market Analysis, Insights and Forecast - by End-user Industry
- 9.2.1. Automotive
- 9.2.2. Aerospace and Defense
- 9.2.3. Medical
- 9.2.4. Industrial
- 9.2.5. Electrical and Electronics
- 9.2.6. Other End-user Industries
- 9.1. Market Analysis, Insights and Forecast - by Type
- 10. South America High-Performance Polyamides Industry Analysis, Insights and Forecast, 2020-2032
- 10.1. Market Analysis, Insights and Forecast - by Type
- 10.1.1. Polyamide 11
- 10.1.2. Polyamide 46
- 10.1.3. Polyphthalamides
- 10.1.4. Polyamide 6T
- 10.1.5. Other Types
- 10.2. Market Analysis, Insights and Forecast - by End-user Industry
- 10.2.1. Automotive
- 10.2.2. Aerospace and Defense
- 10.2.3. Medical
- 10.2.4. Industrial
- 10.2.5. Electrical and Electronics
- 10.2.6. Other End-user Industries
- 10.1. Market Analysis, Insights and Forecast - by Type
- 11. Middle East and Africa High-Performance Polyamides Industry Analysis, Insights and Forecast, 2020-2032
- 11.1. Market Analysis, Insights and Forecast - by Type
- 11.1.1. Polyamide 11
- 11.1.2. Polyamide 46
- 11.1.3. Polyphthalamides
- 11.1.4. Polyamide 6T
- 11.1.5. Other Types
- 11.2. Market Analysis, Insights and Forecast - by End-user Industry
- 11.2.1. Automotive
- 11.2.2. Aerospace and Defense
- 11.2.3. Medical
- 11.2.4. Industrial
- 11.2.5. Electrical and Electronics
- 11.2.6. Other End-user Industries
- 11.1. Market Analysis, Insights and Forecast - by Type
- 12. Competitive Analysis
- 12.1. Company Profiles
- 12.1.1 Asahi Kasei
- 12.1.1.1. Company Overview
- 12.1.1.2. Products
- 12.1.1.3. Company Financials
- 12.1.1.4. SWOT Analysis
- 12.1.2 Solvay S A
- 12.1.2.1. Company Overview
- 12.1.2.2. Products
- 12.1.2.3. Company Financials
- 12.1.2.4. SWOT Analysis
- 12.1.3 Mitsui Chemicals
- 12.1.3.1. Company Overview
- 12.1.3.2. Products
- 12.1.3.3. Company Financials
- 12.1.3.4. SWOT Analysis
- 12.1.4 Arkema SA
- 12.1.4.1. Company Overview
- 12.1.4.2. Products
- 12.1.4.3. Company Financials
- 12.1.4.4. SWOT Analysis
- 12.1.5 Evonik Industries AG
- 12.1.5.1. Company Overview
- 12.1.5.2. Products
- 12.1.5.3. Company Financials
- 12.1.5.4. SWOT Analysis
- 12.1.6 Teknor Apex Company
- 12.1.6.1. Company Overview
- 12.1.6.2. Products
- 12.1.6.3. Company Financials
- 12.1.6.4. SWOT Analysis
- 12.1.7 Toray Industries Inc
- 12.1.7.1. Company Overview
- 12.1.7.2. Products
- 12.1.7.3. Company Financials
- 12.1.7.4. SWOT Analysis
- 12.1.8 BASF SE
- 12.1.8.1. Company Overview
- 12.1.8.2. Products
- 12.1.8.3. Company Financials
- 12.1.8.4. SWOT Analysis
- 12.1.9 DuPont
- 12.1.9.1. Company Overview
- 12.1.9.2. Products
- 12.1.9.3. Company Financials
- 12.1.9.4. SWOT Analysis
- 12.1.10 Lanxess
- 12.1.10.1. Company Overview
- 12.1.10.2. Products
- 12.1.10.3. Company Financials
- 12.1.10.4. SWOT Analysis
- 12.1.1 Asahi Kasei
- 12.2. Market Entropy
- 12.2.1 Company's Key Areas Served
- 12.2.2 Recent Developments
- 12.3. Company Market Share Analysis 2025
- 12.3.1 Top 5 Companies Market Share Analysis
- 12.3.2 Top 3 Companies Market Share Analysis
- 12.4. List of Potential Customers
- 13. Research Methodology
List of Figures
- Figure 1: Global High-Performance Polyamides Industry Revenue Breakdown (billion, %) by Region 2025 & 2033
- Figure 2: Global High-Performance Polyamides Industry Volume Breakdown (K Tons, %) by Region 2025 & 2033
- Figure 3: Asia Pacific High-Performance Polyamides Industry Revenue (billion), by Type 2025 & 2033
- Figure 4: Asia Pacific High-Performance Polyamides Industry Volume (K Tons), by Type 2025 & 2033
- Figure 5: Asia Pacific High-Performance Polyamides Industry Revenue Share (%), by Type 2025 & 2033
- Figure 6: Asia Pacific High-Performance Polyamides Industry Volume Share (%), by Type 2025 & 2033
- Figure 7: Asia Pacific High-Performance Polyamides Industry Revenue (billion), by End-user Industry 2025 & 2033
- Figure 8: Asia Pacific High-Performance Polyamides Industry Volume (K Tons), by End-user Industry 2025 & 2033
- Figure 9: Asia Pacific High-Performance Polyamides Industry Revenue Share (%), by End-user Industry 2025 & 2033
- Figure 10: Asia Pacific High-Performance Polyamides Industry Volume Share (%), by End-user Industry 2025 & 2033
- Figure 11: Asia Pacific High-Performance Polyamides Industry Revenue (billion), by Country 2025 & 2033
- Figure 12: Asia Pacific High-Performance Polyamides Industry Volume (K Tons), by Country 2025 & 2033
- Figure 13: Asia Pacific High-Performance Polyamides Industry Revenue Share (%), by Country 2025 & 2033
- Figure 14: Asia Pacific High-Performance Polyamides Industry Volume Share (%), by Country 2025 & 2033
- Figure 15: North America High-Performance Polyamides Industry Revenue (billion), by Type 2025 & 2033
- Figure 16: North America High-Performance Polyamides Industry Volume (K Tons), by Type 2025 & 2033
- Figure 17: North America High-Performance Polyamides Industry Revenue Share (%), by Type 2025 & 2033
- Figure 18: North America High-Performance Polyamides Industry Volume Share (%), by Type 2025 & 2033
- Figure 19: North America High-Performance Polyamides Industry Revenue (billion), by End-user Industry 2025 & 2033
- Figure 20: North America High-Performance Polyamides Industry Volume (K Tons), by End-user Industry 2025 & 2033
- Figure 21: North America High-Performance Polyamides Industry Revenue Share (%), by End-user Industry 2025 & 2033
- Figure 22: North America High-Performance Polyamides Industry Volume Share (%), by End-user Industry 2025 & 2033
- Figure 23: North America High-Performance Polyamides Industry Revenue (billion), by Country 2025 & 2033
- Figure 24: North America High-Performance Polyamides Industry Volume (K Tons), by Country 2025 & 2033
- Figure 25: North America High-Performance Polyamides Industry Revenue Share (%), by Country 2025 & 2033
- Figure 26: North America High-Performance Polyamides Industry Volume Share (%), by Country 2025 & 2033
- Figure 27: Europe High-Performance Polyamides Industry Revenue (billion), by Type 2025 & 2033
- Figure 28: Europe High-Performance Polyamides Industry Volume (K Tons), by Type 2025 & 2033
- Figure 29: Europe High-Performance Polyamides Industry Revenue Share (%), by Type 2025 & 2033
- Figure 30: Europe High-Performance Polyamides Industry Volume Share (%), by Type 2025 & 2033
- Figure 31: Europe High-Performance Polyamides Industry Revenue (billion), by End-user Industry 2025 & 2033
- Figure 32: Europe High-Performance Polyamides Industry Volume (K Tons), by End-user Industry 2025 & 2033
- Figure 33: Europe High-Performance Polyamides Industry Revenue Share (%), by End-user Industry 2025 & 2033
- Figure 34: Europe High-Performance Polyamides Industry Volume Share (%), by End-user Industry 2025 & 2033
- Figure 35: Europe High-Performance Polyamides Industry Revenue (billion), by Country 2025 & 2033
- Figure 36: Europe High-Performance Polyamides Industry Volume (K Tons), by Country 2025 & 2033
- Figure 37: Europe High-Performance Polyamides Industry Revenue Share (%), by Country 2025 & 2033
- Figure 38: Europe High-Performance Polyamides Industry Volume Share (%), by Country 2025 & 2033
- Figure 39: South America High-Performance Polyamides Industry Revenue (billion), by Type 2025 & 2033
- Figure 40: South America High-Performance Polyamides Industry Volume (K Tons), by Type 2025 & 2033
- Figure 41: South America High-Performance Polyamides Industry Revenue Share (%), by Type 2025 & 2033
- Figure 42: South America High-Performance Polyamides Industry Volume Share (%), by Type 2025 & 2033
- Figure 43: South America High-Performance Polyamides Industry Revenue (billion), by End-user Industry 2025 & 2033
- Figure 44: South America High-Performance Polyamides Industry Volume (K Tons), by End-user Industry 2025 & 2033
- Figure 45: South America High-Performance Polyamides Industry Revenue Share (%), by End-user Industry 2025 & 2033
- Figure 46: South America High-Performance Polyamides Industry Volume Share (%), by End-user Industry 2025 & 2033
- Figure 47: South America High-Performance Polyamides Industry Revenue (billion), by Country 2025 & 2033
- Figure 48: South America High-Performance Polyamides Industry Volume (K Tons), by Country 2025 & 2033
- Figure 49: South America High-Performance Polyamides Industry Revenue Share (%), by Country 2025 & 2033
- Figure 50: South America High-Performance Polyamides Industry Volume Share (%), by Country 2025 & 2033
- Figure 51: Middle East and Africa High-Performance Polyamides Industry Revenue (billion), by Type 2025 & 2033
- Figure 52: Middle East and Africa High-Performance Polyamides Industry Volume (K Tons), by Type 2025 & 2033
- Figure 53: Middle East and Africa High-Performance Polyamides Industry Revenue Share (%), by Type 2025 & 2033
- Figure 54: Middle East and Africa High-Performance Polyamides Industry Volume Share (%), by Type 2025 & 2033
- Figure 55: Middle East and Africa High-Performance Polyamides Industry Revenue (billion), by End-user Industry 2025 & 2033
- Figure 56: Middle East and Africa High-Performance Polyamides Industry Volume (K Tons), by End-user Industry 2025 & 2033
- Figure 57: Middle East and Africa High-Performance Polyamides Industry Revenue Share (%), by End-user Industry 2025 & 2033
- Figure 58: Middle East and Africa High-Performance Polyamides Industry Volume Share (%), by End-user Industry 2025 & 2033
- Figure 59: Middle East and Africa High-Performance Polyamides Industry Revenue (billion), by Country 2025 & 2033
- Figure 60: Middle East and Africa High-Performance Polyamides Industry Volume (K Tons), by Country 2025 & 2033
- Figure 61: Middle East and Africa High-Performance Polyamides Industry Revenue Share (%), by Country 2025 & 2033
- Figure 62: Middle East and Africa High-Performance Polyamides Industry Volume Share (%), by Country 2025 & 2033
List of Tables
- Table 1: Global High-Performance Polyamides Industry Revenue billion Forecast, by Type 2020 & 2033
- Table 2: Global High-Performance Polyamides Industry Volume K Tons Forecast, by Type 2020 & 2033
- Table 3: Global High-Performance Polyamides Industry Revenue billion Forecast, by End-user Industry 2020 & 2033
- Table 4: Global High-Performance Polyamides Industry Volume K Tons Forecast, by End-user Industry 2020 & 2033
- Table 5: Global High-Performance Polyamides Industry Revenue billion Forecast, by Region 2020 & 2033
- Table 6: Global High-Performance Polyamides Industry Volume K Tons Forecast, by Region 2020 & 2033
- Table 7: Global High-Performance Polyamides Industry Revenue billion Forecast, by Type 2020 & 2033
- Table 8: Global High-Performance Polyamides Industry Volume K Tons Forecast, by Type 2020 & 2033
- Table 9: Global High-Performance Polyamides Industry Revenue billion Forecast, by End-user Industry 2020 & 2033
- Table 10: Global High-Performance Polyamides Industry Volume K Tons Forecast, by End-user Industry 2020 & 2033
- Table 11: Global High-Performance Polyamides Industry Revenue billion Forecast, by Country 2020 & 2033
- Table 12: Global High-Performance Polyamides Industry Volume K Tons Forecast, by Country 2020 & 2033
- Table 13: China High-Performance Polyamides Industry Revenue (billion) Forecast, by Application 2020 & 2033
- Table 14: China High-Performance Polyamides Industry Volume (K Tons) Forecast, by Application 2020 & 2033
- Table 15: India High-Performance Polyamides Industry Revenue (billion) Forecast, by Application 2020 & 2033
- Table 16: India High-Performance Polyamides Industry Volume (K Tons) Forecast, by Application 2020 & 2033
- Table 17: Japan High-Performance Polyamides Industry Revenue (billion) Forecast, by Application 2020 & 2033
- Table 18: Japan High-Performance Polyamides Industry Volume (K Tons) Forecast, by Application 2020 & 2033
- Table 19: South Korea High-Performance Polyamides Industry Revenue (billion) Forecast, by Application 2020 & 2033
- Table 20: South Korea High-Performance Polyamides Industry Volume (K Tons) Forecast, by Application 2020 & 2033
- Table 21: Rest of Asia Pacific High-Performance Polyamides Industry Revenue (billion) Forecast, by Application 2020 & 2033
- Table 22: Rest of Asia Pacific High-Performance Polyamides Industry Volume (K Tons) Forecast, by Application 2020 & 2033
- Table 23: Global High-Performance Polyamides Industry Revenue billion Forecast, by Type 2020 & 2033
- Table 24: Global High-Performance Polyamides Industry Volume K Tons Forecast, by Type 2020 & 2033
- Table 25: Global High-Performance Polyamides Industry Revenue billion Forecast, by End-user Industry 2020 & 2033
- Table 26: Global High-Performance Polyamides Industry Volume K Tons Forecast, by End-user Industry 2020 & 2033
- Table 27: Global High-Performance Polyamides Industry Revenue billion Forecast, by Country 2020 & 2033
- Table 28: Global High-Performance Polyamides Industry Volume K Tons Forecast, by Country 2020 & 2033
- Table 29: United States High-Performance Polyamides Industry Revenue (billion) Forecast, by Application 2020 & 2033
- Table 30: United States High-Performance Polyamides Industry Volume (K Tons) Forecast, by Application 2020 & 2033
- Table 31: Canada High-Performance Polyamides Industry Revenue (billion) Forecast, by Application 2020 & 2033
- Table 32: Canada High-Performance Polyamides Industry Volume (K Tons) Forecast, by Application 2020 & 2033
- Table 33: Mexico High-Performance Polyamides Industry Revenue (billion) Forecast, by Application 2020 & 2033
- Table 34: Mexico High-Performance Polyamides Industry Volume (K Tons) Forecast, by Application 2020 & 2033
- Table 35: Global High-Performance Polyamides Industry Revenue billion Forecast, by Type 2020 & 2033
- Table 36: Global High-Performance Polyamides Industry Volume K Tons Forecast, by Type 2020 & 2033
- Table 37: Global High-Performance Polyamides Industry Revenue billion Forecast, by End-user Industry 2020 & 2033
- Table 38: Global High-Performance Polyamides Industry Volume K Tons Forecast, by End-user Industry 2020 & 2033
- Table 39: Global High-Performance Polyamides Industry Revenue billion Forecast, by Country 2020 & 2033
- Table 40: Global High-Performance Polyamides Industry Volume K Tons Forecast, by Country 2020 & 2033
- Table 41: Germany High-Performance Polyamides Industry Revenue (billion) Forecast, by Application 2020 & 2033
- Table 42: Germany High-Performance Polyamides Industry Volume (K Tons) Forecast, by Application 2020 & 2033
- Table 43: United Kingdom High-Performance Polyamides Industry Revenue (billion) Forecast, by Application 2020 & 2033
- Table 44: United Kingdom High-Performance Polyamides Industry Volume (K Tons) Forecast, by Application 2020 & 2033
- Table 45: France High-Performance Polyamides Industry Revenue (billion) Forecast, by Application 2020 & 2033
- Table 46: France High-Performance Polyamides Industry Volume (K Tons) Forecast, by Application 2020 & 2033
- Table 47: Italy High-Performance Polyamides Industry Revenue (billion) Forecast, by Application 2020 & 2033
- Table 48: Italy High-Performance Polyamides Industry Volume (K Tons) Forecast, by Application 2020 & 2033
- Table 49: Rest of Europe High-Performance Polyamides Industry Revenue (billion) Forecast, by Application 2020 & 2033
- Table 50: Rest of Europe High-Performance Polyamides Industry Volume (K Tons) Forecast, by Application 2020 & 2033
- Table 51: Global High-Performance Polyamides Industry Revenue billion Forecast, by Type 2020 & 2033
- Table 52: Global High-Performance Polyamides Industry Volume K Tons Forecast, by Type 2020 & 2033
- Table 53: Global High-Performance Polyamides Industry Revenue billion Forecast, by End-user Industry 2020 & 2033
- Table 54: Global High-Performance Polyamides Industry Volume K Tons Forecast, by End-user Industry 2020 & 2033
- Table 55: Global High-Performance Polyamides Industry Revenue billion Forecast, by Country 2020 & 2033
- Table 56: Global High-Performance Polyamides Industry Volume K Tons Forecast, by Country 2020 & 2033
- Table 57: Brazil High-Performance Polyamides Industry Revenue (billion) Forecast, by Application 2020 & 2033
- Table 58: Brazil High-Performance Polyamides Industry Volume (K Tons) Forecast, by Application 2020 & 2033
- Table 59: Argentina High-Performance Polyamides Industry Revenue (billion) Forecast, by Application 2020 & 2033
- Table 60: Argentina High-Performance Polyamides Industry Volume (K Tons) Forecast, by Application 2020 & 2033
- Table 61: Rest of South America High-Performance Polyamides Industry Revenue (billion) Forecast, by Application 2020 & 2033
- Table 62: Rest of South America High-Performance Polyamides Industry Volume (K Tons) Forecast, by Application 2020 & 2033
- Table 63: Global High-Performance Polyamides Industry Revenue billion Forecast, by Type 2020 & 2033
- Table 64: Global High-Performance Polyamides Industry Volume K Tons Forecast, by Type 2020 & 2033
- Table 65: Global High-Performance Polyamides Industry Revenue billion Forecast, by End-user Industry 2020 & 2033
- Table 66: Global High-Performance Polyamides Industry Volume K Tons Forecast, by End-user Industry 2020 & 2033
- Table 67: Global High-Performance Polyamides Industry Revenue billion Forecast, by Country 2020 & 2033
- Table 68: Global High-Performance Polyamides Industry Volume K Tons Forecast, by Country 2020 & 2033
- Table 69: Saudi Arabia High-Performance Polyamides Industry Revenue (billion) Forecast, by Application 2020 & 2033
- Table 70: Saudi Arabia High-Performance Polyamides Industry Volume (K Tons) Forecast, by Application 2020 & 2033
- Table 71: South Africa High-Performance Polyamides Industry Revenue (billion) Forecast, by Application 2020 & 2033
- Table 72: South Africa High-Performance Polyamides Industry Volume (K Tons) Forecast, by Application 2020 & 2033
- Table 73: Rest of Middle East and Africa High-Performance Polyamides Industry Revenue (billion) Forecast, by Application 2020 & 2033
- Table 74: Rest of Middle East and Africa High-Performance Polyamides Industry Volume (K Tons) Forecast, by Application 2020 & 2033
Frequently Asked Questions
1. What is the projected Compound Annual Growth Rate (CAGR) of the High-Performance Polyamides Industry?
The projected CAGR is approximately 5.5%.
2. Which companies are prominent players in the High-Performance Polyamides Industry?
Key companies in the market include Asahi Kasei, Solvay S A, Mitsui Chemicals, Arkema SA, Evonik Industries AG, Teknor Apex Company, Toray Industries Inc, BASF SE, DuPont, Lanxess.
3. What are the main segments of the High-Performance Polyamides Industry?
The market segments include Type, End-user Industry.
4. Can you provide details about the market size?
The market size is estimated to be USD 2.23 billion as of 2022.
5. What are some drivers contributing to market growth?
; Increasing Applications for High-Performance Polymers; Growing Demand from the Automobile Industry.
6. What are the notable trends driving market growth?
Growing Demand from Automobile Sector.
7. Are there any restraints impacting market growth?
; High cost and Impact of COVID-19; Other Restraints.
8. Can you provide examples of recent developments in the market?
N/A
9. What pricing options are available for accessing the report?
Pricing options include single-user, multi-user, and enterprise licenses priced at USD 4750, USD 5250, and USD 8750 respectively.
10. Is the market size provided in terms of value or volume?
The market size is provided in terms of value, measured in billion and volume, measured in K Tons.
11. Are there any specific market keywords associated with the report?
Yes, the market keyword associated with the report is "High-Performance Polyamides Industry," which aids in identifying and referencing the specific market segment covered.
12. How do I determine which pricing option suits my needs best?
The pricing options vary based on user requirements and access needs. Individual users may opt for single-user licenses, while businesses requiring broader access may choose multi-user or enterprise licenses for cost-effective access to the report.
13. Are there any additional resources or data provided in the High-Performance Polyamides Industry report?
While the report offers comprehensive insights, it's advisable to review the specific contents or supplementary materials provided to ascertain if additional resources or data are available.
14. How can I stay updated on further developments or reports in the High-Performance Polyamides Industry?
To stay informed about further developments, trends, and reports in the High-Performance Polyamides Industry, consider subscribing to industry newsletters, following relevant companies and organizations, or regularly checking reputable industry news sources and publications.
Methodology
Step 1 - Identification of Relevant Samples Size from Population Database


Step 2 - Approaches for Defining Global Market Size (Value, Volume* & Price*)

Note*: In applicable scenarios
Step 3 - Data Sources
Primary Research
- Web Analytics
- Survey Reports
- Research Institute
- Latest Research Reports
- Opinion Leaders
Secondary Research
- Annual Reports
- White Paper
- Latest Press Release
- Industry Association
- Paid Database
- Investor Presentations

Step 4 - Data Triangulation
Involves using different sources of information in order to increase the validity of a study
These sources are likely to be stakeholders in a program - participants, other researchers, program staff, other community members, and so on.
Then we put all data in single framework & apply various statistical tools to find out the dynamic on the market.
During the analysis stage, feedback from the stakeholder groups would be compared to determine areas of agreement as well as areas of divergence