

Key Insights
The high-performance foam market is experiencing robust growth, projected to maintain a Compound Annual Growth Rate (CAGR) exceeding 8% from 2025 to 2033. This expansion is driven by increasing demand across diverse sectors, notably construction (insulation, lightweighting), transportation (automotive, aerospace – noise reduction, lightweight components), and electrical & electronics (packaging, thermal management). Technological advancements leading to enhanced material properties, like improved thermal insulation, sound absorption, and lightweighting capabilities, are further fueling market growth. The market is segmented by material type (silicone, polyurethane, polyamide, polyethylene, and others) and end-user industry, with polyurethane and silicone foams currently holding significant market share due to their versatility and performance characteristics. Growth is anticipated to be particularly strong in the Asia-Pacific region, driven by rapid infrastructure development and industrialization in countries like China and India. However, factors such as fluctuating raw material prices and environmental concerns related to certain foam types pose challenges to sustained growth. Competition among established players like Solvay, Saint-Gobain, and BASF, along with emerging companies, is intensifying, driving innovation and potentially leading to price reductions and wider market accessibility.
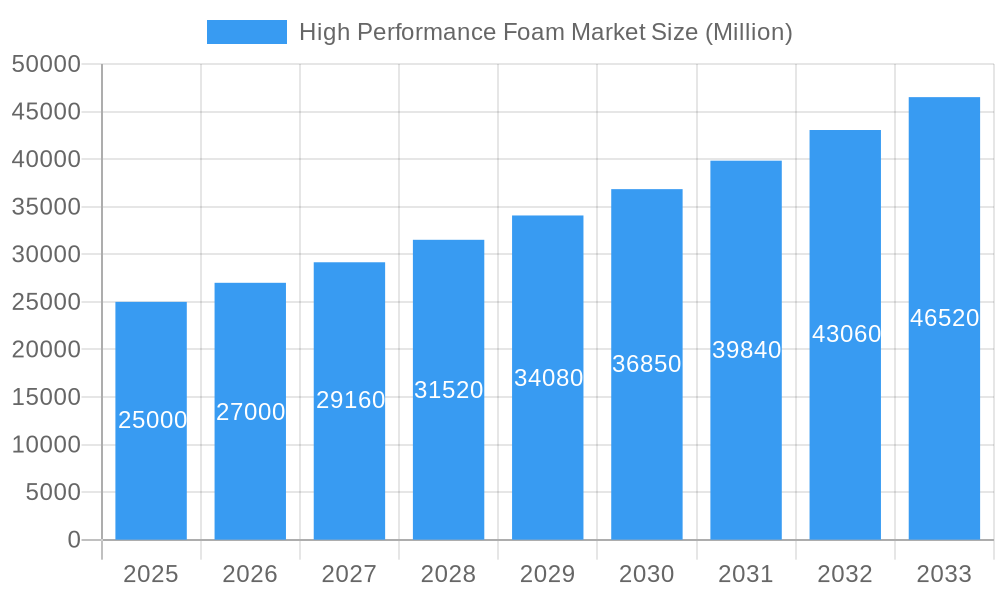
High Performance Foam Market Market Size (In Billion)
The significant market size (estimated at $XX billion in 2025) reflects the broad application of high-performance foams. The ongoing shift toward sustainable materials and manufacturing processes will influence future market trends. Regulatory pressures promoting energy efficiency and reduced environmental impact are likely to accelerate adoption of eco-friendly foam alternatives. Furthermore, research and development efforts focused on creating foams with even higher performance characteristics, coupled with improved manufacturing techniques, will contribute significantly to future market dynamics. The market’s geographical distribution is expected to remain diversified, with North America and Europe maintaining substantial market share alongside the rapidly expanding Asian markets. The long-term outlook for the high-performance foam market remains positive, with continued growth driven by technological innovation, expanding applications, and rising demand across various sectors.
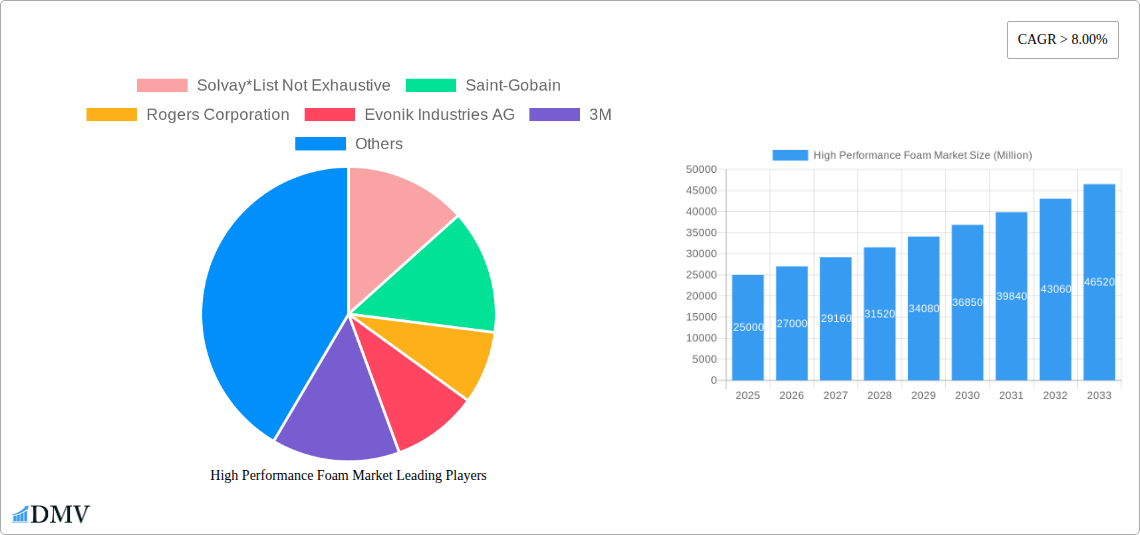
High Performance Foam Market Company Market Share
High Performance Foam Market: A Comprehensive Report (2019-2033)
This insightful report provides a detailed analysis of the High Performance Foam Market, offering a comprehensive overview of market dynamics, trends, and future prospects. The study period spans from 2019 to 2033, with 2025 serving as the base and estimated year. The report utilizes rigorous research methodologies to provide stakeholders with actionable intelligence for strategic decision-making. The global High Performance Foam market is projected to reach xx Million by 2033.
High Performance Foam Market Composition & Trends
The High Performance Foam market is characterized by a moderately concentrated landscape, with key players such as Solvay, Saint-Gobain, Rogers Corporation, Evonik Industries AG, 3M, Armacell, BASF SE, SABIC, DuPont, Zotefoams Plc, and Sekisui Alveo holding significant market share. Market share distribution varies across different foam types and end-use industries. Innovation is driven by the need for lighter, stronger, and more sustainable materials, particularly in the transportation and construction sectors. Stringent environmental regulations are pushing manufacturers to develop eco-friendly foams with reduced carbon footprints. Substitute materials, such as advanced composites, pose a competitive threat, although the unique properties of high-performance foams, such as superior insulation and shock absorption, maintain their market position. End-user profiles are diverse, encompassing construction, transportation, electrical & electronics, packaging, and healthcare sectors. M&A activity within the industry has been moderate, with deal values averaging approximately xx Million per transaction over the past five years (2019-2024).
- Market Concentration: Moderately concentrated, with top 10 players holding approximately xx% market share in 2024.
- Innovation Catalysts: Lightweighting, sustainability, enhanced performance characteristics.
- Regulatory Landscape: Increasingly stringent environmental regulations driving innovation in sustainable foams.
- Substitute Products: Advanced composites represent a growing competitive threat.
- End-User Profiles: Diverse, with significant presence in construction, transportation, and electronics.
- M&A Activity: Moderate activity, with average deal values around xx Million.
High Performance Foam Market Industry Evolution
The High Performance Foam market has experienced consistent growth over the historical period (2019-2024), driven by increasing demand from various end-use sectors. The construction industry’s expansion, particularly in developing economies, has significantly boosted demand for insulation foams. Advancements in polyurethane and silicone foam technologies have led to lighter, stronger, and more versatile products. Technological innovations, such as the development of nanomaterials and bio-based foams, are shaping future growth trajectories. Consumer demand for sustainable and eco-friendly materials is growing, prompting manufacturers to adopt sustainable manufacturing practices and develop bio-based alternatives. The market is witnessing a shift towards specialized foams with enhanced properties for niche applications, like aerospace and medical devices. The CAGR for the historical period (2019-2024) was approximately xx%, and the forecast period (2025-2033) is projected to see a CAGR of xx%. Adoption of new foam types is increasing steadily, with polyurethane and silicone foams maintaining their leading positions.
Leading Regions, Countries, or Segments in High Performance Foam Market
North America and Europe currently dominate the High Performance Foam market, driven by robust construction and automotive sectors and strong regulatory support for energy-efficient building materials. However, Asia-Pacific is projected to witness the fastest growth in the forecast period due to rapid industrialization and urbanization. Within foam types, polyurethane maintains the largest market share owing to its versatility and cost-effectiveness. In end-user industries, the construction sector demonstrates the highest demand, followed by the transportation and electronics sectors.
- Key Drivers for North America & Europe: High disposable income, robust construction activities, stringent building codes.
- Key Drivers for Asia-Pacific: Rapid industrialization, urbanization, increasing automotive production.
- Dominant Foam Type: Polyurethane (versatility, cost-effectiveness).
- Dominant End-User Industry: Construction (insulation, building materials).
High Performance Foam Market Product Innovations
Recent innovations in high-performance foams include the development of closed-cell foams with superior insulation properties, and the introduction of bio-based foams derived from renewable resources. These innovations aim to reduce environmental impact while maintaining or improving performance metrics such as compressive strength, thermal conductivity, and acoustic absorption. Unique selling propositions include improved fire resistance, lightweighting capabilities, and enhanced durability. Technological advancements focus on optimizing foam formulations for specific applications, resulting in customized materials with superior performance characteristics.
Propelling Factors for High Performance Foam Market Growth
Several factors are driving the growth of the High Performance Foam market. Technological advancements leading to improved material properties are a key driver. Economic growth in developing nations is boosting demand across various sectors, particularly construction and transportation. Stringent environmental regulations are pushing manufacturers to adopt eco-friendly production processes and develop sustainable products. The increasing adoption of high-performance foams in various end-user industries is a pivotal factor pushing market growth.
Obstacles in the High Performance Foam Market
The High Performance Foam market faces several challenges. Fluctuations in raw material prices can impact production costs and profitability. Supply chain disruptions due to geopolitical instability or natural disasters can create significant challenges. Intense competition from established players and emerging new entrants puts pressure on pricing and margins. Regulatory hurdles related to environmental and safety standards can increase compliance costs.
Future Opportunities in High Performance Foam Market
Future opportunities lie in the development of novel foam types with enhanced performance and sustainability features. Expansion into new markets, such as aerospace and renewable energy, presents significant growth potential. The growing demand for lightweight and energy-efficient materials in various industries will drive innovation and adoption of high-performance foams. Consumer preference for sustainable and environmentally friendly products will further fuel demand for bio-based and recycled content foams.
Key Developments in High Performance Foam Market Industry
- January 2023: Solvay launched a new generation of high-performance polyurethane foam with enhanced thermal insulation properties.
- June 2022: BASF announced a strategic partnership to develop sustainable bio-based polyurethane foams.
- November 2021: 3M acquired a smaller foam manufacturer to expand its product portfolio. (Further details require additional research.)
Strategic High Performance Foam Market Forecast
The High Performance Foam market is poised for significant growth over the forecast period (2025-2033), driven by technological innovation, increasing demand from various end-user sectors, and the growing focus on sustainability. New product developments, particularly in bio-based and recycled content foams, will be a key driver of future growth. Expanding into new high-growth markets and adopting sustainable manufacturing practices will be essential for success in this dynamic market. The market's growth trajectory is expected to remain robust, driven by continued innovation and increased adoption across diverse applications.
High Performance Foam Market Segmentation
-
1. Type
- 1.1. Silicone
- 1.2. Polyurethane
- 1.3. Polyamide
- 1.4. Polyethylene
- 1.5. Other Types
-
2. End-user Industry
- 2.1. Construction
- 2.2. Transportation
- 2.3. Electrical and Electronics
- 2.4. Packaging
- 2.5. Healthcare
- 2.6. Other End-user Industries
High Performance Foam Market Segmentation By Geography
-
1. Asia Pacific
- 1.1. China
- 1.2. India
- 1.3. Japan
- 1.4. South Korea
- 1.5. ASEAN Countries
- 1.6. Rest of Asia Pacific
-
2. North America
- 2.1. United States
- 2.2. Canada
- 2.3. Mexico
-
3. Europe
- 3.1. Germany
- 3.2. United Kingdom
- 3.3. Italy
- 3.4. France
- 3.5. Spain
- 3.6. Rest of Europe
-
4. South America
- 4.1. Brazil
- 4.2. Argentina
- 4.3. Rest of South America
-
5. Middle East and Africa
- 5.1. Saudi Arabia
- 5.2. South Africa
- 5.3. Rest of Middle East and Africa
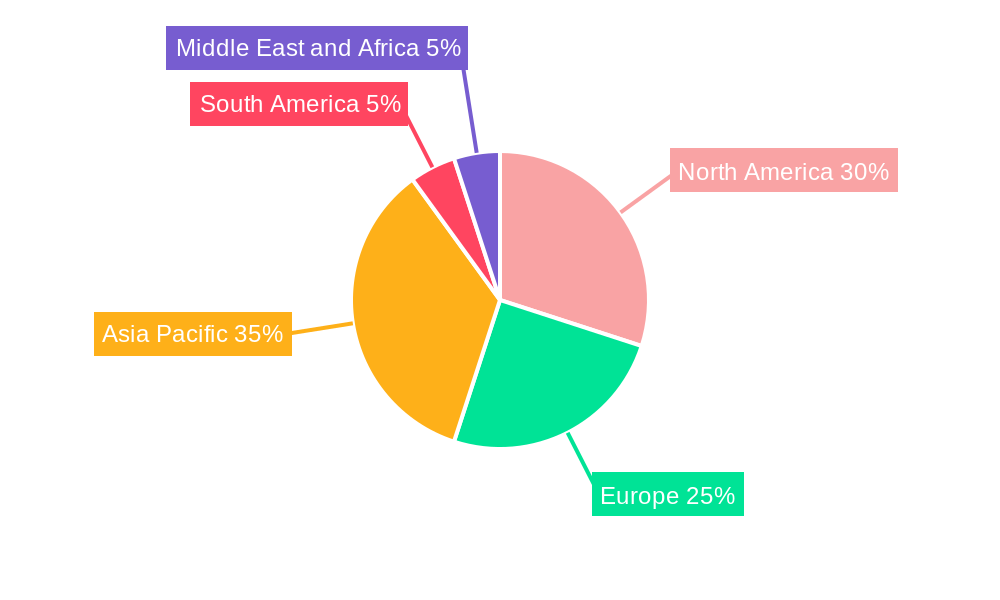
High Performance Foam Market Regional Market Share
Geographic Coverage of High Performance Foam Market
High Performance Foam Market REPORT HIGHLIGHTS
| Aspects | Details |
|---|---|
| Study Period | 2020-2034 |
| Base Year | 2025 |
| Estimated Year | 2026 |
| Forecast Period | 2026-2034 |
| Historical Period | 2020-2025 |
| Growth Rate | CAGR of > 8.00% from 2020-2034 |
| Segmentation |
|
Table of Contents
- 1. Introduction
- 1.1. Research Scope
- 1.2. Market Segmentation
- 1.3. Research Objective
- 1.4. Definitions and Assumptions
- 2. Executive Summary
- 2.1. Market Snapshot
- 3. Market Dynamics
- 3.1. Market Drivers
- 3.2. Market Restrains
- 3.3. Market Trends
- 3.4. Market Opportunities
- 4. Market Factor Analysis
- 4.1. Porters Five Forces
- 4.1.1. Bargaining Power of Suppliers
- 4.1.2. Bargaining Power of Buyers
- 4.1.3. Threat of New Entrants
- 4.1.4. Threat of Substitutes
- 4.1.5. Competitive Rivalry
- 4.2. PESTEL analysis
- 4.3. BCG Analysis
- 4.3.1. Stars (High Growth, High Market Share)
- 4.3.2. Cash Cows (Low Growth, High Market Share)
- 4.3.3. Question Mark (High Growth, Low Market Share)
- 4.3.4. Dogs (Low Growth, Low Market Share)
- 4.4. Ansoff Matrix Analysis
- 4.5. Supply Chain Analysis
- 4.6. Regulatory Landscape
- 4.7. Current Market Potential and Opportunity Assessment (TAM–SAM–SOM Framework)
- 4.8. DMV Analyst Note
- 4.1. Porters Five Forces
- 5. Market Analysis, Insights and Forecast 2021-2033
- 5.1. Market Analysis, Insights and Forecast - by Type
- 5.1.1. Silicone
- 5.1.2. Polyurethane
- 5.1.3. Polyamide
- 5.1.4. Polyethylene
- 5.1.5. Other Types
- 5.2. Market Analysis, Insights and Forecast - by End-user Industry
- 5.2.1. Construction
- 5.2.2. Transportation
- 5.2.3. Electrical and Electronics
- 5.2.4. Packaging
- 5.2.5. Healthcare
- 5.2.6. Other End-user Industries
- 5.3. Market Analysis, Insights and Forecast - by Region
- 5.3.1. Asia Pacific
- 5.3.2. North America
- 5.3.3. Europe
- 5.3.4. South America
- 5.3.5. Middle East and Africa
- 5.1. Market Analysis, Insights and Forecast - by Type
- 6. Global High Performance Foam Market Analysis, Insights and Forecast, 2021-2033
- 6.1. Market Analysis, Insights and Forecast - by Type
- 6.1.1. Silicone
- 6.1.2. Polyurethane
- 6.1.3. Polyamide
- 6.1.4. Polyethylene
- 6.1.5. Other Types
- 6.2. Market Analysis, Insights and Forecast - by End-user Industry
- 6.2.1. Construction
- 6.2.2. Transportation
- 6.2.3. Electrical and Electronics
- 6.2.4. Packaging
- 6.2.5. Healthcare
- 6.2.6. Other End-user Industries
- 6.1. Market Analysis, Insights and Forecast - by Type
- 7. Asia Pacific High Performance Foam Market Analysis, Insights and Forecast, 2020-2032
- 7.1. Market Analysis, Insights and Forecast - by Type
- 7.1.1. Silicone
- 7.1.2. Polyurethane
- 7.1.3. Polyamide
- 7.1.4. Polyethylene
- 7.1.5. Other Types
- 7.2. Market Analysis, Insights and Forecast - by End-user Industry
- 7.2.1. Construction
- 7.2.2. Transportation
- 7.2.3. Electrical and Electronics
- 7.2.4. Packaging
- 7.2.5. Healthcare
- 7.2.6. Other End-user Industries
- 7.1. Market Analysis, Insights and Forecast - by Type
- 8. North America High Performance Foam Market Analysis, Insights and Forecast, 2020-2032
- 8.1. Market Analysis, Insights and Forecast - by Type
- 8.1.1. Silicone
- 8.1.2. Polyurethane
- 8.1.3. Polyamide
- 8.1.4. Polyethylene
- 8.1.5. Other Types
- 8.2. Market Analysis, Insights and Forecast - by End-user Industry
- 8.2.1. Construction
- 8.2.2. Transportation
- 8.2.3. Electrical and Electronics
- 8.2.4. Packaging
- 8.2.5. Healthcare
- 8.2.6. Other End-user Industries
- 8.1. Market Analysis, Insights and Forecast - by Type
- 9. Europe High Performance Foam Market Analysis, Insights and Forecast, 2020-2032
- 9.1. Market Analysis, Insights and Forecast - by Type
- 9.1.1. Silicone
- 9.1.2. Polyurethane
- 9.1.3. Polyamide
- 9.1.4. Polyethylene
- 9.1.5. Other Types
- 9.2. Market Analysis, Insights and Forecast - by End-user Industry
- 9.2.1. Construction
- 9.2.2. Transportation
- 9.2.3. Electrical and Electronics
- 9.2.4. Packaging
- 9.2.5. Healthcare
- 9.2.6. Other End-user Industries
- 9.1. Market Analysis, Insights and Forecast - by Type
- 10. South America High Performance Foam Market Analysis, Insights and Forecast, 2020-2032
- 10.1. Market Analysis, Insights and Forecast - by Type
- 10.1.1. Silicone
- 10.1.2. Polyurethane
- 10.1.3. Polyamide
- 10.1.4. Polyethylene
- 10.1.5. Other Types
- 10.2. Market Analysis, Insights and Forecast - by End-user Industry
- 10.2.1. Construction
- 10.2.2. Transportation
- 10.2.3. Electrical and Electronics
- 10.2.4. Packaging
- 10.2.5. Healthcare
- 10.2.6. Other End-user Industries
- 10.1. Market Analysis, Insights and Forecast - by Type
- 11. Middle East and Africa High Performance Foam Market Analysis, Insights and Forecast, 2020-2032
- 11.1. Market Analysis, Insights and Forecast - by Type
- 11.1.1. Silicone
- 11.1.2. Polyurethane
- 11.1.3. Polyamide
- 11.1.4. Polyethylene
- 11.1.5. Other Types
- 11.2. Market Analysis, Insights and Forecast - by End-user Industry
- 11.2.1. Construction
- 11.2.2. Transportation
- 11.2.3. Electrical and Electronics
- 11.2.4. Packaging
- 11.2.5. Healthcare
- 11.2.6. Other End-user Industries
- 11.1. Market Analysis, Insights and Forecast - by Type
- 12. Competitive Analysis
- 12.1. Company Profiles
- 12.1.1 Solvay*List Not Exhaustive
- 12.1.1.1. Company Overview
- 12.1.1.2. Products
- 12.1.1.3. Company Financials
- 12.1.1.4. SWOT Analysis
- 12.1.2 Saint-Gobain
- 12.1.2.1. Company Overview
- 12.1.2.2. Products
- 12.1.2.3. Company Financials
- 12.1.2.4. SWOT Analysis
- 12.1.3 Rogers Corporation
- 12.1.3.1. Company Overview
- 12.1.3.2. Products
- 12.1.3.3. Company Financials
- 12.1.3.4. SWOT Analysis
- 12.1.4 Evonik Industries AG
- 12.1.4.1. Company Overview
- 12.1.4.2. Products
- 12.1.4.3. Company Financials
- 12.1.4.4. SWOT Analysis
- 12.1.5 3M
- 12.1.5.1. Company Overview
- 12.1.5.2. Products
- 12.1.5.3. Company Financials
- 12.1.5.4. SWOT Analysis
- 12.1.6 Armacell
- 12.1.6.1. Company Overview
- 12.1.6.2. Products
- 12.1.6.3. Company Financials
- 12.1.6.4. SWOT Analysis
- 12.1.7 BASF SE
- 12.1.7.1. Company Overview
- 12.1.7.2. Products
- 12.1.7.3. Company Financials
- 12.1.7.4. SWOT Analysis
- 12.1.8 SABIC
- 12.1.8.1. Company Overview
- 12.1.8.2. Products
- 12.1.8.3. Company Financials
- 12.1.8.4. SWOT Analysis
- 12.1.9 DuPont
- 12.1.9.1. Company Overview
- 12.1.9.2. Products
- 12.1.9.3. Company Financials
- 12.1.9.4. SWOT Analysis
- 12.1.10 Zotefoams Plc
- 12.1.10.1. Company Overview
- 12.1.10.2. Products
- 12.1.10.3. Company Financials
- 12.1.10.4. SWOT Analysis
- 12.1.11 Sekisui Alveo
- 12.1.11.1. Company Overview
- 12.1.11.2. Products
- 12.1.11.3. Company Financials
- 12.1.11.4. SWOT Analysis
- 12.1.1 Solvay*List Not Exhaustive
- 12.2. Market Entropy
- 12.2.1 Company's Key Areas Served
- 12.2.2 Recent Developments
- 12.3. Company Market Share Analysis 2025
- 12.3.1 Top 5 Companies Market Share Analysis
- 12.3.2 Top 3 Companies Market Share Analysis
- 12.4. List of Potential Customers
- 13. Research Methodology
List of Figures
- Figure 1: Global High Performance Foam Market Revenue Breakdown (Million, %) by Region 2025 & 2033
- Figure 2: Asia Pacific High Performance Foam Market Revenue (Million), by Type 2025 & 2033
- Figure 3: Asia Pacific High Performance Foam Market Revenue Share (%), by Type 2025 & 2033
- Figure 4: Asia Pacific High Performance Foam Market Revenue (Million), by End-user Industry 2025 & 2033
- Figure 5: Asia Pacific High Performance Foam Market Revenue Share (%), by End-user Industry 2025 & 2033
- Figure 6: Asia Pacific High Performance Foam Market Revenue (Million), by Country 2025 & 2033
- Figure 7: Asia Pacific High Performance Foam Market Revenue Share (%), by Country 2025 & 2033
- Figure 8: North America High Performance Foam Market Revenue (Million), by Type 2025 & 2033
- Figure 9: North America High Performance Foam Market Revenue Share (%), by Type 2025 & 2033
- Figure 10: North America High Performance Foam Market Revenue (Million), by End-user Industry 2025 & 2033
- Figure 11: North America High Performance Foam Market Revenue Share (%), by End-user Industry 2025 & 2033
- Figure 12: North America High Performance Foam Market Revenue (Million), by Country 2025 & 2033
- Figure 13: North America High Performance Foam Market Revenue Share (%), by Country 2025 & 2033
- Figure 14: Europe High Performance Foam Market Revenue (Million), by Type 2025 & 2033
- Figure 15: Europe High Performance Foam Market Revenue Share (%), by Type 2025 & 2033
- Figure 16: Europe High Performance Foam Market Revenue (Million), by End-user Industry 2025 & 2033
- Figure 17: Europe High Performance Foam Market Revenue Share (%), by End-user Industry 2025 & 2033
- Figure 18: Europe High Performance Foam Market Revenue (Million), by Country 2025 & 2033
- Figure 19: Europe High Performance Foam Market Revenue Share (%), by Country 2025 & 2033
- Figure 20: South America High Performance Foam Market Revenue (Million), by Type 2025 & 2033
- Figure 21: South America High Performance Foam Market Revenue Share (%), by Type 2025 & 2033
- Figure 22: South America High Performance Foam Market Revenue (Million), by End-user Industry 2025 & 2033
- Figure 23: South America High Performance Foam Market Revenue Share (%), by End-user Industry 2025 & 2033
- Figure 24: South America High Performance Foam Market Revenue (Million), by Country 2025 & 2033
- Figure 25: South America High Performance Foam Market Revenue Share (%), by Country 2025 & 2033
- Figure 26: Middle East and Africa High Performance Foam Market Revenue (Million), by Type 2025 & 2033
- Figure 27: Middle East and Africa High Performance Foam Market Revenue Share (%), by Type 2025 & 2033
- Figure 28: Middle East and Africa High Performance Foam Market Revenue (Million), by End-user Industry 2025 & 2033
- Figure 29: Middle East and Africa High Performance Foam Market Revenue Share (%), by End-user Industry 2025 & 2033
- Figure 30: Middle East and Africa High Performance Foam Market Revenue (Million), by Country 2025 & 2033
- Figure 31: Middle East and Africa High Performance Foam Market Revenue Share (%), by Country 2025 & 2033
List of Tables
- Table 1: Global High Performance Foam Market Revenue Million Forecast, by Type 2020 & 2033
- Table 2: Global High Performance Foam Market Revenue Million Forecast, by End-user Industry 2020 & 2033
- Table 3: Global High Performance Foam Market Revenue Million Forecast, by Region 2020 & 2033
- Table 4: Global High Performance Foam Market Revenue Million Forecast, by Type 2020 & 2033
- Table 5: Global High Performance Foam Market Revenue Million Forecast, by End-user Industry 2020 & 2033
- Table 6: Global High Performance Foam Market Revenue Million Forecast, by Country 2020 & 2033
- Table 7: China High Performance Foam Market Revenue (Million) Forecast, by Application 2020 & 2033
- Table 8: India High Performance Foam Market Revenue (Million) Forecast, by Application 2020 & 2033
- Table 9: Japan High Performance Foam Market Revenue (Million) Forecast, by Application 2020 & 2033
- Table 10: South Korea High Performance Foam Market Revenue (Million) Forecast, by Application 2020 & 2033
- Table 11: ASEAN Countries High Performance Foam Market Revenue (Million) Forecast, by Application 2020 & 2033
- Table 12: Rest of Asia Pacific High Performance Foam Market Revenue (Million) Forecast, by Application 2020 & 2033
- Table 13: Global High Performance Foam Market Revenue Million Forecast, by Type 2020 & 2033
- Table 14: Global High Performance Foam Market Revenue Million Forecast, by End-user Industry 2020 & 2033
- Table 15: Global High Performance Foam Market Revenue Million Forecast, by Country 2020 & 2033
- Table 16: United States High Performance Foam Market Revenue (Million) Forecast, by Application 2020 & 2033
- Table 17: Canada High Performance Foam Market Revenue (Million) Forecast, by Application 2020 & 2033
- Table 18: Mexico High Performance Foam Market Revenue (Million) Forecast, by Application 2020 & 2033
- Table 19: Global High Performance Foam Market Revenue Million Forecast, by Type 2020 & 2033
- Table 20: Global High Performance Foam Market Revenue Million Forecast, by End-user Industry 2020 & 2033
- Table 21: Global High Performance Foam Market Revenue Million Forecast, by Country 2020 & 2033
- Table 22: Germany High Performance Foam Market Revenue (Million) Forecast, by Application 2020 & 2033
- Table 23: United Kingdom High Performance Foam Market Revenue (Million) Forecast, by Application 2020 & 2033
- Table 24: Italy High Performance Foam Market Revenue (Million) Forecast, by Application 2020 & 2033
- Table 25: France High Performance Foam Market Revenue (Million) Forecast, by Application 2020 & 2033
- Table 26: Spain High Performance Foam Market Revenue (Million) Forecast, by Application 2020 & 2033
- Table 27: Rest of Europe High Performance Foam Market Revenue (Million) Forecast, by Application 2020 & 2033
- Table 28: Global High Performance Foam Market Revenue Million Forecast, by Type 2020 & 2033
- Table 29: Global High Performance Foam Market Revenue Million Forecast, by End-user Industry 2020 & 2033
- Table 30: Global High Performance Foam Market Revenue Million Forecast, by Country 2020 & 2033
- Table 31: Brazil High Performance Foam Market Revenue (Million) Forecast, by Application 2020 & 2033
- Table 32: Argentina High Performance Foam Market Revenue (Million) Forecast, by Application 2020 & 2033
- Table 33: Rest of South America High Performance Foam Market Revenue (Million) Forecast, by Application 2020 & 2033
- Table 34: Global High Performance Foam Market Revenue Million Forecast, by Type 2020 & 2033
- Table 35: Global High Performance Foam Market Revenue Million Forecast, by End-user Industry 2020 & 2033
- Table 36: Global High Performance Foam Market Revenue Million Forecast, by Country 2020 & 2033
- Table 37: Saudi Arabia High Performance Foam Market Revenue (Million) Forecast, by Application 2020 & 2033
- Table 38: South Africa High Performance Foam Market Revenue (Million) Forecast, by Application 2020 & 2033
- Table 39: Rest of Middle East and Africa High Performance Foam Market Revenue (Million) Forecast, by Application 2020 & 2033
Frequently Asked Questions
1. What is the projected Compound Annual Growth Rate (CAGR) of the High Performance Foam Market?
The projected CAGR is approximately > 8.00%.
2. Which companies are prominent players in the High Performance Foam Market?
Key companies in the market include Solvay*List Not Exhaustive, Saint-Gobain, Rogers Corporation, Evonik Industries AG, 3M, Armacell, BASF SE, SABIC, DuPont, Zotefoams Plc, Sekisui Alveo.
3. What are the main segments of the High Performance Foam Market?
The market segments include Type, End-user Industry.
4. Can you provide details about the market size?
The market size is estimated to be USD XX Million as of 2022.
5. What are some drivers contributing to market growth?
; Increasing Usage in the Automotive Industry; Increasing Demand from Healthcare Sector for Dressing Wounds.
6. What are the notable trends driving market growth?
Increasing Usage in the Automotive Industry.
7. Are there any restraints impacting market growth?
; High Initial Investment; Impact of COVID-19 Pandemic.
8. Can you provide examples of recent developments in the market?
N/A
9. What pricing options are available for accessing the report?
Pricing options include single-user, multi-user, and enterprise licenses priced at USD 4750, USD 5250, and USD 8750 respectively.
10. Is the market size provided in terms of value or volume?
The market size is provided in terms of value, measured in Million.
11. Are there any specific market keywords associated with the report?
Yes, the market keyword associated with the report is "High Performance Foam Market," which aids in identifying and referencing the specific market segment covered.
12. How do I determine which pricing option suits my needs best?
The pricing options vary based on user requirements and access needs. Individual users may opt for single-user licenses, while businesses requiring broader access may choose multi-user or enterprise licenses for cost-effective access to the report.
13. Are there any additional resources or data provided in the High Performance Foam Market report?
While the report offers comprehensive insights, it's advisable to review the specific contents or supplementary materials provided to ascertain if additional resources or data are available.
14. How can I stay updated on further developments or reports in the High Performance Foam Market?
To stay informed about further developments, trends, and reports in the High Performance Foam Market, consider subscribing to industry newsletters, following relevant companies and organizations, or regularly checking reputable industry news sources and publications.
Methodology
Step 1 - Identification of Relevant Samples Size from Population Database


Step 2 - Approaches for Defining Global Market Size (Value, Volume* & Price*)

Note*: In applicable scenarios
Step 3 - Data Sources
Primary Research
- Web Analytics
- Survey Reports
- Research Institute
- Latest Research Reports
- Opinion Leaders
Secondary Research
- Annual Reports
- White Paper
- Latest Press Release
- Industry Association
- Paid Database
- Investor Presentations

Step 4 - Data Triangulation
Involves using different sources of information in order to increase the validity of a study
These sources are likely to be stakeholders in a program - participants, other researchers, program staff, other community members, and so on.
Then we put all data in single framework & apply various statistical tools to find out the dynamic on the market.
During the analysis stage, feedback from the stakeholder groups would be compared to determine areas of agreement as well as areas of divergence