

Key Insights
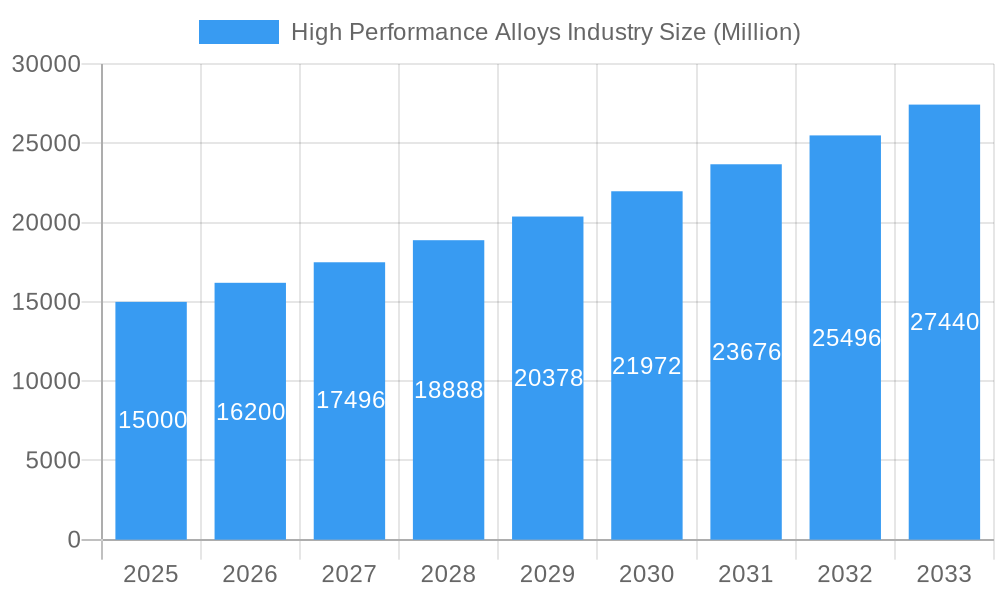
The High Performance Alloys market is poised for significant expansion, driven by escalating demand in critical sectors including aerospace, automotive, energy, and medical. Following a period of notable growth between 2019 and 2024, the market is projected to reach a size of 11.64 billion in the base year 2025, with a Compound Annual Growth Rate (CAGR) of 3.72% anticipated through 2033. This growth trajectory is underpinned by the increasing adoption of high-performance alloys in lightweighting initiatives, enhancing fuel efficiency in transportation, and their critical role in advanced energy generation systems demanding superior heat and pressure resistance. The burgeoning medical device industry also contributes significantly, requiring biocompatible and high-strength alloy solutions. Continued technological advancements promise the development of novel alloys with enhanced strength, reduced weight, and superior corrosion resistance, further broadening application scope.
High Performance Alloys Industry Market Size (In Billion)
Key drivers influencing the High Performance Alloys market's CAGR of 3.72% from 2025 to 2033 include governmental investments in sustainable technologies and infrastructure, alongside intensified research and development efforts focused on innovative alloy compositions and manufacturing processes. Rising consumer preferences for durable, high-performance products will also contribute to market expansion. Geographically, North America and Europe are expected to retain substantial market shares owing to established industrial bases and technological leadership. However, the Asia-Pacific region is set to experience rapid growth, fueled by industrialization and economic development. The market features a competitive landscape with both established multinational corporations and specialized niche players, fostering continuous innovation.
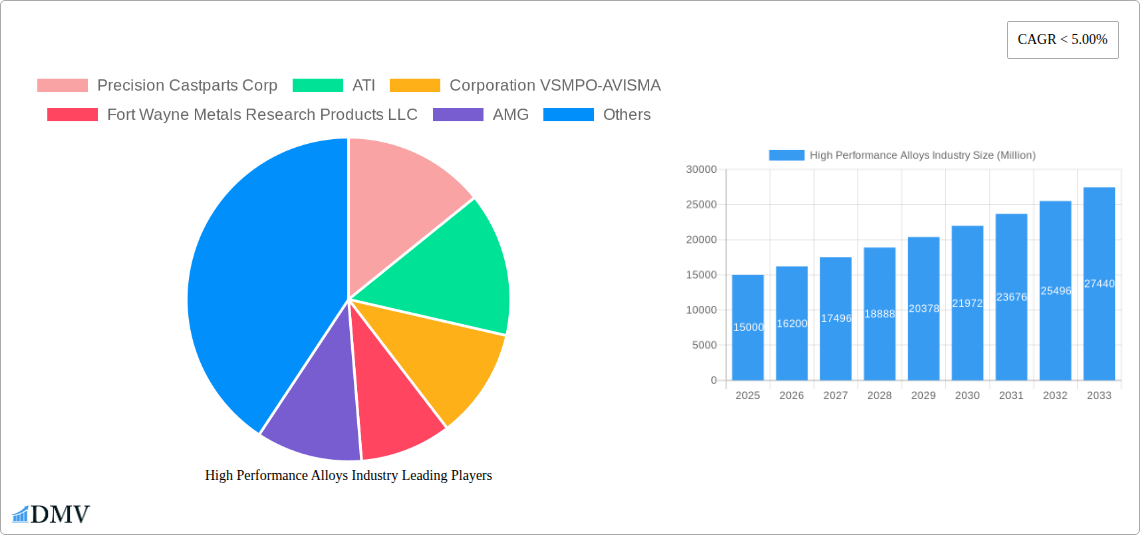
High Performance Alloys Industry Company Market Share
This comprehensive market analysis forecasts robust growth for High Performance Alloys from 2025 to 2033, offering critical insights for stakeholders navigating this dynamic sector. The study encompasses the period from 2019 to 2033, with 2025 designated as the base year for market size estimations.
High Performance Alloys Industry Market Composition & Trends
This section delves into the competitive landscape of the high-performance alloys market, evaluating market concentration, innovation drivers, regulatory influences, substitute materials, end-user profiles, and mergers & acquisitions (M&A) activity. The market is characterized by a moderately concentrated structure, with key players such as Precision Castparts Corp, ATI, Corporation VSMPO-AVISMA, Fort Wayne Metals Research Products LLC, AMG, High Performance Alloys Inc, Stanford Advanced Materials, Nippon Yakin Kogyo Co Ltd, and CRS Holdings Inc holding significant market share. However, the market is also witnessing increasing competition from new entrants and innovative materials. The report estimates the market share distribution among these key players to be approximately xx Million in 2025, with a projected xx% growth by 2033. M&A activity within the industry has been significant, with deal values exceeding xx Million in recent years, primarily driven by consolidation efforts and expansion into new markets.
- Market Concentration: Moderately concentrated, with several dominant players.
- Innovation Catalysts: Advancements in additive manufacturing, development of novel alloys with enhanced properties.
- Regulatory Landscape: Stringent safety and environmental regulations influence material selection and manufacturing processes.
- Substitute Products: Competition from alternative materials with comparable properties, including composites and ceramics.
- End-User Profiles: Primarily focused on aerospace, power generation, oil & gas, and automotive industries.
- M&A Activity: Significant M&A activity, driven by consolidation and market expansion.
High Performance Alloys Industry Industry Evolution
The high-performance alloys market has witnessed substantial growth over the past five years (2019-2024), driven by the increasing demand from diverse end-user industries. The aerospace sector, specifically, has been a significant driver of growth due to the increasing demand for lightweight and high-strength materials in aircraft and spacecraft. The market experienced a Compound Annual Growth Rate (CAGR) of xx% during the historical period (2019-2024). Technological advancements, particularly in additive manufacturing, have enabled the production of complex components with improved performance characteristics, pushing the adoption of high-performance alloys. Furthermore, shifting consumer preferences towards lighter, more fuel-efficient vehicles and increased sustainability concerns have influenced the demand for high-performance alloys in the automotive sector. We project a CAGR of xx% for the forecast period (2025-2033), reaching a market value of xx Million by 2033. The adoption rate of additive manufacturing technologies for high-performance alloy production is estimated to increase from xx% in 2025 to xx% by 2033.
Leading Regions, Countries, or Segments in High Performance Alloys Industry
The report identifies North America and Europe as the leading regions for high-performance alloys, driven by robust aerospace and automotive industries. Within these regions, the United States and Germany, respectively, hold the most significant market share. The aerospace sector remains the dominant end-user industry, followed by power generation and oil & gas. Among base metal types, Nickel and Titanium alloys dominate due to their superior strength and corrosion resistance. Heat-resistant alloys are the leading product type, driven by high demand from the aerospace and power generation sectors.
- Key Drivers (North America): Strong aerospace industry, substantial R&D investments, supportive government policies.
- Key Drivers (Europe): Robust automotive and power generation sectors, advanced manufacturing capabilities, skilled workforce.
- Key Drivers (Nickel Alloys): Superior strength, corrosion resistance, high-temperature performance.
- Key Drivers (Titanium Alloys): High strength-to-weight ratio, excellent corrosion resistance, applications in aerospace.
- Key Drivers (Heat Resistant Alloys): Essential for high-temperature applications in aerospace and power generation.
High Performance Alloys Industry Product Innovations
Recent years have witnessed significant product innovation in high-performance alloys, driven by advancements in materials science and manufacturing technologies. The introduction of alloys with enhanced strength, corrosion resistance, and high-temperature capabilities caters to the growing needs of diverse end-user industries. Additive manufacturing technologies have further accelerated innovation, enabling the production of complex geometries and customized alloy compositions for specific applications. These advancements offer unique selling propositions, such as reduced weight, improved durability, and enhanced performance, contributing to the overall growth of the high-performance alloys market.
Propelling Factors for High Performance Alloys Industry Growth
Growth in the high-performance alloys industry is driven by several factors. Technological advancements in material science and additive manufacturing enable the creation of alloys with superior properties. Increased demand from key end-user sectors, notably aerospace and energy, fuels market expansion. Stringent regulations emphasizing material efficiency and environmental sustainability incentivize the use of high-performance alloys. Finally, global economic growth and infrastructure development contribute to increasing demand for these advanced materials.
Obstacles in the High Performance Alloys Industry Market
Challenges include volatile raw material prices, impacting production costs and profitability. Supply chain disruptions, particularly those affecting rare earth elements crucial for certain alloy compositions, pose significant risks. Intense competition among established players and new entrants creates pricing pressures and necessitates continuous innovation. Furthermore, stringent environmental regulations and safety standards can increase compliance costs and limit production flexibility.
Future Opportunities in High Performance Alloys Industry
Future opportunities lie in emerging applications in renewable energy technologies, such as wind turbine components and solar panels. Advancements in additive manufacturing will further broaden the scope of high-performance alloy applications. Growing demand for lightweight and high-strength materials in electric vehicles and aerospace presents significant market potential. Expansion into new geographical markets, particularly in developing economies, offers substantial growth opportunities.
Major Players in the High Performance Alloys Industry Ecosystem
- Precision Castparts Corp
- ATI
- Corporation VSMPO-AVISMA
- Fort Wayne Metals Research Products LLC
- AMG
- High Performance Alloys Inc
- Stanford Advanced Materials
- Nippon Yakin Kogyo Co Ltd
- CRS Holdings Inc
Key Developments in High Performance Alloys Industry Industry
- January 2022: Alloy Wire International (AWI) launched Inconel 617, a high-performance alloy for medical, aerospace, nuclear, and petrochemical sectors.
- January 2022: Desktop Metal introduced DM HH Stainless Steel (DM HH-SS), a high-strength and hardness alloy for additive manufacturing, targeting oil & gas, automotive, and medical devices.
- December 2022: SLM Solutions partnered with Elementum 3D to produce high-performance parts using additive manufacturing for aerospace and space applications.
Strategic High Performance Alloys Industry Market Forecast
The high-performance alloys market is poised for continued growth, driven by technological advancements, increasing demand from key end-user sectors, and expanding applications in emerging industries. The forecast period (2025-2033) anticipates significant market expansion, with opportunities for innovation and market leadership. Continued investment in research and development, coupled with strategic partnerships and acquisitions, will shape the industry's future trajectory.
High Performance Alloys Industry Segmentation
-
1. Base Metal Type
- 1.1. Aluminum
- 1.2. Nickel
- 1.3. Steel
- 1.4. Magnesium
- 1.5. Titanium
- 1.6. Other Base Metal Types
-
2. Product Type
- 2.1. Heat Resistant Alloys
- 2.2. Corrosion Resistant Alloys
- 2.3. Wear Resistant Alloys
- 2.4. Other Product Types
-
3. End-user Industry
- 3.1. Aerospace
- 3.2. Power
- 3.3. Oil and Gas (including Chemical)
- 3.4. Electrical and Electronics
- 3.5. Automotive
- 3.6. Other End-user Industries
High Performance Alloys Industry Segmentation By Geography
-
1. Asia Pacific
- 1.1. China
- 1.2. India
- 1.3. Japan
- 1.4. South Korea
- 1.5. Rest of Asia Pacific
-
2. North America
- 2.1. United States
- 2.2. Canada
- 2.3. Mexico
-
3. Europe
- 3.1. United Kingdom
- 3.2. France
- 3.3. Germany
- 3.4. Italy
- 3.5. Rest of Europe
-
4. Rest of the World
- 4.1. South America
- 4.2. Middle East and Africa

High Performance Alloys Industry Regional Market Share
Geographic Coverage of High Performance Alloys Industry
High Performance Alloys Industry REPORT HIGHLIGHTS
| Aspects | Details |
|---|---|
| Study Period | 2020-2034 |
| Base Year | 2025 |
| Estimated Year | 2026 |
| Forecast Period | 2026-2034 |
| Historical Period | 2020-2025 |
| Growth Rate | CAGR of 3.72% from 2020-2034 |
| Segmentation |
|
Table of Contents
- 1. Introduction
- 1.1. Research Scope
- 1.2. Market Segmentation
- 1.3. Research Objective
- 1.4. Definitions and Assumptions
- 2. Executive Summary
- 2.1. Market Snapshot
- 3. Market Dynamics
- 3.1. Market Drivers
- 3.2. Market Restrains
- 3.3. Market Trends
- 3.4. Market Opportunities
- 4. Market Factor Analysis
- 4.1. Porters Five Forces
- 4.1.1. Bargaining Power of Suppliers
- 4.1.2. Bargaining Power of Buyers
- 4.1.3. Threat of New Entrants
- 4.1.4. Threat of Substitutes
- 4.1.5. Competitive Rivalry
- 4.2. PESTEL analysis
- 4.3. BCG Analysis
- 4.3.1. Stars (High Growth, High Market Share)
- 4.3.2. Cash Cows (Low Growth, High Market Share)
- 4.3.3. Question Mark (High Growth, Low Market Share)
- 4.3.4. Dogs (Low Growth, Low Market Share)
- 4.4. Ansoff Matrix Analysis
- 4.5. Supply Chain Analysis
- 4.6. Regulatory Landscape
- 4.7. Current Market Potential and Opportunity Assessment (TAM–SAM–SOM Framework)
- 4.8. DMV Analyst Note
- 4.1. Porters Five Forces
- 5. Market Analysis, Insights and Forecast 2021-2033
- 5.1. Market Analysis, Insights and Forecast - by Base Metal Type
- 5.1.1. Aluminum
- 5.1.2. Nickel
- 5.1.3. Steel
- 5.1.4. Magnesium
- 5.1.5. Titanium
- 5.1.6. Other Base Metal Types
- 5.2. Market Analysis, Insights and Forecast - by Product Type
- 5.2.1. Heat Resistant Alloys
- 5.2.2. Corrosion Resistant Alloys
- 5.2.3. Wear Resistant Alloys
- 5.2.4. Other Product Types
- 5.3. Market Analysis, Insights and Forecast - by End-user Industry
- 5.3.1. Aerospace
- 5.3.2. Power
- 5.3.3. Oil and Gas (including Chemical)
- 5.3.4. Electrical and Electronics
- 5.3.5. Automotive
- 5.3.6. Other End-user Industries
- 5.4. Market Analysis, Insights and Forecast - by Region
- 5.4.1. Asia Pacific
- 5.4.2. North America
- 5.4.3. Europe
- 5.4.4. Rest of the World
- 5.1. Market Analysis, Insights and Forecast - by Base Metal Type
- 6. Global High Performance Alloys Industry Analysis, Insights and Forecast, 2021-2033
- 6.1. Market Analysis, Insights and Forecast - by Base Metal Type
- 6.1.1. Aluminum
- 6.1.2. Nickel
- 6.1.3. Steel
- 6.1.4. Magnesium
- 6.1.5. Titanium
- 6.1.6. Other Base Metal Types
- 6.2. Market Analysis, Insights and Forecast - by Product Type
- 6.2.1. Heat Resistant Alloys
- 6.2.2. Corrosion Resistant Alloys
- 6.2.3. Wear Resistant Alloys
- 6.2.4. Other Product Types
- 6.3. Market Analysis, Insights and Forecast - by End-user Industry
- 6.3.1. Aerospace
- 6.3.2. Power
- 6.3.3. Oil and Gas (including Chemical)
- 6.3.4. Electrical and Electronics
- 6.3.5. Automotive
- 6.3.6. Other End-user Industries
- 6.1. Market Analysis, Insights and Forecast - by Base Metal Type
- 7. Asia Pacific High Performance Alloys Industry Analysis, Insights and Forecast, 2020-2032
- 7.1. Market Analysis, Insights and Forecast - by Base Metal Type
- 7.1.1. Aluminum
- 7.1.2. Nickel
- 7.1.3. Steel
- 7.1.4. Magnesium
- 7.1.5. Titanium
- 7.1.6. Other Base Metal Types
- 7.2. Market Analysis, Insights and Forecast - by Product Type
- 7.2.1. Heat Resistant Alloys
- 7.2.2. Corrosion Resistant Alloys
- 7.2.3. Wear Resistant Alloys
- 7.2.4. Other Product Types
- 7.3. Market Analysis, Insights and Forecast - by End-user Industry
- 7.3.1. Aerospace
- 7.3.2. Power
- 7.3.3. Oil and Gas (including Chemical)
- 7.3.4. Electrical and Electronics
- 7.3.5. Automotive
- 7.3.6. Other End-user Industries
- 7.1. Market Analysis, Insights and Forecast - by Base Metal Type
- 8. North America High Performance Alloys Industry Analysis, Insights and Forecast, 2020-2032
- 8.1. Market Analysis, Insights and Forecast - by Base Metal Type
- 8.1.1. Aluminum
- 8.1.2. Nickel
- 8.1.3. Steel
- 8.1.4. Magnesium
- 8.1.5. Titanium
- 8.1.6. Other Base Metal Types
- 8.2. Market Analysis, Insights and Forecast - by Product Type
- 8.2.1. Heat Resistant Alloys
- 8.2.2. Corrosion Resistant Alloys
- 8.2.3. Wear Resistant Alloys
- 8.2.4. Other Product Types
- 8.3. Market Analysis, Insights and Forecast - by End-user Industry
- 8.3.1. Aerospace
- 8.3.2. Power
- 8.3.3. Oil and Gas (including Chemical)
- 8.3.4. Electrical and Electronics
- 8.3.5. Automotive
- 8.3.6. Other End-user Industries
- 8.1. Market Analysis, Insights and Forecast - by Base Metal Type
- 9. Europe High Performance Alloys Industry Analysis, Insights and Forecast, 2020-2032
- 9.1. Market Analysis, Insights and Forecast - by Base Metal Type
- 9.1.1. Aluminum
- 9.1.2. Nickel
- 9.1.3. Steel
- 9.1.4. Magnesium
- 9.1.5. Titanium
- 9.1.6. Other Base Metal Types
- 9.2. Market Analysis, Insights and Forecast - by Product Type
- 9.2.1. Heat Resistant Alloys
- 9.2.2. Corrosion Resistant Alloys
- 9.2.3. Wear Resistant Alloys
- 9.2.4. Other Product Types
- 9.3. Market Analysis, Insights and Forecast - by End-user Industry
- 9.3.1. Aerospace
- 9.3.2. Power
- 9.3.3. Oil and Gas (including Chemical)
- 9.3.4. Electrical and Electronics
- 9.3.5. Automotive
- 9.3.6. Other End-user Industries
- 9.1. Market Analysis, Insights and Forecast - by Base Metal Type
- 10. Rest of the World High Performance Alloys Industry Analysis, Insights and Forecast, 2020-2032
- 10.1. Market Analysis, Insights and Forecast - by Base Metal Type
- 10.1.1. Aluminum
- 10.1.2. Nickel
- 10.1.3. Steel
- 10.1.4. Magnesium
- 10.1.5. Titanium
- 10.1.6. Other Base Metal Types
- 10.2. Market Analysis, Insights and Forecast - by Product Type
- 10.2.1. Heat Resistant Alloys
- 10.2.2. Corrosion Resistant Alloys
- 10.2.3. Wear Resistant Alloys
- 10.2.4. Other Product Types
- 10.3. Market Analysis, Insights and Forecast - by End-user Industry
- 10.3.1. Aerospace
- 10.3.2. Power
- 10.3.3. Oil and Gas (including Chemical)
- 10.3.4. Electrical and Electronics
- 10.3.5. Automotive
- 10.3.6. Other End-user Industries
- 10.1. Market Analysis, Insights and Forecast - by Base Metal Type
- 11. Competitive Analysis
- 11.1. Company Profiles
- 11.1.1 Precision Castparts Corp
- 11.1.1.1. Company Overview
- 11.1.1.2. Products
- 11.1.1.3. Company Financials
- 11.1.1.4. SWOT Analysis
- 11.1.2 ATI
- 11.1.2.1. Company Overview
- 11.1.2.2. Products
- 11.1.2.3. Company Financials
- 11.1.2.4. SWOT Analysis
- 11.1.3 Corporation VSMPO-AVISMA
- 11.1.3.1. Company Overview
- 11.1.3.2. Products
- 11.1.3.3. Company Financials
- 11.1.3.4. SWOT Analysis
- 11.1.4 Fort Wayne Metals Research Products LLC
- 11.1.4.1. Company Overview
- 11.1.4.2. Products
- 11.1.4.3. Company Financials
- 11.1.4.4. SWOT Analysis
- 11.1.5 AMG
- 11.1.5.1. Company Overview
- 11.1.5.2. Products
- 11.1.5.3. Company Financials
- 11.1.5.4. SWOT Analysis
- 11.1.6 High Performance Alloys Inc
- 11.1.6.1. Company Overview
- 11.1.6.2. Products
- 11.1.6.3. Company Financials
- 11.1.6.4. SWOT Analysis
- 11.1.7 Stanford Advanced Materials*List Not Exhaustive
- 11.1.7.1. Company Overview
- 11.1.7.2. Products
- 11.1.7.3. Company Financials
- 11.1.7.4. SWOT Analysis
- 11.1.8 Nippon Yakin Kogyo Co Ltd
- 11.1.8.1. Company Overview
- 11.1.8.2. Products
- 11.1.8.3. Company Financials
- 11.1.8.4. SWOT Analysis
- 11.1.9 CRS Holdings Inc
- 11.1.9.1. Company Overview
- 11.1.9.2. Products
- 11.1.9.3. Company Financials
- 11.1.9.4. SWOT Analysis
- 11.1.1 Precision Castparts Corp
- 11.2. Market Entropy
- 11.2.1 Company's Key Areas Served
- 11.2.2 Recent Developments
- 11.3. Company Market Share Analysis 2025
- 11.3.1 Top 5 Companies Market Share Analysis
- 11.3.2 Top 3 Companies Market Share Analysis
- 11.4. List of Potential Customers
- 12. Research Methodology
List of Figures
- Figure 1: Global High Performance Alloys Industry Revenue Breakdown (billion, %) by Region 2025 & 2033
- Figure 2: Asia Pacific High Performance Alloys Industry Revenue (billion), by Base Metal Type 2025 & 2033
- Figure 3: Asia Pacific High Performance Alloys Industry Revenue Share (%), by Base Metal Type 2025 & 2033
- Figure 4: Asia Pacific High Performance Alloys Industry Revenue (billion), by Product Type 2025 & 2033
- Figure 5: Asia Pacific High Performance Alloys Industry Revenue Share (%), by Product Type 2025 & 2033
- Figure 6: Asia Pacific High Performance Alloys Industry Revenue (billion), by End-user Industry 2025 & 2033
- Figure 7: Asia Pacific High Performance Alloys Industry Revenue Share (%), by End-user Industry 2025 & 2033
- Figure 8: Asia Pacific High Performance Alloys Industry Revenue (billion), by Country 2025 & 2033
- Figure 9: Asia Pacific High Performance Alloys Industry Revenue Share (%), by Country 2025 & 2033
- Figure 10: North America High Performance Alloys Industry Revenue (billion), by Base Metal Type 2025 & 2033
- Figure 11: North America High Performance Alloys Industry Revenue Share (%), by Base Metal Type 2025 & 2033
- Figure 12: North America High Performance Alloys Industry Revenue (billion), by Product Type 2025 & 2033
- Figure 13: North America High Performance Alloys Industry Revenue Share (%), by Product Type 2025 & 2033
- Figure 14: North America High Performance Alloys Industry Revenue (billion), by End-user Industry 2025 & 2033
- Figure 15: North America High Performance Alloys Industry Revenue Share (%), by End-user Industry 2025 & 2033
- Figure 16: North America High Performance Alloys Industry Revenue (billion), by Country 2025 & 2033
- Figure 17: North America High Performance Alloys Industry Revenue Share (%), by Country 2025 & 2033
- Figure 18: Europe High Performance Alloys Industry Revenue (billion), by Base Metal Type 2025 & 2033
- Figure 19: Europe High Performance Alloys Industry Revenue Share (%), by Base Metal Type 2025 & 2033
- Figure 20: Europe High Performance Alloys Industry Revenue (billion), by Product Type 2025 & 2033
- Figure 21: Europe High Performance Alloys Industry Revenue Share (%), by Product Type 2025 & 2033
- Figure 22: Europe High Performance Alloys Industry Revenue (billion), by End-user Industry 2025 & 2033
- Figure 23: Europe High Performance Alloys Industry Revenue Share (%), by End-user Industry 2025 & 2033
- Figure 24: Europe High Performance Alloys Industry Revenue (billion), by Country 2025 & 2033
- Figure 25: Europe High Performance Alloys Industry Revenue Share (%), by Country 2025 & 2033
- Figure 26: Rest of the World High Performance Alloys Industry Revenue (billion), by Base Metal Type 2025 & 2033
- Figure 27: Rest of the World High Performance Alloys Industry Revenue Share (%), by Base Metal Type 2025 & 2033
- Figure 28: Rest of the World High Performance Alloys Industry Revenue (billion), by Product Type 2025 & 2033
- Figure 29: Rest of the World High Performance Alloys Industry Revenue Share (%), by Product Type 2025 & 2033
- Figure 30: Rest of the World High Performance Alloys Industry Revenue (billion), by End-user Industry 2025 & 2033
- Figure 31: Rest of the World High Performance Alloys Industry Revenue Share (%), by End-user Industry 2025 & 2033
- Figure 32: Rest of the World High Performance Alloys Industry Revenue (billion), by Country 2025 & 2033
- Figure 33: Rest of the World High Performance Alloys Industry Revenue Share (%), by Country 2025 & 2033
List of Tables
- Table 1: Global High Performance Alloys Industry Revenue billion Forecast, by Base Metal Type 2020 & 2033
- Table 2: Global High Performance Alloys Industry Revenue billion Forecast, by Product Type 2020 & 2033
- Table 3: Global High Performance Alloys Industry Revenue billion Forecast, by End-user Industry 2020 & 2033
- Table 4: Global High Performance Alloys Industry Revenue billion Forecast, by Region 2020 & 2033
- Table 5: Global High Performance Alloys Industry Revenue billion Forecast, by Base Metal Type 2020 & 2033
- Table 6: Global High Performance Alloys Industry Revenue billion Forecast, by Product Type 2020 & 2033
- Table 7: Global High Performance Alloys Industry Revenue billion Forecast, by End-user Industry 2020 & 2033
- Table 8: Global High Performance Alloys Industry Revenue billion Forecast, by Country 2020 & 2033
- Table 9: China High Performance Alloys Industry Revenue (billion) Forecast, by Application 2020 & 2033
- Table 10: India High Performance Alloys Industry Revenue (billion) Forecast, by Application 2020 & 2033
- Table 11: Japan High Performance Alloys Industry Revenue (billion) Forecast, by Application 2020 & 2033
- Table 12: South Korea High Performance Alloys Industry Revenue (billion) Forecast, by Application 2020 & 2033
- Table 13: Rest of Asia Pacific High Performance Alloys Industry Revenue (billion) Forecast, by Application 2020 & 2033
- Table 14: Global High Performance Alloys Industry Revenue billion Forecast, by Base Metal Type 2020 & 2033
- Table 15: Global High Performance Alloys Industry Revenue billion Forecast, by Product Type 2020 & 2033
- Table 16: Global High Performance Alloys Industry Revenue billion Forecast, by End-user Industry 2020 & 2033
- Table 17: Global High Performance Alloys Industry Revenue billion Forecast, by Country 2020 & 2033
- Table 18: United States High Performance Alloys Industry Revenue (billion) Forecast, by Application 2020 & 2033
- Table 19: Canada High Performance Alloys Industry Revenue (billion) Forecast, by Application 2020 & 2033
- Table 20: Mexico High Performance Alloys Industry Revenue (billion) Forecast, by Application 2020 & 2033
- Table 21: Global High Performance Alloys Industry Revenue billion Forecast, by Base Metal Type 2020 & 2033
- Table 22: Global High Performance Alloys Industry Revenue billion Forecast, by Product Type 2020 & 2033
- Table 23: Global High Performance Alloys Industry Revenue billion Forecast, by End-user Industry 2020 & 2033
- Table 24: Global High Performance Alloys Industry Revenue billion Forecast, by Country 2020 & 2033
- Table 25: United Kingdom High Performance Alloys Industry Revenue (billion) Forecast, by Application 2020 & 2033
- Table 26: France High Performance Alloys Industry Revenue (billion) Forecast, by Application 2020 & 2033
- Table 27: Germany High Performance Alloys Industry Revenue (billion) Forecast, by Application 2020 & 2033
- Table 28: Italy High Performance Alloys Industry Revenue (billion) Forecast, by Application 2020 & 2033
- Table 29: Rest of Europe High Performance Alloys Industry Revenue (billion) Forecast, by Application 2020 & 2033
- Table 30: Global High Performance Alloys Industry Revenue billion Forecast, by Base Metal Type 2020 & 2033
- Table 31: Global High Performance Alloys Industry Revenue billion Forecast, by Product Type 2020 & 2033
- Table 32: Global High Performance Alloys Industry Revenue billion Forecast, by End-user Industry 2020 & 2033
- Table 33: Global High Performance Alloys Industry Revenue billion Forecast, by Country 2020 & 2033
- Table 34: South America High Performance Alloys Industry Revenue (billion) Forecast, by Application 2020 & 2033
- Table 35: Middle East and Africa High Performance Alloys Industry Revenue (billion) Forecast, by Application 2020 & 2033
Frequently Asked Questions
1. What is the projected Compound Annual Growth Rate (CAGR) of the High Performance Alloys Industry?
The projected CAGR is approximately 3.72%.
2. Which companies are prominent players in the High Performance Alloys Industry?
Key companies in the market include Precision Castparts Corp, ATI, Corporation VSMPO-AVISMA, Fort Wayne Metals Research Products LLC, AMG, High Performance Alloys Inc, Stanford Advanced Materials*List Not Exhaustive, Nippon Yakin Kogyo Co Ltd, CRS Holdings Inc.
3. What are the main segments of the High Performance Alloys Industry?
The market segments include Base Metal Type, Product Type, End-user Industry.
4. Can you provide details about the market size?
The market size is estimated to be USD 11.64 billion as of 2022.
5. What are some drivers contributing to market growth?
Increasing Demand of the Alloys in the Aerospace Industry; Other Drivers.
6. What are the notable trends driving market growth?
Aerospace Industry to Dominate the Market.
7. Are there any restraints impacting market growth?
Fluctuating Pricing of Raw Materials; Other Restraints.
8. Can you provide examples of recent developments in the market?
December 2022: SLM Solutions announced its partnership with Elementum 3D to produce high-performance parts with high-quality alloys for aerospace and space customers. The collaboration between the two companies broadens the use of additive manufacturing, increases exposure for Elementum 3D materials, and enables SLM Solutions to rapidly expand the material portfolio for the NXG XII 600; therefore, the high-performance alloys from Elementum 3D will be available on SLM technology as early as 2023.
9. What pricing options are available for accessing the report?
Pricing options include single-user, multi-user, and enterprise licenses priced at USD 4750, USD 5250, and USD 8750 respectively.
10. Is the market size provided in terms of value or volume?
The market size is provided in terms of value, measured in billion.
11. Are there any specific market keywords associated with the report?
Yes, the market keyword associated with the report is "High Performance Alloys Industry," which aids in identifying and referencing the specific market segment covered.
12. How do I determine which pricing option suits my needs best?
The pricing options vary based on user requirements and access needs. Individual users may opt for single-user licenses, while businesses requiring broader access may choose multi-user or enterprise licenses for cost-effective access to the report.
13. Are there any additional resources or data provided in the High Performance Alloys Industry report?
While the report offers comprehensive insights, it's advisable to review the specific contents or supplementary materials provided to ascertain if additional resources or data are available.
14. How can I stay updated on further developments or reports in the High Performance Alloys Industry?
To stay informed about further developments, trends, and reports in the High Performance Alloys Industry, consider subscribing to industry newsletters, following relevant companies and organizations, or regularly checking reputable industry news sources and publications.
Methodology
Step 1 - Identification of Relevant Samples Size from Population Database


Step 2 - Approaches for Defining Global Market Size (Value, Volume* & Price*)

Note*: In applicable scenarios
Step 3 - Data Sources
Primary Research
- Web Analytics
- Survey Reports
- Research Institute
- Latest Research Reports
- Opinion Leaders
Secondary Research
- Annual Reports
- White Paper
- Latest Press Release
- Industry Association
- Paid Database
- Investor Presentations

Step 4 - Data Triangulation
Involves using different sources of information in order to increase the validity of a study
These sources are likely to be stakeholders in a program - participants, other researchers, program staff, other community members, and so on.
Then we put all data in single framework & apply various statistical tools to find out the dynamic on the market.
During the analysis stage, feedback from the stakeholder groups would be compared to determine areas of agreement as well as areas of divergence