

Key Insights
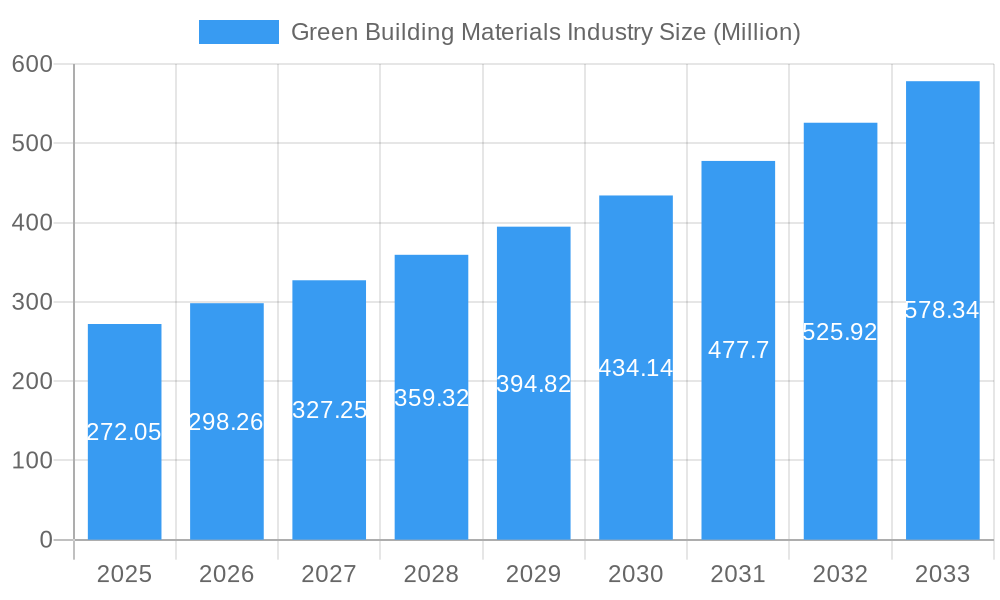
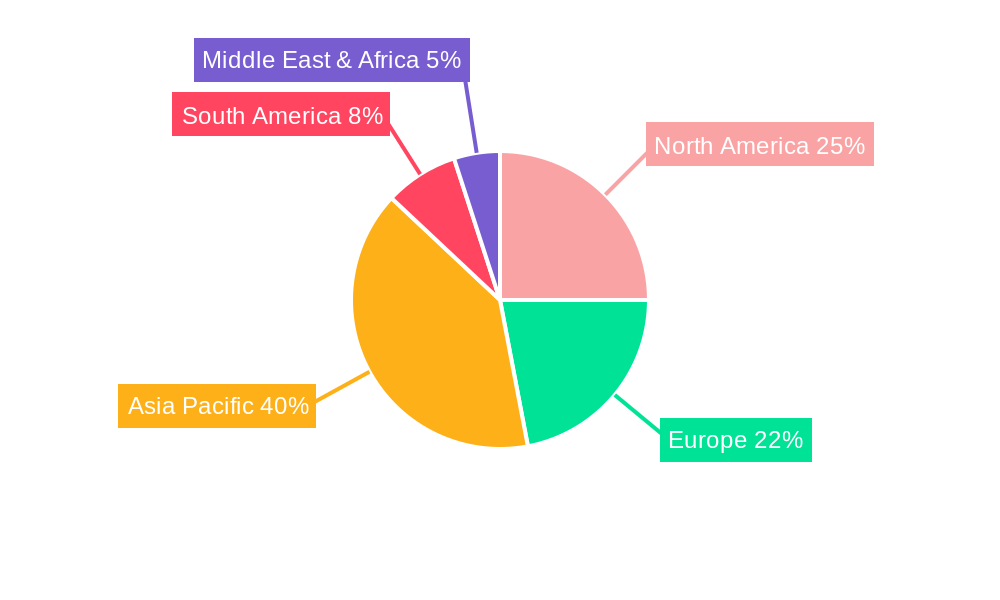
The global green building materials market, valued at $272.05 million in 2025, is projected to experience robust growth, driven by increasing environmental concerns, stringent government regulations promoting sustainable construction, and a rising demand for energy-efficient buildings. The 9.73% CAGR from 2025 to 2033 indicates a significant expansion, fueled by several key factors. The growing adoption of sustainable building practices across residential, commercial, and industrial sectors is a primary driver. Furthermore, advancements in material technology are leading to the development of innovative, eco-friendly alternatives like recycled materials, bio-based composites, and low-carbon concrete, enhancing market appeal. Specific application segments like framing, insulation, and roofing are witnessing particularly strong growth, reflecting the increasing focus on improving building performance and reducing carbon footprints. Key players like Holcim, DuPont, and Owens Corning are strategically investing in research and development, expanding their product portfolios, and adopting sustainable manufacturing processes to capitalize on this burgeoning market. Regional variations exist, with Asia Pacific expected to dominate due to rapid urbanization and infrastructure development, followed by North America and Europe exhibiting substantial growth. However, challenges such as the higher initial cost of green building materials compared to conventional options and the lack of awareness in some regions present potential restraints to market expansion. Despite these challenges, the long-term outlook remains exceptionally positive, with continued growth anticipated across all major segments and regions throughout the forecast period.
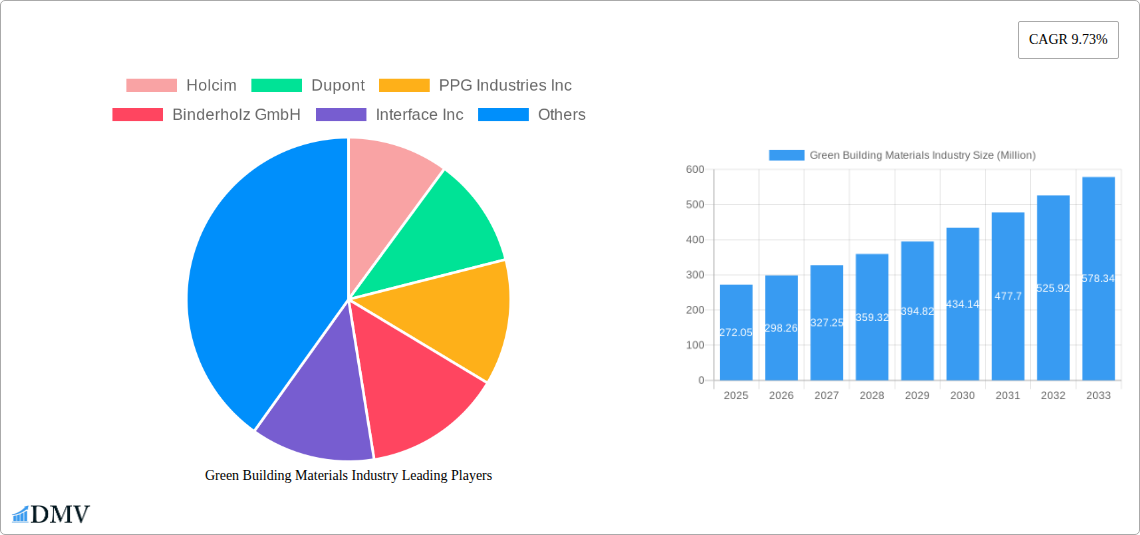
Green Building Materials Industry Market Size (In Million)
The market's segmentation by application (framing, insulation, roofing, exterior siding, interior finishing, other applications) and end-use industry (residential, commercial, industrial and institutional, infrastructure) allows for a granular understanding of growth drivers. For instance, the residential sector's demand for energy-efficient homes is significantly impacting insulation and roofing material sales. Similarly, the increasing focus on sustainable infrastructure projects is driving demand for environmentally friendly materials in the construction of roads, bridges, and other public works. The competitive landscape is characterized by both established multinational corporations and smaller, specialized companies. These companies are actively engaged in mergers and acquisitions, partnerships, and collaborations to enhance their market position and expand their reach. The ongoing research and development efforts within the industry focus on improving the performance, durability, and affordability of green building materials, further bolstering market growth.
Green Building Materials Industry Company Market Share
Green Building Materials Industry Market Report: 2019-2033
This comprehensive report provides an in-depth analysis of the Green Building Materials Industry, projecting a market value exceeding $XX Million by 2033. It covers key market segments, leading players, and future growth trajectories, offering invaluable insights for stakeholders across the value chain. The report utilizes data from the historical period (2019-2024), the base year (2025), and projects the forecast period (2025-2033).
Green Building Materials Industry Market Composition & Trends
This section delves into the competitive landscape of the green building materials market, analyzing market concentration, driving forces of innovation, regulatory influences, substitute product threats, end-user behaviors, and recent merger and acquisition (M&A) activities. The report examines the market share distribution among key players such as Holcim, DuPont, PPG Industries Inc, Binderholz GmbH, Interface Inc, Owens Corning, Kingspan Group, BASF SE, Soben International (Asia-Pacific) Ltd, Saint-Gobain (Certainteed), and Sika AG (list not exhaustive). The analysis includes an assessment of M&A deal values, revealing significant industry consolidation. For example, Holcim’s acquisition of Wiltshire Heavy Building Materials in October 2022 showcases strategic moves to enhance market positioning within the UK. The report also details the impact of regulatory pressures on material choices and the emergence of substitute materials. We explore end-user profiles across Residential, Commercial, Industrial and Institutional, and Infrastructure sectors, highlighting their distinct material needs and preferences.
- Market Concentration: The market exhibits a moderately concentrated structure, with the top 10 players holding approximately XX% market share in 2025.
- M&A Activity: Total M&A deal value in the green building materials sector exceeded $XX Million between 2019 and 2024.
- Innovation Catalysts: Stringent environmental regulations and growing consumer demand for sustainable products are driving innovation in bio-based materials and improved energy efficiency.
Green Building Materials Industry Evolution
This section analyzes the dynamic evolution of the green building materials market from 2019 to 2033, focusing on growth trajectories, technological advancements, and shifting consumer preferences. The report details the market's Compound Annual Growth Rate (CAGR) during the historical and forecast periods, pinpointing key inflection points and growth acceleration phases. Analysis includes the rising adoption rates of sustainable building practices, factors affecting consumer purchasing decisions (cost, environmental impact, performance), and the influence of technological advancements such as precision manufacturing and smart building materials. Specific data on the adoption rate of various green building materials across different end-use industries will be provided, supported by projections to 2033. The impact of increasing awareness of embodied carbon and circular economy principles on market trends is also examined.
Leading Regions, Countries, or Segments in Green Building Materials Industry
This section identifies the dominant regions, countries, and segments within the green building materials market. The analysis covers Applications (Framing, Insulation, Roofing, Exterior Siding, Interior Finishing, Other Applications) and End-use Industries (Residential, Commercial, Industrial and Institutional, Infrastructure). The report identifies the leading region and will detail why that region holds dominance, including factors like robust government policies, high construction activity, and strong consumer demand for sustainable building solutions.
- Key Drivers for Leading Segments:
- Framing: Growing demand for timber and engineered wood products, driven by sustainable forestry practices and improved structural performance.
- Insulation: Increased adoption of high-performance insulation materials owing to stringent energy efficiency regulations.
- Roofing: Rising demand for lightweight and durable roofing materials with enhanced thermal performance.
- Exterior Siding: Growth driven by the increasing preference for aesthetically pleasing and low-maintenance siding solutions.
Green Building Materials Industry Product Innovations
The green building materials sector is characterized by continuous innovation, with the emergence of bio-based materials, recycled content products, and advanced manufacturing techniques leading to improved performance and reduced environmental impact. This section highlights significant product innovations, detailing their applications and performance metrics. This includes advanced insulation materials, high-performance recycled content products, and novel construction techniques that optimize energy efficiency and minimize waste. Unique selling propositions (USPs) and the associated technological advancements will be explored, including reductions in embodied carbon and improvements in lifecycle performance.
Propelling Factors for Green Building Materials Industry Growth
Several key factors are driving the expansion of the green building materials market. These include stringent environmental regulations promoting sustainable building practices, increasing consumer awareness of environmental issues, and the growing adoption of green building standards across various regions. Furthermore, technological advancements in material science are yielding improved performance characteristics and cost-effectiveness, further boosting market growth. Government incentives and subsidies for green building projects also play a crucial role.
Obstacles in the Green Building Materials Industry Market
Despite considerable growth potential, the green building materials market faces several challenges. These include the relatively higher initial cost of green materials compared to conventional alternatives, which can pose a barrier to wider adoption, especially in budget-constrained projects. Supply chain disruptions, particularly for specialized materials with limited sources, can lead to price volatility and project delays. Furthermore, inconsistent or poorly defined regulatory frameworks across different regions can create uncertainty and complexity for manufacturers and builders. Competitive pressures from established players and emerging entrants further contribute to market complexities.
Future Opportunities in Green Building Materials Industry
The future of the green building materials industry is bright, with several emerging opportunities on the horizon. The expanding adoption of smart building technologies and the integration of digital tools in construction will require specialized materials that meet those needs. New materials with superior performance, durability, and reduced environmental impact will also drive growth. Furthermore, growth in emerging economies with increasing urbanization will create new markets for green building materials. Finally, the development of circular economy models for construction waste management presents opportunities for innovative material reuse and recycling solutions.
Major Players in the Green Building Materials Industry Ecosystem
- Holcim
- Dupont
- PPG Industries Inc
- Binderholz GmbH
- Interface Inc
- Owens Corning
- Kingspan Group
- BASF SE
- Soben International (Asia-Pacific) Ltd
- Saint-Gobain (Certainteed)
- Sika AG
Key Developments in Green Building Materials Industry
- October 2022: Holcim acquired Wiltshire Heavy Building Materials, strengthening its UK market presence.
- August 2022: Saint-Gobain acquired Kaycan, expanding its siding and vinyl offerings in North America.
- January 2022: Binderholz GmbH acquired BSW Timber Ltd, becoming Europe's largest sawmill company.
Strategic Green Building Materials Industry Market Forecast
The green building materials market is poised for robust growth over the forecast period, driven by several key catalysts. Stronger environmental regulations, coupled with heightened consumer awareness of sustainability, will propel demand. Continuous innovation in material science and manufacturing processes will lead to enhanced product performance and cost-effectiveness. Government initiatives supporting green building practices will further stimulate market expansion, resulting in significant market potential and promising opportunities for industry players.
Green Building Materials Industry Segmentation
-
1. Application
- 1.1. Framing
- 1.2. Insulation
- 1.3. Roofing
- 1.4. Exterior Siding
- 1.5. Interior Finishing
- 1.6. Other Applications
-
2. End-use Industry
- 2.1. Residential
- 2.2. Commercial
- 2.3. Industrial and Institutional
- 2.4. Infrastructure
Green Building Materials Industry Segmentation By Geography
-
1. Asia Pacific
- 1.1. China
- 1.2. India
- 1.3. Japan
- 1.4. South Korea
- 1.5. Rest of Asia Pacific
-
2. North America
- 2.1. United States
- 2.2. Canada
- 2.3. Mexico
-
3. Europe
- 3.1. Germany
- 3.2. United Kingdom
- 3.3. Italy
- 3.4. France
- 3.5. Rest of Europe
-
4. South America
- 4.1. Brazil
- 4.2. Argentina
- 4.3. Rest of South America
- 5. Middle East
-
6. Saudi Arabia
- 6.1. South Africa
- 6.2. Rest of Middle East
Green Building Materials Industry Regional Market Share
Geographic Coverage of Green Building Materials Industry
Green Building Materials Industry REPORT HIGHLIGHTS
| Aspects | Details |
|---|---|
| Study Period | 2020-2034 |
| Base Year | 2025 |
| Estimated Year | 2026 |
| Forecast Period | 2026-2034 |
| Historical Period | 2020-2025 |
| Growth Rate | CAGR of 9.73% from 2020-2034 |
| Segmentation |
|
Table of Contents
- 1. Introduction
- 1.1. Research Scope
- 1.2. Market Segmentation
- 1.3. Research Objective
- 1.4. Definitions and Assumptions
- 2. Executive Summary
- 2.1. Market Snapshot
- 3. Market Dynamics
- 3.1. Market Drivers
- 3.2. Market Restrains
- 3.3. Market Trends
- 3.4. Market Opportunities
- 4. Market Factor Analysis
- 4.1. Porters Five Forces
- 4.1.1. Bargaining Power of Suppliers
- 4.1.2. Bargaining Power of Buyers
- 4.1.3. Threat of New Entrants
- 4.1.4. Threat of Substitutes
- 4.1.5. Competitive Rivalry
- 4.2. PESTEL analysis
- 4.3. BCG Analysis
- 4.3.1. Stars (High Growth, High Market Share)
- 4.3.2. Cash Cows (Low Growth, High Market Share)
- 4.3.3. Question Mark (High Growth, Low Market Share)
- 4.3.4. Dogs (Low Growth, Low Market Share)
- 4.4. Ansoff Matrix Analysis
- 4.5. Supply Chain Analysis
- 4.6. Regulatory Landscape
- 4.7. Current Market Potential and Opportunity Assessment (TAM–SAM–SOM Framework)
- 4.8. DMV Analyst Note
- 4.1. Porters Five Forces
- 5. Market Analysis, Insights and Forecast 2021-2033
- 5.1. Market Analysis, Insights and Forecast - by Application
- 5.1.1. Framing
- 5.1.2. Insulation
- 5.1.3. Roofing
- 5.1.4. Exterior Siding
- 5.1.5. Interior Finishing
- 5.1.6. Other Applications
- 5.2. Market Analysis, Insights and Forecast - by End-use Industry
- 5.2.1. Residential
- 5.2.2. Commercial
- 5.2.3. Industrial and Institutional
- 5.2.4. Infrastructure
- 5.3. Market Analysis, Insights and Forecast - by Region
- 5.3.1. Asia Pacific
- 5.3.2. North America
- 5.3.3. Europe
- 5.3.4. South America
- 5.3.5. Middle East
- 5.3.6. Saudi Arabia
- 5.1. Market Analysis, Insights and Forecast - by Application
- 6. Global Green Building Materials Industry Analysis, Insights and Forecast, 2021-2033
- 6.1. Market Analysis, Insights and Forecast - by Application
- 6.1.1. Framing
- 6.1.2. Insulation
- 6.1.3. Roofing
- 6.1.4. Exterior Siding
- 6.1.5. Interior Finishing
- 6.1.6. Other Applications
- 6.2. Market Analysis, Insights and Forecast - by End-use Industry
- 6.2.1. Residential
- 6.2.2. Commercial
- 6.2.3. Industrial and Institutional
- 6.2.4. Infrastructure
- 6.1. Market Analysis, Insights and Forecast - by Application
- 7. Asia Pacific Green Building Materials Industry Analysis, Insights and Forecast, 2020-2032
- 7.1. Market Analysis, Insights and Forecast - by Application
- 7.1.1. Framing
- 7.1.2. Insulation
- 7.1.3. Roofing
- 7.1.4. Exterior Siding
- 7.1.5. Interior Finishing
- 7.1.6. Other Applications
- 7.2. Market Analysis, Insights and Forecast - by End-use Industry
- 7.2.1. Residential
- 7.2.2. Commercial
- 7.2.3. Industrial and Institutional
- 7.2.4. Infrastructure
- 7.1. Market Analysis, Insights and Forecast - by Application
- 8. North America Green Building Materials Industry Analysis, Insights and Forecast, 2020-2032
- 8.1. Market Analysis, Insights and Forecast - by Application
- 8.1.1. Framing
- 8.1.2. Insulation
- 8.1.3. Roofing
- 8.1.4. Exterior Siding
- 8.1.5. Interior Finishing
- 8.1.6. Other Applications
- 8.2. Market Analysis, Insights and Forecast - by End-use Industry
- 8.2.1. Residential
- 8.2.2. Commercial
- 8.2.3. Industrial and Institutional
- 8.2.4. Infrastructure
- 8.1. Market Analysis, Insights and Forecast - by Application
- 9. Europe Green Building Materials Industry Analysis, Insights and Forecast, 2020-2032
- 9.1. Market Analysis, Insights and Forecast - by Application
- 9.1.1. Framing
- 9.1.2. Insulation
- 9.1.3. Roofing
- 9.1.4. Exterior Siding
- 9.1.5. Interior Finishing
- 9.1.6. Other Applications
- 9.2. Market Analysis, Insights and Forecast - by End-use Industry
- 9.2.1. Residential
- 9.2.2. Commercial
- 9.2.3. Industrial and Institutional
- 9.2.4. Infrastructure
- 9.1. Market Analysis, Insights and Forecast - by Application
- 10. South America Green Building Materials Industry Analysis, Insights and Forecast, 2020-2032
- 10.1. Market Analysis, Insights and Forecast - by Application
- 10.1.1. Framing
- 10.1.2. Insulation
- 10.1.3. Roofing
- 10.1.4. Exterior Siding
- 10.1.5. Interior Finishing
- 10.1.6. Other Applications
- 10.2. Market Analysis, Insights and Forecast - by End-use Industry
- 10.2.1. Residential
- 10.2.2. Commercial
- 10.2.3. Industrial and Institutional
- 10.2.4. Infrastructure
- 10.1. Market Analysis, Insights and Forecast - by Application
- 11. Middle East Green Building Materials Industry Analysis, Insights and Forecast, 2020-2032
- 11.1. Market Analysis, Insights and Forecast - by Application
- 11.1.1. Framing
- 11.1.2. Insulation
- 11.1.3. Roofing
- 11.1.4. Exterior Siding
- 11.1.5. Interior Finishing
- 11.1.6. Other Applications
- 11.2. Market Analysis, Insights and Forecast - by End-use Industry
- 11.2.1. Residential
- 11.2.2. Commercial
- 11.2.3. Industrial and Institutional
- 11.2.4. Infrastructure
- 11.1. Market Analysis, Insights and Forecast - by Application
- 12. Saudi Arabia Green Building Materials Industry Analysis, Insights and Forecast, 2020-2032
- 12.1. Market Analysis, Insights and Forecast - by Application
- 12.1.1. Framing
- 12.1.2. Insulation
- 12.1.3. Roofing
- 12.1.4. Exterior Siding
- 12.1.5. Interior Finishing
- 12.1.6. Other Applications
- 12.2. Market Analysis, Insights and Forecast - by End-use Industry
- 12.2.1. Residential
- 12.2.2. Commercial
- 12.2.3. Industrial and Institutional
- 12.2.4. Infrastructure
- 12.1. Market Analysis, Insights and Forecast - by Application
- 13. Competitive Analysis
- 13.1. Company Profiles
- 13.1.1 Holcim
- 13.1.1.1. Company Overview
- 13.1.1.2. Products
- 13.1.1.3. Company Financials
- 13.1.1.4. SWOT Analysis
- 13.1.2 Dupont
- 13.1.2.1. Company Overview
- 13.1.2.2. Products
- 13.1.2.3. Company Financials
- 13.1.2.4. SWOT Analysis
- 13.1.3 PPG Industries Inc
- 13.1.3.1. Company Overview
- 13.1.3.2. Products
- 13.1.3.3. Company Financials
- 13.1.3.4. SWOT Analysis
- 13.1.4 Binderholz GmbH
- 13.1.4.1. Company Overview
- 13.1.4.2. Products
- 13.1.4.3. Company Financials
- 13.1.4.4. SWOT Analysis
- 13.1.5 Interface Inc
- 13.1.5.1. Company Overview
- 13.1.5.2. Products
- 13.1.5.3. Company Financials
- 13.1.5.4. SWOT Analysis
- 13.1.6 Owens Corning
- 13.1.6.1. Company Overview
- 13.1.6.2. Products
- 13.1.6.3. Company Financials
- 13.1.6.4. SWOT Analysis
- 13.1.7 Kingspan Group
- 13.1.7.1. Company Overview
- 13.1.7.2. Products
- 13.1.7.3. Company Financials
- 13.1.7.4. SWOT Analysis
- 13.1.8 BASF SE
- 13.1.8.1. Company Overview
- 13.1.8.2. Products
- 13.1.8.3. Company Financials
- 13.1.8.4. SWOT Analysis
- 13.1.9 Soben International (Asia-Pacific) Ltd*List Not Exhaustive
- 13.1.9.1. Company Overview
- 13.1.9.2. Products
- 13.1.9.3. Company Financials
- 13.1.9.4. SWOT Analysis
- 13.1.10 Saint- Gobain (Certainteed)
- 13.1.10.1. Company Overview
- 13.1.10.2. Products
- 13.1.10.3. Company Financials
- 13.1.10.4. SWOT Analysis
- 13.1.11 Sika AG
- 13.1.11.1. Company Overview
- 13.1.11.2. Products
- 13.1.11.3. Company Financials
- 13.1.11.4. SWOT Analysis
- 13.1.1 Holcim
- 13.2. Market Entropy
- 13.2.1 Company's Key Areas Served
- 13.2.2 Recent Developments
- 13.3. Company Market Share Analysis 2025
- 13.3.1 Top 5 Companies Market Share Analysis
- 13.3.2 Top 3 Companies Market Share Analysis
- 13.4. List of Potential Customers
- 14. Research Methodology
List of Figures
- Figure 1: Global Green Building Materials Industry Revenue Breakdown (Million, %) by Region 2025 & 2033
- Figure 2: Asia Pacific Green Building Materials Industry Revenue (Million), by Application 2025 & 2033
- Figure 3: Asia Pacific Green Building Materials Industry Revenue Share (%), by Application 2025 & 2033
- Figure 4: Asia Pacific Green Building Materials Industry Revenue (Million), by End-use Industry 2025 & 2033
- Figure 5: Asia Pacific Green Building Materials Industry Revenue Share (%), by End-use Industry 2025 & 2033
- Figure 6: Asia Pacific Green Building Materials Industry Revenue (Million), by Country 2025 & 2033
- Figure 7: Asia Pacific Green Building Materials Industry Revenue Share (%), by Country 2025 & 2033
- Figure 8: North America Green Building Materials Industry Revenue (Million), by Application 2025 & 2033
- Figure 9: North America Green Building Materials Industry Revenue Share (%), by Application 2025 & 2033
- Figure 10: North America Green Building Materials Industry Revenue (Million), by End-use Industry 2025 & 2033
- Figure 11: North America Green Building Materials Industry Revenue Share (%), by End-use Industry 2025 & 2033
- Figure 12: North America Green Building Materials Industry Revenue (Million), by Country 2025 & 2033
- Figure 13: North America Green Building Materials Industry Revenue Share (%), by Country 2025 & 2033
- Figure 14: Europe Green Building Materials Industry Revenue (Million), by Application 2025 & 2033
- Figure 15: Europe Green Building Materials Industry Revenue Share (%), by Application 2025 & 2033
- Figure 16: Europe Green Building Materials Industry Revenue (Million), by End-use Industry 2025 & 2033
- Figure 17: Europe Green Building Materials Industry Revenue Share (%), by End-use Industry 2025 & 2033
- Figure 18: Europe Green Building Materials Industry Revenue (Million), by Country 2025 & 2033
- Figure 19: Europe Green Building Materials Industry Revenue Share (%), by Country 2025 & 2033
- Figure 20: South America Green Building Materials Industry Revenue (Million), by Application 2025 & 2033
- Figure 21: South America Green Building Materials Industry Revenue Share (%), by Application 2025 & 2033
- Figure 22: South America Green Building Materials Industry Revenue (Million), by End-use Industry 2025 & 2033
- Figure 23: South America Green Building Materials Industry Revenue Share (%), by End-use Industry 2025 & 2033
- Figure 24: South America Green Building Materials Industry Revenue (Million), by Country 2025 & 2033
- Figure 25: South America Green Building Materials Industry Revenue Share (%), by Country 2025 & 2033
- Figure 26: Middle East Green Building Materials Industry Revenue (Million), by Application 2025 & 2033
- Figure 27: Middle East Green Building Materials Industry Revenue Share (%), by Application 2025 & 2033
- Figure 28: Middle East Green Building Materials Industry Revenue (Million), by End-use Industry 2025 & 2033
- Figure 29: Middle East Green Building Materials Industry Revenue Share (%), by End-use Industry 2025 & 2033
- Figure 30: Middle East Green Building Materials Industry Revenue (Million), by Country 2025 & 2033
- Figure 31: Middle East Green Building Materials Industry Revenue Share (%), by Country 2025 & 2033
- Figure 32: Saudi Arabia Green Building Materials Industry Revenue (Million), by Application 2025 & 2033
- Figure 33: Saudi Arabia Green Building Materials Industry Revenue Share (%), by Application 2025 & 2033
- Figure 34: Saudi Arabia Green Building Materials Industry Revenue (Million), by End-use Industry 2025 & 2033
- Figure 35: Saudi Arabia Green Building Materials Industry Revenue Share (%), by End-use Industry 2025 & 2033
- Figure 36: Saudi Arabia Green Building Materials Industry Revenue (Million), by Country 2025 & 2033
- Figure 37: Saudi Arabia Green Building Materials Industry Revenue Share (%), by Country 2025 & 2033
List of Tables
- Table 1: Global Green Building Materials Industry Revenue Million Forecast, by Application 2020 & 2033
- Table 2: Global Green Building Materials Industry Revenue Million Forecast, by End-use Industry 2020 & 2033
- Table 3: Global Green Building Materials Industry Revenue Million Forecast, by Region 2020 & 2033
- Table 4: Global Green Building Materials Industry Revenue Million Forecast, by Application 2020 & 2033
- Table 5: Global Green Building Materials Industry Revenue Million Forecast, by End-use Industry 2020 & 2033
- Table 6: Global Green Building Materials Industry Revenue Million Forecast, by Country 2020 & 2033
- Table 7: China Green Building Materials Industry Revenue (Million) Forecast, by Application 2020 & 2033
- Table 8: India Green Building Materials Industry Revenue (Million) Forecast, by Application 2020 & 2033
- Table 9: Japan Green Building Materials Industry Revenue (Million) Forecast, by Application 2020 & 2033
- Table 10: South Korea Green Building Materials Industry Revenue (Million) Forecast, by Application 2020 & 2033
- Table 11: Rest of Asia Pacific Green Building Materials Industry Revenue (Million) Forecast, by Application 2020 & 2033
- Table 12: Global Green Building Materials Industry Revenue Million Forecast, by Application 2020 & 2033
- Table 13: Global Green Building Materials Industry Revenue Million Forecast, by End-use Industry 2020 & 2033
- Table 14: Global Green Building Materials Industry Revenue Million Forecast, by Country 2020 & 2033
- Table 15: United States Green Building Materials Industry Revenue (Million) Forecast, by Application 2020 & 2033
- Table 16: Canada Green Building Materials Industry Revenue (Million) Forecast, by Application 2020 & 2033
- Table 17: Mexico Green Building Materials Industry Revenue (Million) Forecast, by Application 2020 & 2033
- Table 18: Global Green Building Materials Industry Revenue Million Forecast, by Application 2020 & 2033
- Table 19: Global Green Building Materials Industry Revenue Million Forecast, by End-use Industry 2020 & 2033
- Table 20: Global Green Building Materials Industry Revenue Million Forecast, by Country 2020 & 2033
- Table 21: Germany Green Building Materials Industry Revenue (Million) Forecast, by Application 2020 & 2033
- Table 22: United Kingdom Green Building Materials Industry Revenue (Million) Forecast, by Application 2020 & 2033
- Table 23: Italy Green Building Materials Industry Revenue (Million) Forecast, by Application 2020 & 2033
- Table 24: France Green Building Materials Industry Revenue (Million) Forecast, by Application 2020 & 2033
- Table 25: Rest of Europe Green Building Materials Industry Revenue (Million) Forecast, by Application 2020 & 2033
- Table 26: Global Green Building Materials Industry Revenue Million Forecast, by Application 2020 & 2033
- Table 27: Global Green Building Materials Industry Revenue Million Forecast, by End-use Industry 2020 & 2033
- Table 28: Global Green Building Materials Industry Revenue Million Forecast, by Country 2020 & 2033
- Table 29: Brazil Green Building Materials Industry Revenue (Million) Forecast, by Application 2020 & 2033
- Table 30: Argentina Green Building Materials Industry Revenue (Million) Forecast, by Application 2020 & 2033
- Table 31: Rest of South America Green Building Materials Industry Revenue (Million) Forecast, by Application 2020 & 2033
- Table 32: Global Green Building Materials Industry Revenue Million Forecast, by Application 2020 & 2033
- Table 33: Global Green Building Materials Industry Revenue Million Forecast, by End-use Industry 2020 & 2033
- Table 34: Global Green Building Materials Industry Revenue Million Forecast, by Country 2020 & 2033
- Table 35: Global Green Building Materials Industry Revenue Million Forecast, by Application 2020 & 2033
- Table 36: Global Green Building Materials Industry Revenue Million Forecast, by End-use Industry 2020 & 2033
- Table 37: Global Green Building Materials Industry Revenue Million Forecast, by Country 2020 & 2033
- Table 38: South Africa Green Building Materials Industry Revenue (Million) Forecast, by Application 2020 & 2033
- Table 39: Rest of Middle East Green Building Materials Industry Revenue (Million) Forecast, by Application 2020 & 2033
Frequently Asked Questions
1. What is the projected Compound Annual Growth Rate (CAGR) of the Green Building Materials Industry?
The projected CAGR is approximately 9.73%.
2. Which companies are prominent players in the Green Building Materials Industry?
Key companies in the market include Holcim, Dupont, PPG Industries Inc, Binderholz GmbH, Interface Inc, Owens Corning, Kingspan Group, BASF SE, Soben International (Asia-Pacific) Ltd*List Not Exhaustive, Saint- Gobain (Certainteed), Sika AG.
3. What are the main segments of the Green Building Materials Industry?
The market segments include Application, End-use Industry.
4. Can you provide details about the market size?
The market size is estimated to be USD 272.05 Million as of 2022.
5. What are some drivers contributing to market growth?
Increasing Demand for Insulation and Energy-efficient Buildings; Favorable Government Policies for Green Buildings.
6. What are the notable trends driving market growth?
Increasing Consumption of Green Building Materials in the Residential End-use Industry.
7. Are there any restraints impacting market growth?
High Initial Capital Investment Compared to Conventional Buildings.
8. Can you provide examples of recent developments in the market?
October 2022: Holcim acquired Wiltshire Heavy Building Materials, one of the leading companies providing building solutions and material circularity in the United Kingdom. This acquisition will strengthen Holcim's market presence in the United Kingdom's green building materials market.
9. What pricing options are available for accessing the report?
Pricing options include single-user, multi-user, and enterprise licenses priced at USD 4750, USD 5250, and USD 8750 respectively.
10. Is the market size provided in terms of value or volume?
The market size is provided in terms of value, measured in Million.
11. Are there any specific market keywords associated with the report?
Yes, the market keyword associated with the report is "Green Building Materials Industry," which aids in identifying and referencing the specific market segment covered.
12. How do I determine which pricing option suits my needs best?
The pricing options vary based on user requirements and access needs. Individual users may opt for single-user licenses, while businesses requiring broader access may choose multi-user or enterprise licenses for cost-effective access to the report.
13. Are there any additional resources or data provided in the Green Building Materials Industry report?
While the report offers comprehensive insights, it's advisable to review the specific contents or supplementary materials provided to ascertain if additional resources or data are available.
14. How can I stay updated on further developments or reports in the Green Building Materials Industry?
To stay informed about further developments, trends, and reports in the Green Building Materials Industry, consider subscribing to industry newsletters, following relevant companies and organizations, or regularly checking reputable industry news sources and publications.
Methodology
Step 1 - Identification of Relevant Samples Size from Population Database


Step 2 - Approaches for Defining Global Market Size (Value, Volume* & Price*)

Note*: In applicable scenarios
Step 3 - Data Sources
Primary Research
- Web Analytics
- Survey Reports
- Research Institute
- Latest Research Reports
- Opinion Leaders
Secondary Research
- Annual Reports
- White Paper
- Latest Press Release
- Industry Association
- Paid Database
- Investor Presentations

Step 4 - Data Triangulation
Involves using different sources of information in order to increase the validity of a study
These sources are likely to be stakeholders in a program - participants, other researchers, program staff, other community members, and so on.
Then we put all data in single framework & apply various statistical tools to find out the dynamic on the market.
During the analysis stage, feedback from the stakeholder groups would be compared to determine areas of agreement as well as areas of divergence