

Key Insights
The global graphite market is poised for significant expansion, with a projected market size of $31.59 billion by 2025. This growth is primarily propelled by the rapidly expanding electric vehicle (EV) and energy storage sectors, driven by escalating demand for lithium-ion batteries. Synthetic graphite, distinguished by its superior purity and consistent properties, is experiencing accelerated adoption and commands a premium. Innovations in graphite processing are enhancing material quality, benefiting applications in high-performance refractories, lubricants, and specialized electronics. The Asia-Pacific region, led by China, currently dominates the market due to its substantial manufacturing capabilities and a strong ecosystem of graphite producers and consumers. Emerging trends include a focus on sustainable practices and the integration of recycled graphite materials in response to environmental considerations.
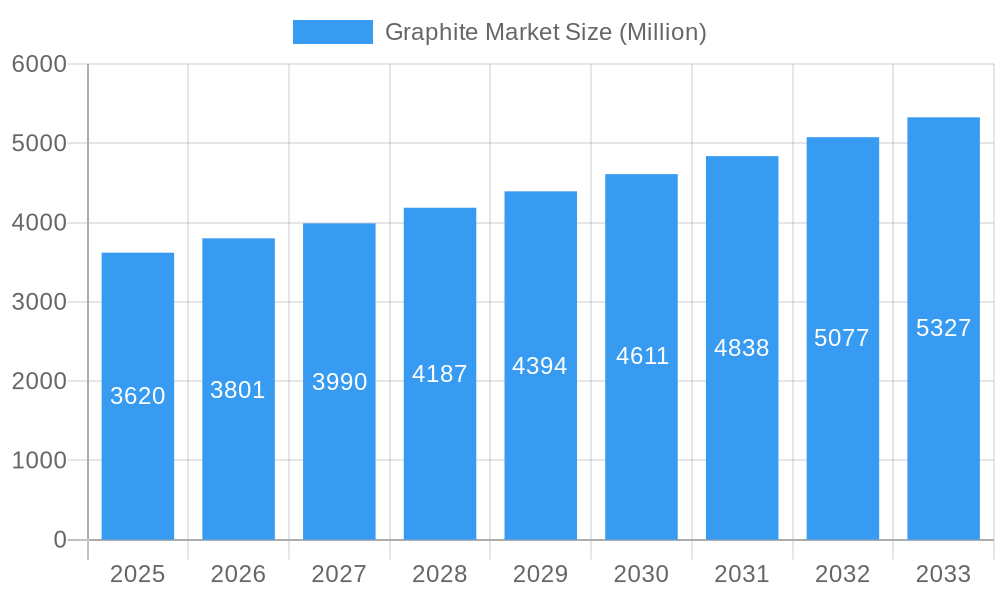
Graphite Market Market Size (In Billion)
The forecast period (2025-2033) anticipates a compound annual growth rate (CAGR) of 8.42%. The electrification of transportation and the build-out of renewable energy infrastructure are key drivers. Beyond the automotive sector, the electronics industry's demand for high-purity graphite in semiconductors and other components is a significant contributor to market growth. The competitive environment features established market leaders and agile new entrants focusing on novel graphite applications and sustainable sourcing strategies. Regional growth dynamics will be influenced by policies supporting electric mobility, investments in renewable energy, and the accessibility of quality graphite resources. Market participants should monitor raw material price volatility, geopolitical influences on supply chains, and the imperative for continuous innovation to address evolving application demands.
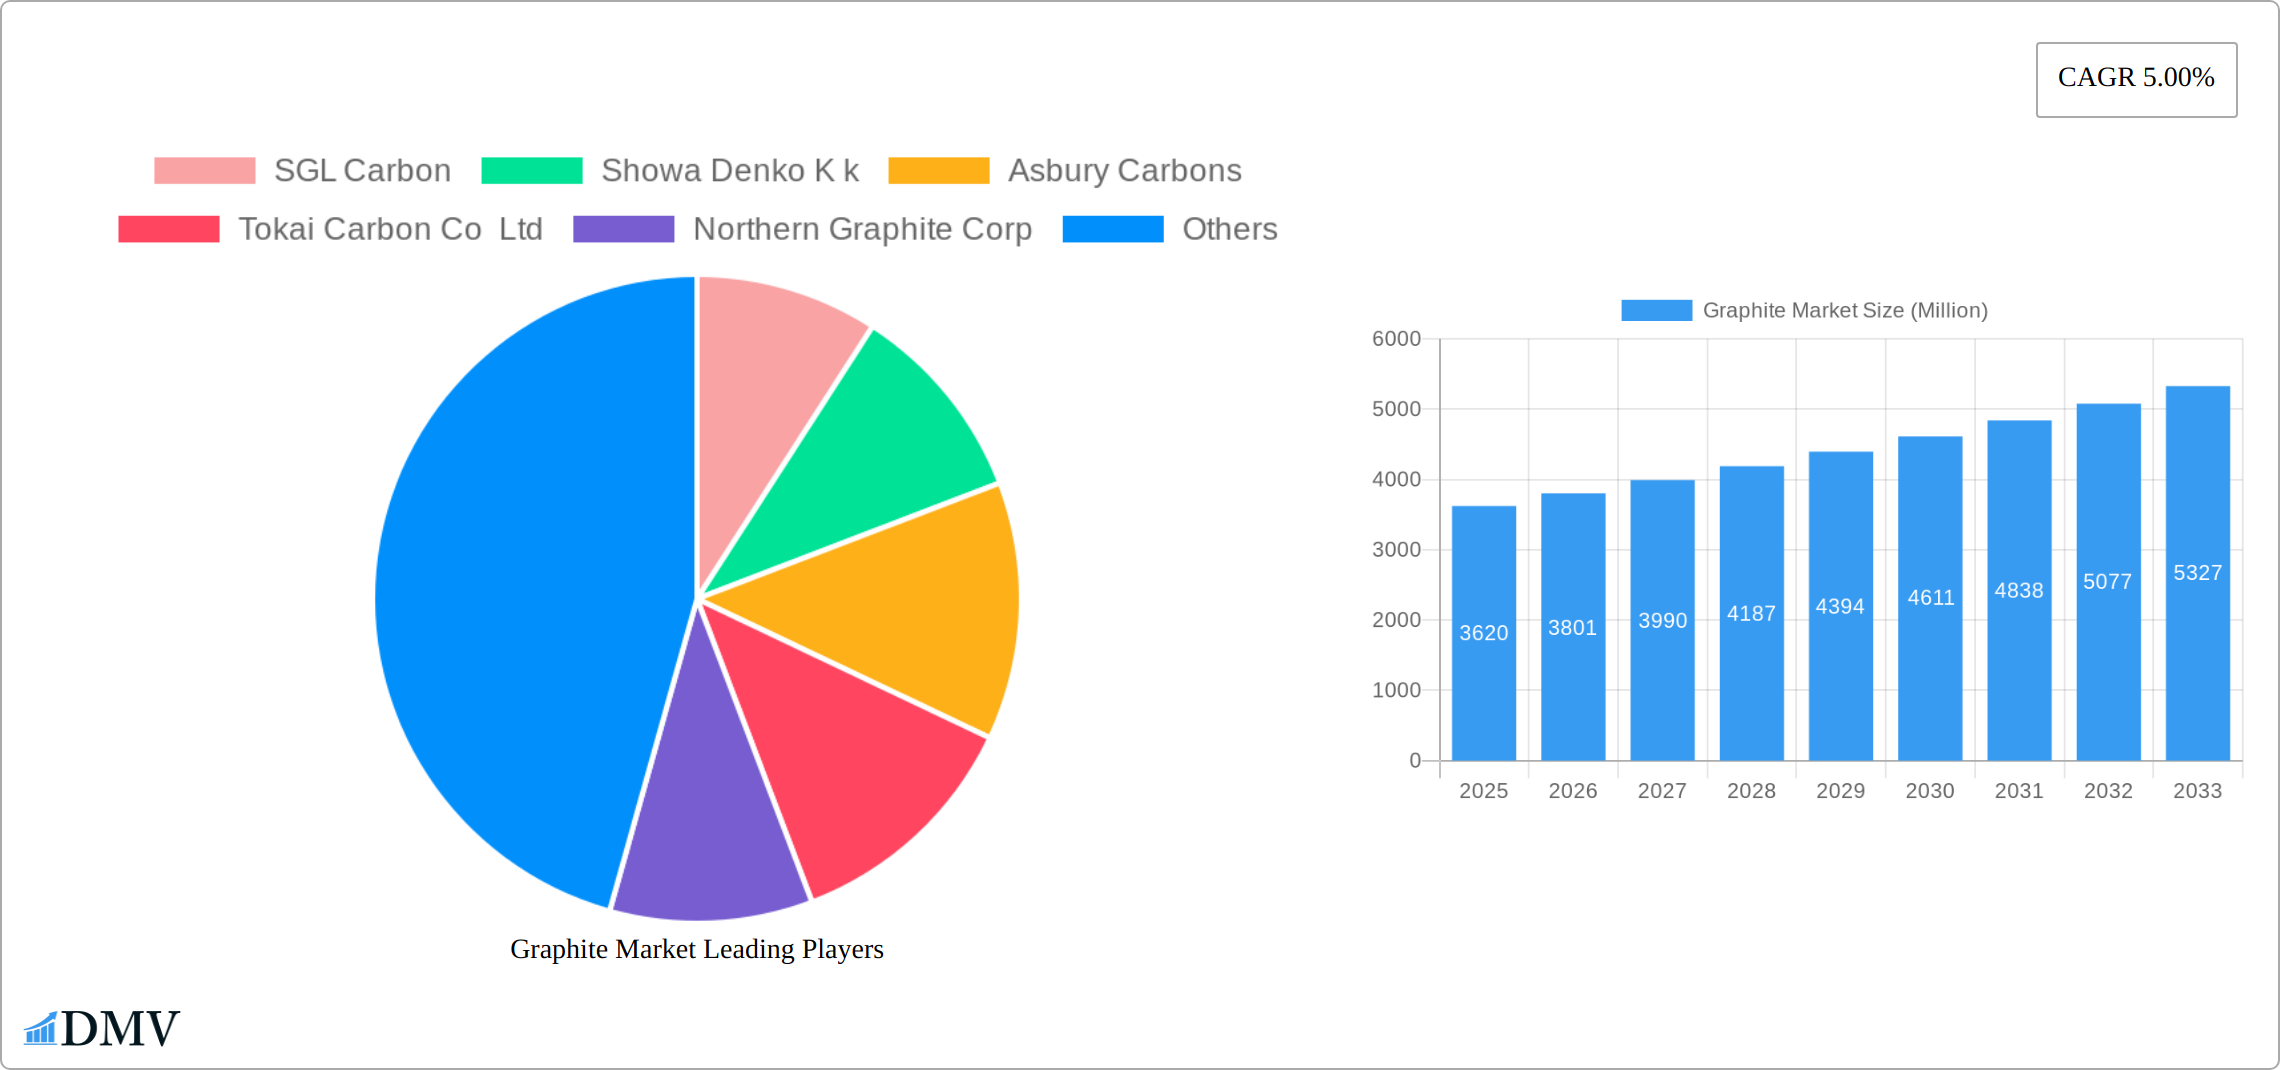
Graphite Market Company Market Share
Graphite Market Market Composition & Trends
The Graphite Market is characterized by a moderate to high level of concentration, with leading players such as SGL Carbon, Showa Denko K.K., and Imerys commanding significant market shares. As of the base year 2025, SGL Carbon holds approximately 15% of the market share, followed by Showa Denko K.K. with 12%, and Imerys with 10%. The market is driven by innovation catalysts such as the increasing demand for electric vehicles (EVs) and advancements in battery technology, particularly in the production of lithium-ion batteries.
- Regulatory Landscape: Stringent environmental regulations in regions like Europe and North America are pushing the industry towards more sustainable production methods. For instance, the European Union's Green Deal aims to reduce carbon emissions, which impacts graphite production processes.
- Substitute Products: While graphite remains essential for many applications, alternatives like graphene are gaining traction due to their superior properties. However, the cost and scalability of graphene production currently limit its widespread adoption.
- End-User Profiles: The automotive sector, particularly the EV segment, is a major end-user, with demand projected to grow at a CAGR of 10% during the forecast period (2025-2033). The electronics industry also plays a crucial role, leveraging graphite in applications such as electrodes and batteries.
- M&A Activities: The market has seen significant mergers and acquisitions, with deal values reaching over $500 Million in 2022. Notable acquisitions include BTR New Material Group Co Ltd.'s purchase of a smaller graphite producer to enhance its market position.
The interplay of these factors shapes the market's trajectory, with a focus on sustainability and technological innovation driving growth.
Graphite Market Industry Evolution
The Graphite Market has evolved significantly from 2019 to 2033, witnessing robust growth fueled by technological advancements and shifting consumer demands. The historical period (2019-2024) saw a steady growth rate of approximately 5% annually, primarily driven by the metallurgy and electronics sectors. However, the advent of electric vehicles and the subsequent demand for lithium-ion batteries have accelerated market growth, with a projected CAGR of 8% from 2025 to 2033.
Technological advancements, such as the development of synthetic graphite with enhanced thermal and electrical conductivity, have broadened the market's application scope. For instance, synthetic graphite's adoption in high-performance batteries has surged, with adoption rates increasing by 15% annually since 2020. Moreover, the integration of graphite in advanced refractory materials has improved their durability and performance, further driving market expansion.
Consumer demands have shifted towards sustainable and high-performance materials, influencing the market's trajectory. The automotive industry's pivot towards EVs and hybrid electric vehicles (HEVs) has created a substantial demand for graphite in battery anodes. This trend is expected to continue, with EV sales projected to reach 30 Million units annually by 2030, significantly boosting graphite consumption.
The market's evolution is also influenced by global economic trends and geopolitical factors, with regions like Asia-Pacific leading in graphite production and consumption due to their robust industrial base and supportive government policies.
Leading Regions, Countries, or Segments in Graphite Market
The graphite market displays diverse regional, national, and segmental dominance, each driven by unique factors. This dynamic landscape is shaped by a complex interplay of industrial activity, technological advancements, and governmental policies.
Asia-Pacific: This region reigns supreme as both the leading consumer and producer of graphite, fueled by a robust industrial base and substantial demand from the electronics and automotive sectors. Key growth drivers include substantial investments in electric vehicle (EV) infrastructure and supportive government initiatives promoting renewable energy adoption. This strong foundation positions the Asia-Pacific region for continued market leadership.
China: Within the Asia-Pacific region, China stands out as the undisputed leader, accounting for over 60% of global graphite production. This dominance is attributed to its vast manufacturing capabilities and the presence of major graphite companies such as BTR New Material Group Co Ltd and Jiangxi Zichen Technology Co Ltd. The country's extensive infrastructure and established supply chains further solidify its position.
Synthetic Graphite Segment: This segment is experiencing remarkable growth, propelled by its crucial role in high-performance batteries and electrodes. The demand for synthetic graphite in lithium-ion batteries is projected to experience a Compound Annual Growth Rate (CAGR) of 12% from 2025 to 2033, driven by the burgeoning EV market and ongoing advancements in battery technology. This rapid expansion highlights the significant potential of synthetic graphite.
Batteries Application: The batteries segment represents the fastest-growing application, boasting a projected annual growth rate of 15%. This surge in demand is directly linked to the global push towards electric mobility and the increasing need for robust renewable energy storage solutions. The expanding energy storage market is a significant catalyst for graphite demand.
Automotive End-User Industry: The automotive sector, particularly the electric vehicle (EV) segment, is a pivotal driver of graphite demand. The industry's rapid transition towards electric and hybrid vehicles is expected to increase graphite consumption by 20% annually through 2033, reflecting the strong correlation between EV adoption and graphite utilization.
The dominance of these regions, countries, and segments is reinforced by a confluence of investment trends, technological breakthroughs, and supportive regulations. For example, the European Union's initiatives to curtail carbon emissions are stimulating investments in sustainable graphite production methods, further strengthening the region's market standing and promoting environmentally conscious practices.
Graphite Market Product Innovations
Recent product innovations in the Graphite Market have focused on enhancing performance and sustainability. Companies like SGL Carbon have introduced high-purity synthetic graphite for use in advanced lithium-ion batteries, offering superior energy density and longer lifecycles. Additionally, innovations in natural graphite processing have led to the development of ultra-fine graphite powders, which are ideal for high-performance lubricants and refractory applications. These advancements underscore the industry's commitment to meeting evolving consumer demands and regulatory standards.
Propelling Factors for Graphite Market Growth
Several key factors are propelling the growth of the Graphite Market:
- Technological Advancements: The development of high-performance synthetic graphite for use in lithium-ion batteries is driving demand, particularly in the EV sector.
- Economic Influences: The global shift towards electric mobility and renewable energy solutions is increasing graphite consumption.
- Regulatory Support: Government policies promoting sustainable materials and reducing carbon emissions are boosting the market. For example, the European Union's Green Deal is encouraging the adoption of eco-friendly graphite production methods.
These factors are creating a robust environment for market expansion, with significant opportunities for stakeholders.
Obstacles in the Graphite Market Market
The Graphite Market faces several obstacles that may impede growth:
- Regulatory Challenges: Stringent environmental regulations can increase production costs, impacting profitability.
- Supply Chain Disruptions: Geopolitical tensions and trade restrictions can disrupt graphite supply chains, leading to price volatility.
- Competitive Pressures: The emergence of alternative materials like graphene poses a threat to graphite's market share, despite current limitations in scalability and cost.
These challenges require strategic planning and innovation to mitigate their impact on market dynamics.
Future Opportunities in Graphite Market
Emerging opportunities in the Graphite Market include:
- New Markets: The growing demand for graphite in emerging economies presents untapped potential for market expansion.
- Technological Innovations: Advances in graphite processing and application technologies, such as the development of graphene-enhanced graphite composites, offer new avenues for growth.
- Consumer Trends: The increasing focus on sustainability and high-performance materials is driving demand for eco-friendly graphite products.
These opportunities highlight the market's potential for future growth and innovation.
Major Players in the Graphite Market Ecosystem
- SGL Carbon
- Showa Denko K.K.
- Asbury Carbons
- Tokai Carbon Co Ltd
- Northern Graphite Corp
- Mason Graphite Inc
- Triton Minerals
- BTR New Material Group Co Ltd
- Jiangxi Zichen Technology Co Ltd
- Imerys
- Shanghai Shanshan Technology Co Ltd
- Syrah Resources Limited
- Shenzhen Xiangfenghua Technology Co Ltd
- Nippon Kokuen Group
Key Developments in Graphite Market Industry
October 2022: Syrah Resources Ltd. announced a strategic agreement to supply 2 kilotons per annum of graphite to LG Energy Solution Ltd. for use in lithium-ion battery components starting in 2025, with plans to increase to at least 10 ktpa following capacity expansion at its Vidalia facility in Louisiana. This development underscores the growing importance of graphite in the EV battery market and strengthens Syrah's position as a key supplier.
October 2022: Imerys Graphite & Carbon launched the EMILI Project at its Beauvoir site in France, aimed at expanding its lithium exploitation capabilities. The project is set to enhance Imerys' market leadership in Li-ion battery components and complete its product line, including synthetic graphite and carbon black, at facilities in Willebroek (Belgium) and Bodio (Switzerland). This initiative highlights Imerys' commitment to innovation and sustainability in the graphite market.
Strategic Graphite Market Market Forecast
The Graphite Market is poised for significant growth from 2025 to 2033, driven by several catalysts. The increasing adoption of electric vehicles and the demand for high-performance lithium-ion batteries are key growth drivers, with the EV sector projected to boost graphite consumption by 20% annually. Additionally, technological advancements in synthetic graphite production and applications in emerging markets present lucrative opportunities. The market's potential is further enhanced by regulatory support for sustainable materials and the ongoing shift towards renewable energy solutions. These factors collectively underscore the Graphite Market's promising future and its critical role in the global transition to cleaner energy technologies.
Graphite Market Segmentation
-
1. Type
- 1.1. Natural Graphite
- 1.2. Synthetic Graphite
-
2. Application
- 2.1. Electrodes
- 2.2. Refractories, Casting, and Foundries
- 2.3. Batteries
- 2.4. Lubricants
- 2.5. Other Applications
-
3. End-user Industry
- 3.1. Electronics
- 3.2. Metallurgy
- 3.3. Automotive (Includes EV/HEV Vehicles)
- 3.4. Other End-user Industries
Graphite Market Segmentation By Geography
-
1. Asia Pacific
- 1.1. China
- 1.2. India
- 1.3. Japan
- 1.4. South Korea
- 1.5. Rest of Asia Pacific
-
2. North America
- 2.1. United States
- 2.2. Canada
- 2.3. Mexico
-
3. Europe
- 3.1. Germany
- 3.2. United Kingdom
- 3.3. Italy
- 3.4. France
- 3.5. Russia
- 3.6. Rest of Europe
-
4. South America
- 4.1. Brazil
- 4.2. Argentina
- 4.3. Rest of South America
-
5. Middle East and Africa
- 5.1. Saudi Arabia
- 5.2. South Africa
- 5.3. Rest of Middle East and Africa
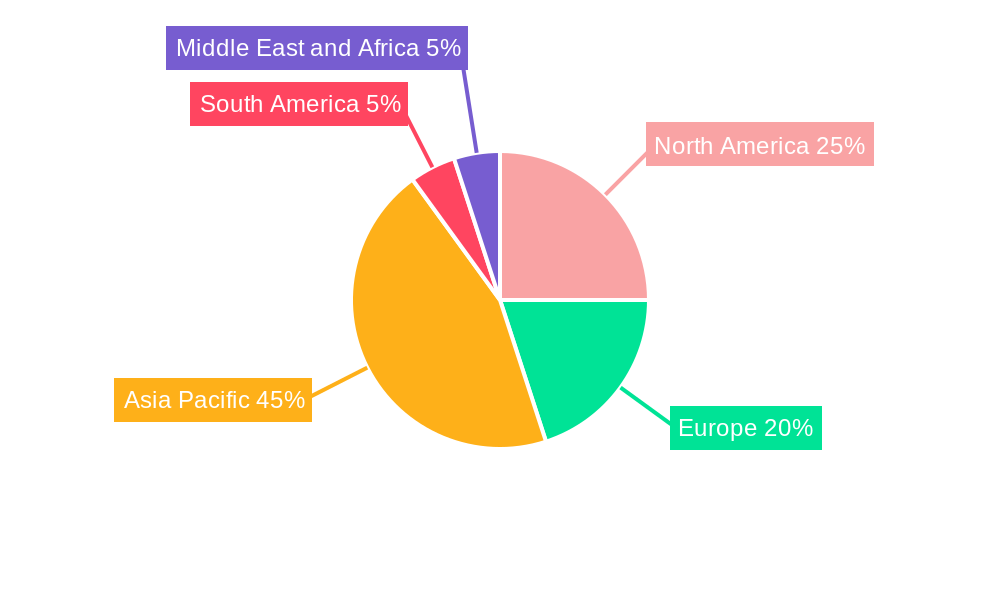
Graphite Market Regional Market Share
Geographic Coverage of Graphite Market
Graphite Market REPORT HIGHLIGHTS
| Aspects | Details |
|---|---|
| Study Period | 2020-2034 |
| Base Year | 2025 |
| Estimated Year | 2026 |
| Forecast Period | 2026-2034 |
| Historical Period | 2020-2025 |
| Growth Rate | CAGR of 8.42% from 2020-2034 |
| Segmentation |
|
Table of Contents
- 1. Introduction
- 1.1. Research Scope
- 1.2. Market Segmentation
- 1.3. Research Objective
- 1.4. Definitions and Assumptions
- 2. Executive Summary
- 2.1. Market Snapshot
- 3. Market Dynamics
- 3.1. Market Drivers
- 3.2. Market Restrains
- 3.3. Market Trends
- 3.4. Market Opportunities
- 4. Market Factor Analysis
- 4.1. Porters Five Forces
- 4.1.1. Bargaining Power of Suppliers
- 4.1.2. Bargaining Power of Buyers
- 4.1.3. Threat of New Entrants
- 4.1.4. Threat of Substitutes
- 4.1.5. Competitive Rivalry
- 4.2. PESTEL analysis
- 4.3. BCG Analysis
- 4.3.1. Stars (High Growth, High Market Share)
- 4.3.2. Cash Cows (Low Growth, High Market Share)
- 4.3.3. Question Mark (High Growth, Low Market Share)
- 4.3.4. Dogs (Low Growth, Low Market Share)
- 4.4. Ansoff Matrix Analysis
- 4.5. Supply Chain Analysis
- 4.6. Regulatory Landscape
- 4.7. Current Market Potential and Opportunity Assessment (TAM–SAM–SOM Framework)
- 4.8. DMV Analyst Note
- 4.1. Porters Five Forces
- 5. Market Analysis, Insights and Forecast 2021-2033
- 5.1. Market Analysis, Insights and Forecast - by Type
- 5.1.1. Natural Graphite
- 5.1.2. Synthetic Graphite
- 5.2. Market Analysis, Insights and Forecast - by Application
- 5.2.1. Electrodes
- 5.2.2. Refractories, Casting, and Foundries
- 5.2.3. Batteries
- 5.2.4. Lubricants
- 5.2.5. Other Applications
- 5.3. Market Analysis, Insights and Forecast - by End-user Industry
- 5.3.1. Electronics
- 5.3.2. Metallurgy
- 5.3.3. Automotive (Includes EV/HEV Vehicles)
- 5.3.4. Other End-user Industries
- 5.4. Market Analysis, Insights and Forecast - by Region
- 5.4.1. Asia Pacific
- 5.4.2. North America
- 5.4.3. Europe
- 5.4.4. South America
- 5.4.5. Middle East and Africa
- 5.1. Market Analysis, Insights and Forecast - by Type
- 6. Global Graphite Market Analysis, Insights and Forecast, 2021-2033
- 6.1. Market Analysis, Insights and Forecast - by Type
- 6.1.1. Natural Graphite
- 6.1.2. Synthetic Graphite
- 6.2. Market Analysis, Insights and Forecast - by Application
- 6.2.1. Electrodes
- 6.2.2. Refractories, Casting, and Foundries
- 6.2.3. Batteries
- 6.2.4. Lubricants
- 6.2.5. Other Applications
- 6.3. Market Analysis, Insights and Forecast - by End-user Industry
- 6.3.1. Electronics
- 6.3.2. Metallurgy
- 6.3.3. Automotive (Includes EV/HEV Vehicles)
- 6.3.4. Other End-user Industries
- 6.1. Market Analysis, Insights and Forecast - by Type
- 7. Asia Pacific Graphite Market Analysis, Insights and Forecast, 2020-2032
- 7.1. Market Analysis, Insights and Forecast - by Type
- 7.1.1. Natural Graphite
- 7.1.2. Synthetic Graphite
- 7.2. Market Analysis, Insights and Forecast - by Application
- 7.2.1. Electrodes
- 7.2.2. Refractories, Casting, and Foundries
- 7.2.3. Batteries
- 7.2.4. Lubricants
- 7.2.5. Other Applications
- 7.3. Market Analysis, Insights and Forecast - by End-user Industry
- 7.3.1. Electronics
- 7.3.2. Metallurgy
- 7.3.3. Automotive (Includes EV/HEV Vehicles)
- 7.3.4. Other End-user Industries
- 7.1. Market Analysis, Insights and Forecast - by Type
- 8. North America Graphite Market Analysis, Insights and Forecast, 2020-2032
- 8.1. Market Analysis, Insights and Forecast - by Type
- 8.1.1. Natural Graphite
- 8.1.2. Synthetic Graphite
- 8.2. Market Analysis, Insights and Forecast - by Application
- 8.2.1. Electrodes
- 8.2.2. Refractories, Casting, and Foundries
- 8.2.3. Batteries
- 8.2.4. Lubricants
- 8.2.5. Other Applications
- 8.3. Market Analysis, Insights and Forecast - by End-user Industry
- 8.3.1. Electronics
- 8.3.2. Metallurgy
- 8.3.3. Automotive (Includes EV/HEV Vehicles)
- 8.3.4. Other End-user Industries
- 8.1. Market Analysis, Insights and Forecast - by Type
- 9. Europe Graphite Market Analysis, Insights and Forecast, 2020-2032
- 9.1. Market Analysis, Insights and Forecast - by Type
- 9.1.1. Natural Graphite
- 9.1.2. Synthetic Graphite
- 9.2. Market Analysis, Insights and Forecast - by Application
- 9.2.1. Electrodes
- 9.2.2. Refractories, Casting, and Foundries
- 9.2.3. Batteries
- 9.2.4. Lubricants
- 9.2.5. Other Applications
- 9.3. Market Analysis, Insights and Forecast - by End-user Industry
- 9.3.1. Electronics
- 9.3.2. Metallurgy
- 9.3.3. Automotive (Includes EV/HEV Vehicles)
- 9.3.4. Other End-user Industries
- 9.1. Market Analysis, Insights and Forecast - by Type
- 10. South America Graphite Market Analysis, Insights and Forecast, 2020-2032
- 10.1. Market Analysis, Insights and Forecast - by Type
- 10.1.1. Natural Graphite
- 10.1.2. Synthetic Graphite
- 10.2. Market Analysis, Insights and Forecast - by Application
- 10.2.1. Electrodes
- 10.2.2. Refractories, Casting, and Foundries
- 10.2.3. Batteries
- 10.2.4. Lubricants
- 10.2.5. Other Applications
- 10.3. Market Analysis, Insights and Forecast - by End-user Industry
- 10.3.1. Electronics
- 10.3.2. Metallurgy
- 10.3.3. Automotive (Includes EV/HEV Vehicles)
- 10.3.4. Other End-user Industries
- 10.1. Market Analysis, Insights and Forecast - by Type
- 11. Middle East and Africa Graphite Market Analysis, Insights and Forecast, 2020-2032
- 11.1. Market Analysis, Insights and Forecast - by Type
- 11.1.1. Natural Graphite
- 11.1.2. Synthetic Graphite
- 11.2. Market Analysis, Insights and Forecast - by Application
- 11.2.1. Electrodes
- 11.2.2. Refractories, Casting, and Foundries
- 11.2.3. Batteries
- 11.2.4. Lubricants
- 11.2.5. Other Applications
- 11.3. Market Analysis, Insights and Forecast - by End-user Industry
- 11.3.1. Electronics
- 11.3.2. Metallurgy
- 11.3.3. Automotive (Includes EV/HEV Vehicles)
- 11.3.4. Other End-user Industries
- 11.1. Market Analysis, Insights and Forecast - by Type
- 12. Competitive Analysis
- 12.1. Company Profiles
- 12.1.1 SGL Carbon
- 12.1.1.1. Company Overview
- 12.1.1.2. Products
- 12.1.1.3. Company Financials
- 12.1.1.4. SWOT Analysis
- 12.1.2 Showa Denko K k
- 12.1.2.1. Company Overview
- 12.1.2.2. Products
- 12.1.2.3. Company Financials
- 12.1.2.4. SWOT Analysis
- 12.1.3 Asbury Carbons
- 12.1.3.1. Company Overview
- 12.1.3.2. Products
- 12.1.3.3. Company Financials
- 12.1.3.4. SWOT Analysis
- 12.1.4 Tokai Carbon Co Ltd
- 12.1.4.1. Company Overview
- 12.1.4.2. Products
- 12.1.4.3. Company Financials
- 12.1.4.4. SWOT Analysis
- 12.1.5 Northern Graphite Corp
- 12.1.5.1. Company Overview
- 12.1.5.2. Products
- 12.1.5.3. Company Financials
- 12.1.5.4. SWOT Analysis
- 12.1.6 Mason Graphite Inc
- 12.1.6.1. Company Overview
- 12.1.6.2. Products
- 12.1.6.3. Company Financials
- 12.1.6.4. SWOT Analysis
- 12.1.7 Triton Minerals
- 12.1.7.1. Company Overview
- 12.1.7.2. Products
- 12.1.7.3. Company Financials
- 12.1.7.4. SWOT Analysis
- 12.1.8 BTR New Material Group Co Ltd
- 12.1.8.1. Company Overview
- 12.1.8.2. Products
- 12.1.8.3. Company Financials
- 12.1.8.4. SWOT Analysis
- 12.1.9 Jiangxi Zichen Technology Co Ltd
- 12.1.9.1. Company Overview
- 12.1.9.2. Products
- 12.1.9.3. Company Financials
- 12.1.9.4. SWOT Analysis
- 12.1.10 Imerys
- 12.1.10.1. Company Overview
- 12.1.10.2. Products
- 12.1.10.3. Company Financials
- 12.1.10.4. SWOT Analysis
- 12.1.11 Shanghai Shanshan Technology Co Ltd
- 12.1.11.1. Company Overview
- 12.1.11.2. Products
- 12.1.11.3. Company Financials
- 12.1.11.4. SWOT Analysis
- 12.1.12 Syrah Resources Limited
- 12.1.12.1. Company Overview
- 12.1.12.2. Products
- 12.1.12.3. Company Financials
- 12.1.12.4. SWOT Analysis
- 12.1.13 Shenzhen Xiangfenghua Technology Co Ltd
- 12.1.13.1. Company Overview
- 12.1.13.2. Products
- 12.1.13.3. Company Financials
- 12.1.13.4. SWOT Analysis
- 12.1.14 Nippon Kokuen Group
- 12.1.14.1. Company Overview
- 12.1.14.2. Products
- 12.1.14.3. Company Financials
- 12.1.14.4. SWOT Analysis
- 12.1.1 SGL Carbon
- 12.2. Market Entropy
- 12.2.1 Company's Key Areas Served
- 12.2.2 Recent Developments
- 12.3. Company Market Share Analysis 2025
- 12.3.1 Top 5 Companies Market Share Analysis
- 12.3.2 Top 3 Companies Market Share Analysis
- 12.4. List of Potential Customers
- 13. Research Methodology
List of Figures
- Figure 1: Global Graphite Market Revenue Breakdown (billion, %) by Region 2025 & 2033
- Figure 2: Global Graphite Market Volume Breakdown (K Tons, %) by Region 2025 & 2033
- Figure 3: Asia Pacific Graphite Market Revenue (billion), by Type 2025 & 2033
- Figure 4: Asia Pacific Graphite Market Volume (K Tons), by Type 2025 & 2033
- Figure 5: Asia Pacific Graphite Market Revenue Share (%), by Type 2025 & 2033
- Figure 6: Asia Pacific Graphite Market Volume Share (%), by Type 2025 & 2033
- Figure 7: Asia Pacific Graphite Market Revenue (billion), by Application 2025 & 2033
- Figure 8: Asia Pacific Graphite Market Volume (K Tons), by Application 2025 & 2033
- Figure 9: Asia Pacific Graphite Market Revenue Share (%), by Application 2025 & 2033
- Figure 10: Asia Pacific Graphite Market Volume Share (%), by Application 2025 & 2033
- Figure 11: Asia Pacific Graphite Market Revenue (billion), by End-user Industry 2025 & 2033
- Figure 12: Asia Pacific Graphite Market Volume (K Tons), by End-user Industry 2025 & 2033
- Figure 13: Asia Pacific Graphite Market Revenue Share (%), by End-user Industry 2025 & 2033
- Figure 14: Asia Pacific Graphite Market Volume Share (%), by End-user Industry 2025 & 2033
- Figure 15: Asia Pacific Graphite Market Revenue (billion), by Country 2025 & 2033
- Figure 16: Asia Pacific Graphite Market Volume (K Tons), by Country 2025 & 2033
- Figure 17: Asia Pacific Graphite Market Revenue Share (%), by Country 2025 & 2033
- Figure 18: Asia Pacific Graphite Market Volume Share (%), by Country 2025 & 2033
- Figure 19: North America Graphite Market Revenue (billion), by Type 2025 & 2033
- Figure 20: North America Graphite Market Volume (K Tons), by Type 2025 & 2033
- Figure 21: North America Graphite Market Revenue Share (%), by Type 2025 & 2033
- Figure 22: North America Graphite Market Volume Share (%), by Type 2025 & 2033
- Figure 23: North America Graphite Market Revenue (billion), by Application 2025 & 2033
- Figure 24: North America Graphite Market Volume (K Tons), by Application 2025 & 2033
- Figure 25: North America Graphite Market Revenue Share (%), by Application 2025 & 2033
- Figure 26: North America Graphite Market Volume Share (%), by Application 2025 & 2033
- Figure 27: North America Graphite Market Revenue (billion), by End-user Industry 2025 & 2033
- Figure 28: North America Graphite Market Volume (K Tons), by End-user Industry 2025 & 2033
- Figure 29: North America Graphite Market Revenue Share (%), by End-user Industry 2025 & 2033
- Figure 30: North America Graphite Market Volume Share (%), by End-user Industry 2025 & 2033
- Figure 31: North America Graphite Market Revenue (billion), by Country 2025 & 2033
- Figure 32: North America Graphite Market Volume (K Tons), by Country 2025 & 2033
- Figure 33: North America Graphite Market Revenue Share (%), by Country 2025 & 2033
- Figure 34: North America Graphite Market Volume Share (%), by Country 2025 & 2033
- Figure 35: Europe Graphite Market Revenue (billion), by Type 2025 & 2033
- Figure 36: Europe Graphite Market Volume (K Tons), by Type 2025 & 2033
- Figure 37: Europe Graphite Market Revenue Share (%), by Type 2025 & 2033
- Figure 38: Europe Graphite Market Volume Share (%), by Type 2025 & 2033
- Figure 39: Europe Graphite Market Revenue (billion), by Application 2025 & 2033
- Figure 40: Europe Graphite Market Volume (K Tons), by Application 2025 & 2033
- Figure 41: Europe Graphite Market Revenue Share (%), by Application 2025 & 2033
- Figure 42: Europe Graphite Market Volume Share (%), by Application 2025 & 2033
- Figure 43: Europe Graphite Market Revenue (billion), by End-user Industry 2025 & 2033
- Figure 44: Europe Graphite Market Volume (K Tons), by End-user Industry 2025 & 2033
- Figure 45: Europe Graphite Market Revenue Share (%), by End-user Industry 2025 & 2033
- Figure 46: Europe Graphite Market Volume Share (%), by End-user Industry 2025 & 2033
- Figure 47: Europe Graphite Market Revenue (billion), by Country 2025 & 2033
- Figure 48: Europe Graphite Market Volume (K Tons), by Country 2025 & 2033
- Figure 49: Europe Graphite Market Revenue Share (%), by Country 2025 & 2033
- Figure 50: Europe Graphite Market Volume Share (%), by Country 2025 & 2033
- Figure 51: South America Graphite Market Revenue (billion), by Type 2025 & 2033
- Figure 52: South America Graphite Market Volume (K Tons), by Type 2025 & 2033
- Figure 53: South America Graphite Market Revenue Share (%), by Type 2025 & 2033
- Figure 54: South America Graphite Market Volume Share (%), by Type 2025 & 2033
- Figure 55: South America Graphite Market Revenue (billion), by Application 2025 & 2033
- Figure 56: South America Graphite Market Volume (K Tons), by Application 2025 & 2033
- Figure 57: South America Graphite Market Revenue Share (%), by Application 2025 & 2033
- Figure 58: South America Graphite Market Volume Share (%), by Application 2025 & 2033
- Figure 59: South America Graphite Market Revenue (billion), by End-user Industry 2025 & 2033
- Figure 60: South America Graphite Market Volume (K Tons), by End-user Industry 2025 & 2033
- Figure 61: South America Graphite Market Revenue Share (%), by End-user Industry 2025 & 2033
- Figure 62: South America Graphite Market Volume Share (%), by End-user Industry 2025 & 2033
- Figure 63: South America Graphite Market Revenue (billion), by Country 2025 & 2033
- Figure 64: South America Graphite Market Volume (K Tons), by Country 2025 & 2033
- Figure 65: South America Graphite Market Revenue Share (%), by Country 2025 & 2033
- Figure 66: South America Graphite Market Volume Share (%), by Country 2025 & 2033
- Figure 67: Middle East and Africa Graphite Market Revenue (billion), by Type 2025 & 2033
- Figure 68: Middle East and Africa Graphite Market Volume (K Tons), by Type 2025 & 2033
- Figure 69: Middle East and Africa Graphite Market Revenue Share (%), by Type 2025 & 2033
- Figure 70: Middle East and Africa Graphite Market Volume Share (%), by Type 2025 & 2033
- Figure 71: Middle East and Africa Graphite Market Revenue (billion), by Application 2025 & 2033
- Figure 72: Middle East and Africa Graphite Market Volume (K Tons), by Application 2025 & 2033
- Figure 73: Middle East and Africa Graphite Market Revenue Share (%), by Application 2025 & 2033
- Figure 74: Middle East and Africa Graphite Market Volume Share (%), by Application 2025 & 2033
- Figure 75: Middle East and Africa Graphite Market Revenue (billion), by End-user Industry 2025 & 2033
- Figure 76: Middle East and Africa Graphite Market Volume (K Tons), by End-user Industry 2025 & 2033
- Figure 77: Middle East and Africa Graphite Market Revenue Share (%), by End-user Industry 2025 & 2033
- Figure 78: Middle East and Africa Graphite Market Volume Share (%), by End-user Industry 2025 & 2033
- Figure 79: Middle East and Africa Graphite Market Revenue (billion), by Country 2025 & 2033
- Figure 80: Middle East and Africa Graphite Market Volume (K Tons), by Country 2025 & 2033
- Figure 81: Middle East and Africa Graphite Market Revenue Share (%), by Country 2025 & 2033
- Figure 82: Middle East and Africa Graphite Market Volume Share (%), by Country 2025 & 2033
List of Tables
- Table 1: Global Graphite Market Revenue billion Forecast, by Type 2020 & 2033
- Table 2: Global Graphite Market Volume K Tons Forecast, by Type 2020 & 2033
- Table 3: Global Graphite Market Revenue billion Forecast, by Application 2020 & 2033
- Table 4: Global Graphite Market Volume K Tons Forecast, by Application 2020 & 2033
- Table 5: Global Graphite Market Revenue billion Forecast, by End-user Industry 2020 & 2033
- Table 6: Global Graphite Market Volume K Tons Forecast, by End-user Industry 2020 & 2033
- Table 7: Global Graphite Market Revenue billion Forecast, by Region 2020 & 2033
- Table 8: Global Graphite Market Volume K Tons Forecast, by Region 2020 & 2033
- Table 9: Global Graphite Market Revenue billion Forecast, by Type 2020 & 2033
- Table 10: Global Graphite Market Volume K Tons Forecast, by Type 2020 & 2033
- Table 11: Global Graphite Market Revenue billion Forecast, by Application 2020 & 2033
- Table 12: Global Graphite Market Volume K Tons Forecast, by Application 2020 & 2033
- Table 13: Global Graphite Market Revenue billion Forecast, by End-user Industry 2020 & 2033
- Table 14: Global Graphite Market Volume K Tons Forecast, by End-user Industry 2020 & 2033
- Table 15: Global Graphite Market Revenue billion Forecast, by Country 2020 & 2033
- Table 16: Global Graphite Market Volume K Tons Forecast, by Country 2020 & 2033
- Table 17: China Graphite Market Revenue (billion) Forecast, by Application 2020 & 2033
- Table 18: China Graphite Market Volume (K Tons) Forecast, by Application 2020 & 2033
- Table 19: India Graphite Market Revenue (billion) Forecast, by Application 2020 & 2033
- Table 20: India Graphite Market Volume (K Tons) Forecast, by Application 2020 & 2033
- Table 21: Japan Graphite Market Revenue (billion) Forecast, by Application 2020 & 2033
- Table 22: Japan Graphite Market Volume (K Tons) Forecast, by Application 2020 & 2033
- Table 23: South Korea Graphite Market Revenue (billion) Forecast, by Application 2020 & 2033
- Table 24: South Korea Graphite Market Volume (K Tons) Forecast, by Application 2020 & 2033
- Table 25: Rest of Asia Pacific Graphite Market Revenue (billion) Forecast, by Application 2020 & 2033
- Table 26: Rest of Asia Pacific Graphite Market Volume (K Tons) Forecast, by Application 2020 & 2033
- Table 27: Global Graphite Market Revenue billion Forecast, by Type 2020 & 2033
- Table 28: Global Graphite Market Volume K Tons Forecast, by Type 2020 & 2033
- Table 29: Global Graphite Market Revenue billion Forecast, by Application 2020 & 2033
- Table 30: Global Graphite Market Volume K Tons Forecast, by Application 2020 & 2033
- Table 31: Global Graphite Market Revenue billion Forecast, by End-user Industry 2020 & 2033
- Table 32: Global Graphite Market Volume K Tons Forecast, by End-user Industry 2020 & 2033
- Table 33: Global Graphite Market Revenue billion Forecast, by Country 2020 & 2033
- Table 34: Global Graphite Market Volume K Tons Forecast, by Country 2020 & 2033
- Table 35: United States Graphite Market Revenue (billion) Forecast, by Application 2020 & 2033
- Table 36: United States Graphite Market Volume (K Tons) Forecast, by Application 2020 & 2033
- Table 37: Canada Graphite Market Revenue (billion) Forecast, by Application 2020 & 2033
- Table 38: Canada Graphite Market Volume (K Tons) Forecast, by Application 2020 & 2033
- Table 39: Mexico Graphite Market Revenue (billion) Forecast, by Application 2020 & 2033
- Table 40: Mexico Graphite Market Volume (K Tons) Forecast, by Application 2020 & 2033
- Table 41: Global Graphite Market Revenue billion Forecast, by Type 2020 & 2033
- Table 42: Global Graphite Market Volume K Tons Forecast, by Type 2020 & 2033
- Table 43: Global Graphite Market Revenue billion Forecast, by Application 2020 & 2033
- Table 44: Global Graphite Market Volume K Tons Forecast, by Application 2020 & 2033
- Table 45: Global Graphite Market Revenue billion Forecast, by End-user Industry 2020 & 2033
- Table 46: Global Graphite Market Volume K Tons Forecast, by End-user Industry 2020 & 2033
- Table 47: Global Graphite Market Revenue billion Forecast, by Country 2020 & 2033
- Table 48: Global Graphite Market Volume K Tons Forecast, by Country 2020 & 2033
- Table 49: Germany Graphite Market Revenue (billion) Forecast, by Application 2020 & 2033
- Table 50: Germany Graphite Market Volume (K Tons) Forecast, by Application 2020 & 2033
- Table 51: United Kingdom Graphite Market Revenue (billion) Forecast, by Application 2020 & 2033
- Table 52: United Kingdom Graphite Market Volume (K Tons) Forecast, by Application 2020 & 2033
- Table 53: Italy Graphite Market Revenue (billion) Forecast, by Application 2020 & 2033
- Table 54: Italy Graphite Market Volume (K Tons) Forecast, by Application 2020 & 2033
- Table 55: France Graphite Market Revenue (billion) Forecast, by Application 2020 & 2033
- Table 56: France Graphite Market Volume (K Tons) Forecast, by Application 2020 & 2033
- Table 57: Russia Graphite Market Revenue (billion) Forecast, by Application 2020 & 2033
- Table 58: Russia Graphite Market Volume (K Tons) Forecast, by Application 2020 & 2033
- Table 59: Rest of Europe Graphite Market Revenue (billion) Forecast, by Application 2020 & 2033
- Table 60: Rest of Europe Graphite Market Volume (K Tons) Forecast, by Application 2020 & 2033
- Table 61: Global Graphite Market Revenue billion Forecast, by Type 2020 & 2033
- Table 62: Global Graphite Market Volume K Tons Forecast, by Type 2020 & 2033
- Table 63: Global Graphite Market Revenue billion Forecast, by Application 2020 & 2033
- Table 64: Global Graphite Market Volume K Tons Forecast, by Application 2020 & 2033
- Table 65: Global Graphite Market Revenue billion Forecast, by End-user Industry 2020 & 2033
- Table 66: Global Graphite Market Volume K Tons Forecast, by End-user Industry 2020 & 2033
- Table 67: Global Graphite Market Revenue billion Forecast, by Country 2020 & 2033
- Table 68: Global Graphite Market Volume K Tons Forecast, by Country 2020 & 2033
- Table 69: Brazil Graphite Market Revenue (billion) Forecast, by Application 2020 & 2033
- Table 70: Brazil Graphite Market Volume (K Tons) Forecast, by Application 2020 & 2033
- Table 71: Argentina Graphite Market Revenue (billion) Forecast, by Application 2020 & 2033
- Table 72: Argentina Graphite Market Volume (K Tons) Forecast, by Application 2020 & 2033
- Table 73: Rest of South America Graphite Market Revenue (billion) Forecast, by Application 2020 & 2033
- Table 74: Rest of South America Graphite Market Volume (K Tons) Forecast, by Application 2020 & 2033
- Table 75: Global Graphite Market Revenue billion Forecast, by Type 2020 & 2033
- Table 76: Global Graphite Market Volume K Tons Forecast, by Type 2020 & 2033
- Table 77: Global Graphite Market Revenue billion Forecast, by Application 2020 & 2033
- Table 78: Global Graphite Market Volume K Tons Forecast, by Application 2020 & 2033
- Table 79: Global Graphite Market Revenue billion Forecast, by End-user Industry 2020 & 2033
- Table 80: Global Graphite Market Volume K Tons Forecast, by End-user Industry 2020 & 2033
- Table 81: Global Graphite Market Revenue billion Forecast, by Country 2020 & 2033
- Table 82: Global Graphite Market Volume K Tons Forecast, by Country 2020 & 2033
- Table 83: Saudi Arabia Graphite Market Revenue (billion) Forecast, by Application 2020 & 2033
- Table 84: Saudi Arabia Graphite Market Volume (K Tons) Forecast, by Application 2020 & 2033
- Table 85: South Africa Graphite Market Revenue (billion) Forecast, by Application 2020 & 2033
- Table 86: South Africa Graphite Market Volume (K Tons) Forecast, by Application 2020 & 2033
- Table 87: Rest of Middle East and Africa Graphite Market Revenue (billion) Forecast, by Application 2020 & 2033
- Table 88: Rest of Middle East and Africa Graphite Market Volume (K Tons) Forecast, by Application 2020 & 2033
Frequently Asked Questions
1. What is the projected Compound Annual Growth Rate (CAGR) of the Graphite Market?
The projected CAGR is approximately 8.42%.
2. Which companies are prominent players in the Graphite Market?
Key companies in the market include SGL Carbon, Showa Denko K k, Asbury Carbons, Tokai Carbon Co Ltd, Northern Graphite Corp, Mason Graphite Inc, Triton Minerals, BTR New Material Group Co Ltd, Jiangxi Zichen Technology Co Ltd, Imerys, Shanghai Shanshan Technology Co Ltd, Syrah Resources Limited, Shenzhen Xiangfenghua Technology Co Ltd, Nippon Kokuen Group.
3. What are the main segments of the Graphite Market?
The market segments include Type, Application, End-user Industry.
4. Can you provide details about the market size?
The market size is estimated to be USD 31.59 billion as of 2022.
5. What are some drivers contributing to market growth?
Augmenting Demand from the Burgeoning Lithium-ion Battery Industry; Increase In Steel Production in Asia and the Middle East.
6. What are the notable trends driving market growth?
The Metallurgy Segment is Expected to Dominate the Market.
7. Are there any restraints impacting market growth?
Stringent Environmental Regulations; Other Restraints.
8. Can you provide examples of recent developments in the market?
October 2022: Syrah Resources Ltd. announced it would supply a key lithium-ion battery component to South Korea's LG Energy Solution Ltd. According to the agreement, the company was to provide 2 kilotons per annum of graphite to LG Energy Solution Ltd. active anode material (AAM) from 2025 and increase it to at least 10 ktpa after its production capacity at its Vidalia facility in Louisiana.
9. What pricing options are available for accessing the report?
Pricing options include single-user, multi-user, and enterprise licenses priced at USD 4750, USD 5250, and USD 8750 respectively.
10. Is the market size provided in terms of value or volume?
The market size is provided in terms of value, measured in billion and volume, measured in K Tons.
11. Are there any specific market keywords associated with the report?
Yes, the market keyword associated with the report is "Graphite Market," which aids in identifying and referencing the specific market segment covered.
12. How do I determine which pricing option suits my needs best?
The pricing options vary based on user requirements and access needs. Individual users may opt for single-user licenses, while businesses requiring broader access may choose multi-user or enterprise licenses for cost-effective access to the report.
13. Are there any additional resources or data provided in the Graphite Market report?
While the report offers comprehensive insights, it's advisable to review the specific contents or supplementary materials provided to ascertain if additional resources or data are available.
14. How can I stay updated on further developments or reports in the Graphite Market?
To stay informed about further developments, trends, and reports in the Graphite Market, consider subscribing to industry newsletters, following relevant companies and organizations, or regularly checking reputable industry news sources and publications.
Methodology
Step 1 - Identification of Relevant Samples Size from Population Database


Step 2 - Approaches for Defining Global Market Size (Value, Volume* & Price*)

Note*: In applicable scenarios
Step 3 - Data Sources
Primary Research
- Web Analytics
- Survey Reports
- Research Institute
- Latest Research Reports
- Opinion Leaders
Secondary Research
- Annual Reports
- White Paper
- Latest Press Release
- Industry Association
- Paid Database
- Investor Presentations

Step 4 - Data Triangulation
Involves using different sources of information in order to increase the validity of a study
These sources are likely to be stakeholders in a program - participants, other researchers, program staff, other community members, and so on.
Then we put all data in single framework & apply various statistical tools to find out the dynamic on the market.
During the analysis stage, feedback from the stakeholder groups would be compared to determine areas of agreement as well as areas of divergence