

Key Insights
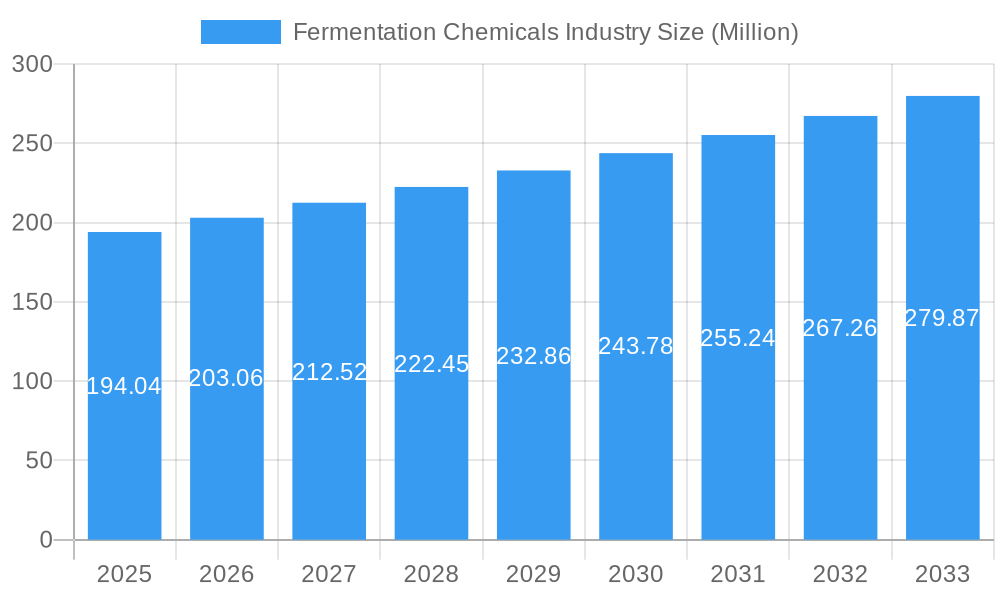
The global fermentation chemicals market, valued at $194.04 million in 2025, is projected to experience robust growth, driven by rising demand across diverse sectors. A Compound Annual Growth Rate (CAGR) of 4.60% from 2025 to 2033 indicates a significant expansion, fueled primarily by the increasing adoption of fermentation-based processes in the food and beverage, pharmaceutical, and industrial sectors. The growing preference for natural and sustainable ingredients in food products and the rising demand for bio-based materials in the plastics and fibers industry are key contributors to market expansion. Furthermore, advancements in fermentation technologies, leading to higher yields and efficiencies, are further stimulating market growth. The segment comprising alcohols, organic acids, and enzymes dominates the product type landscape due to their wide applications. Geographically, the Asia-Pacific region, particularly China and India, is expected to exhibit significant growth potential due to increasing industrialization and rising disposable incomes, leading to higher consumer spending on food and beverages.
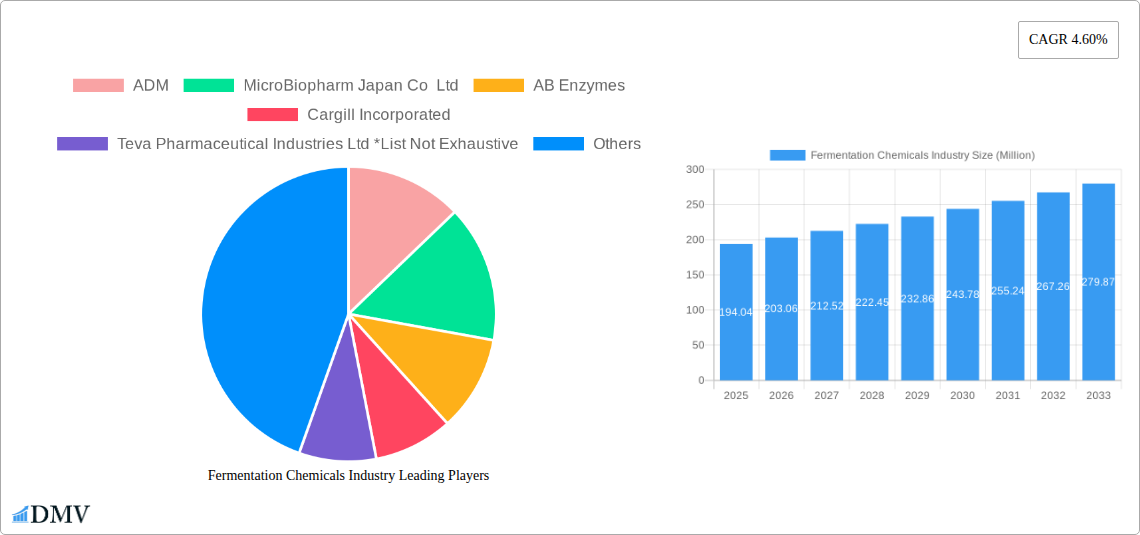
Fermentation Chemicals Industry Market Size (In Million)
However, certain challenges may restrain market growth. Fluctuations in raw material prices, stringent regulatory frameworks governing the use of fermentation-derived products in certain applications, and potential competition from chemically synthesized alternatives could act as impediments. Nevertheless, ongoing research and development efforts focused on optimizing fermentation processes, exploring new applications, and enhancing product safety and efficacy are expected to mitigate these challenges and sustain the market's overall positive trajectory. Key players such as ADM, Cargill, Novozymes, and BASF are strategically investing in expanding their production capacities, strengthening their R&D efforts, and focusing on developing innovative products to meet the evolving market demands. This dynamic interplay of growth drivers and potential restraints ensures a complex but promising outlook for the fermentation chemicals industry over the forecast period.
Fermentation Chemicals Industry Company Market Share
Fermentation Chemicals Industry Market Report: 2019-2033
This comprehensive report provides an in-depth analysis of the global Fermentation Chemicals market, offering valuable insights for stakeholders seeking to understand its current state, future trajectory, and key players. With a study period spanning 2019-2033, a base year of 2025, and a forecast period of 2025-2033, this report leverages rigorous data analysis to paint a clear picture of this dynamic industry. The market size in 2025 is estimated at $XX Million, with significant growth projected throughout the forecast period.
Fermentation Chemicals Industry Market Composition & Trends
The global fermentation chemicals market, valued at $XX Million in 2025, exhibits a moderately concentrated structure with key players like ADM, Cargill Incorporated, and Novozymes holding significant market share. Innovation is driven by the increasing demand for sustainable and bio-based solutions across various industries. Stringent regulatory landscapes, particularly concerning food safety and environmental impact, shape market dynamics. Substitute products, including chemically synthesized alternatives, pose competitive challenges. End-users span diverse sectors, including food and beverage, pharmaceuticals, and industrial applications. Mergers and acquisitions (M&A) activity is moderate, with deal values ranging from $XX Million to $XX Million in recent years. Key M&A activities have focused on expanding product portfolios and geographic reach.
- Market Share Distribution (2025): ADM (XX%), Cargill (XX%), Novozymes (XX%), Others (XX%).
- Average M&A Deal Value (2019-2024): $XX Million
- Key M&A Trends: Expansion into new geographical markets and diversification of product offerings.
Fermentation Chemicals Industry Evolution
The fermentation chemicals market has experienced substantial growth over the historical period (2019-2024), driven primarily by increasing demand from the food and beverage, pharmaceutical, and industrial sectors. Technological advancements, such as improved fermentation processes and enzyme engineering, have enhanced production efficiency and product quality. Shifting consumer preferences towards natural and sustainable products have further fueled market expansion. The market witnessed a Compound Annual Growth Rate (CAGR) of XX% during 2019-2024 and is projected to grow at a CAGR of XX% from 2025 to 2033. The adoption rate of advanced fermentation technologies is increasing steadily, with XX% of manufacturers adopting these technologies in 2024. This adoption rate is expected to reach XX% by 2033. This evolution is also reflected in the growing investment in R&D for novel fermentation processes and products.
Leading Regions, Countries, or Segments in Fermentation Chemicals Industry
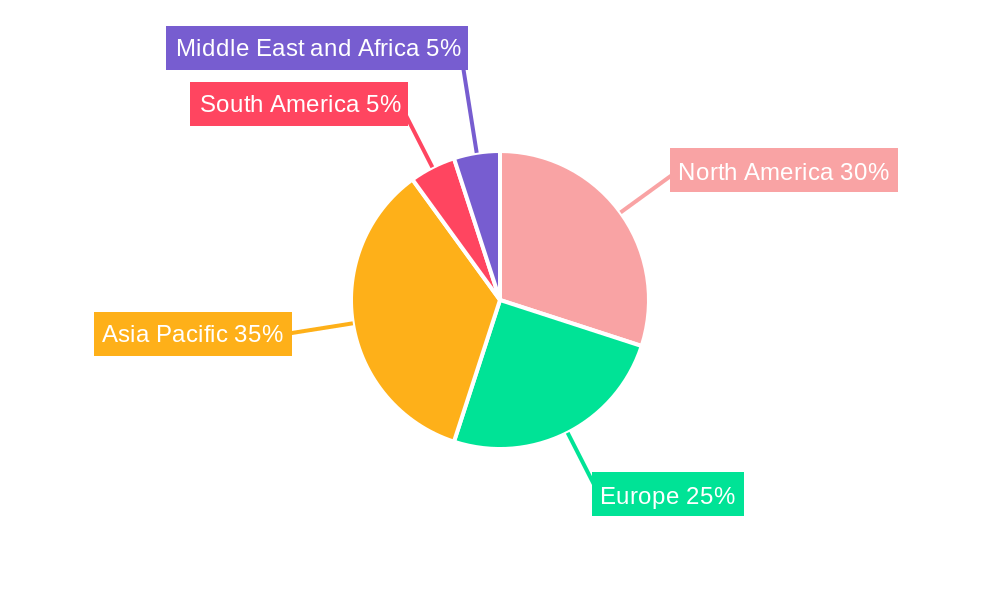
The North American region currently dominates the global fermentation chemicals market, driven by robust demand from the pharmaceutical and food & beverage sectors. Strong regulatory support and substantial investments in biotechnology research and development further contribute to this dominance. Within product types, enzymes hold the largest market share, fueled by their wide application in diverse industries. In terms of applications, the pharmaceutical and nutritional segments show significant growth potential.
- Key Drivers for North American Dominance:
- Strong regulatory frameworks supporting bio-based products.
- High R&D investment in biotechnology.
- Large and diverse end-user base in food & beverage and pharmaceuticals.
- High Growth Segments: Enzymes (Product Type), Pharmaceutical & Nutritional (Application)
Fermentation Chemicals Industry Product Innovations
The Fermentation Chemicals Industry is experiencing a dynamic period of innovation, driven by a focus on sustainability and enhanced functionality. Recent breakthroughs center on the development of next-generation enzymes engineered for superior stability and amplified catalytic efficiency. These advanced biocatalysts are crucial for meeting the escalating global demand for environmentally responsible solutions across a multitude of sectors. Furthermore, the industry is seeing the emergence of novel alcohols and organic acids, meticulously produced through meticulously optimized fermentation pathways. These new compounds boast not only improved performance characteristics but also a significantly reduced environmental footprint. A key advancement lies in the creation of highly tailored fermentation technologies designed for specific end-use applications, leading to substantial improvements in product yields and a notable reduction in overall production costs.
Propelling Factors for Fermentation Chemicals Industry Growth
The robust expansion of the fermentation chemicals market is being propelled by a confluence of powerful drivers. Continued technological advancements in fermentation processes are consistently leading to enhanced efficiency, increased productivity, and more cost-effective production. The insatiable and growing demand from rapidly expanding sectors, particularly in the realms of bioplastics and biofuels, represents a cornerstone of this market's growth trajectory. Moreover, supportive government policies and attractive incentives designed to champion the adoption and utilization of bio-based products are acting as significant catalysts, further accelerating market expansion and encouraging investment.
Obstacles in the Fermentation Chemicals Industry Market
The fermentation chemicals market faces several challenges. Stringent regulatory approvals for new products can lead to delays in market entry. Supply chain disruptions, particularly regarding raw materials, can impact production and profitability. Intense competition from established players and emerging market entrants necessitates continuous innovation and cost optimization strategies. These factors could collectively reduce market growth by an estimated XX% over the forecast period.
Future Opportunities in Fermentation Chemicals Industry
The horizon for the Fermentation Chemicals Industry is replete with exciting future opportunities. Significant potential lies in the pioneering development of novel fermentation chemicals specifically designed for highly specialized applications, including the burgeoning fields of personalized medicine and the creation of advanced materials with unique properties. The strategic expansion into currently untapped markets, with a particular emphasis on high-growth developing economies, presents a substantial avenue for future expansion and profitability. The seamless integration of cutting-edge technologies, such as artificial intelligence (AI) and machine learning (ML), holds immense promise for further refining and optimizing fermentation processes, thereby accelerating product development cycles and unlocking new possibilities.
Major Players in the Fermentation Chemicals Industry Ecosystem
- ADM
- MicroBiopharm Japan Co Ltd
- AB Enzymes
- Cargill Incorporated
- Teva Pharmaceutical Industries Ltd
- BioVectra
- Novozymes
- Evonik Industries AG
- Ajinomoto Co Inc
- Chr Hansen Holding A/S
- BASF SE
- Biocon
- DSM
- Novasep
- Lonza
Key Developments in Fermentation Chemicals Industry Industry
- 2022 Q3: Novozymes unveiled a groundbreaking new enzyme specifically engineered to optimize and improve biofuel production processes.
- 2023 Q1: ADM and Cargill announced a strategic joint venture aimed at significantly expanding their production capacity for essential organic acids.
- 2024 Q2: BASF made a substantial investment of $XX Million in a state-of-the-art new fermentation facility dedicated to the production of high-value specialty chemicals. (Further detailed information regarding this investment and its strategic implications will be elaborated upon in the comprehensive report.)
Strategic Fermentation Chemicals Industry Market Forecast
The fermentation chemicals market is poised for robust growth over the forecast period, driven by technological advancements, increasing demand from key industries, and supportive regulatory environments. Emerging applications in bio-based materials and personalized medicine present significant opportunities. The market is expected to reach $XX Million by 2033, driven primarily by increased adoption of sustainable products and technologies. Continued innovation and strategic partnerships will be crucial for sustained success in this competitive landscape.
Fermentation Chemicals Industry Segmentation
-
1. Product Type
- 1.1. Alcohols
- 1.2. Organic Acids
- 1.3. Enzymes
- 1.4. Other Product Types
-
2. Application
- 2.1. Industrial
- 2.2. Food and Beverage
- 2.3. Pharmaceutical and Nutritional
- 2.4. Plastics and Fibers
- 2.5. Other Applications
Fermentation Chemicals Industry Segmentation By Geography
-
1. Asia Pacific
- 1.1. China
- 1.2. India
- 1.3. Japan
- 1.4. South Korea
- 1.5. ASEAN Countries
- 1.6. Rest of Asia Pacific
-
2. North America
- 2.1. United States
- 2.2. Canada
- 2.3. Mexico
-
3. Europe
- 3.1. Germany
- 3.2. United Kingdom
- 3.3. Italy
- 3.4. France
- 3.5. Rest of Europe
-
4. South America
- 4.1. Brazil
- 4.2. Argentina
- 4.3. Rest of South America
-
5. Middle East and Africa
- 5.1. Saudi Arabia
- 5.2. South Africa
- 5.3. Rest of Middle East and Africa
Fermentation Chemicals Industry Regional Market Share
Geographic Coverage of Fermentation Chemicals Industry
Fermentation Chemicals Industry REPORT HIGHLIGHTS
| Aspects | Details |
|---|---|
| Study Period | 2020-2034 |
| Base Year | 2025 |
| Estimated Year | 2026 |
| Forecast Period | 2026-2034 |
| Historical Period | 2020-2025 |
| Growth Rate | CAGR of 4.60% from 2020-2034 |
| Segmentation |
|
Table of Contents
- 1. Introduction
- 1.1. Research Scope
- 1.2. Market Segmentation
- 1.3. Research Objective
- 1.4. Definitions and Assumptions
- 2. Executive Summary
- 2.1. Market Snapshot
- 3. Market Dynamics
- 3.1. Market Drivers
- 3.2. Market Restrains
- 3.3. Market Trends
- 3.4. Market Opportunities
- 4. Market Factor Analysis
- 4.1. Porters Five Forces
- 4.1.1. Bargaining Power of Suppliers
- 4.1.2. Bargaining Power of Buyers
- 4.1.3. Threat of New Entrants
- 4.1.4. Threat of Substitutes
- 4.1.5. Competitive Rivalry
- 4.2. PESTEL analysis
- 4.3. BCG Analysis
- 4.3.1. Stars (High Growth, High Market Share)
- 4.3.2. Cash Cows (Low Growth, High Market Share)
- 4.3.3. Question Mark (High Growth, Low Market Share)
- 4.3.4. Dogs (Low Growth, Low Market Share)
- 4.4. Ansoff Matrix Analysis
- 4.5. Supply Chain Analysis
- 4.6. Regulatory Landscape
- 4.7. Current Market Potential and Opportunity Assessment (TAM–SAM–SOM Framework)
- 4.8. DMV Analyst Note
- 4.1. Porters Five Forces
- 5. Market Analysis, Insights and Forecast 2021-2033
- 5.1. Market Analysis, Insights and Forecast - by Product Type
- 5.1.1. Alcohols
- 5.1.2. Organic Acids
- 5.1.3. Enzymes
- 5.1.4. Other Product Types
- 5.2. Market Analysis, Insights and Forecast - by Application
- 5.2.1. Industrial
- 5.2.2. Food and Beverage
- 5.2.3. Pharmaceutical and Nutritional
- 5.2.4. Plastics and Fibers
- 5.2.5. Other Applications
- 5.3. Market Analysis, Insights and Forecast - by Region
- 5.3.1. Asia Pacific
- 5.3.2. North America
- 5.3.3. Europe
- 5.3.4. South America
- 5.3.5. Middle East and Africa
- 5.1. Market Analysis, Insights and Forecast - by Product Type
- 6. Global Fermentation Chemicals Industry Analysis, Insights and Forecast, 2021-2033
- 6.1. Market Analysis, Insights and Forecast - by Product Type
- 6.1.1. Alcohols
- 6.1.2. Organic Acids
- 6.1.3. Enzymes
- 6.1.4. Other Product Types
- 6.2. Market Analysis, Insights and Forecast - by Application
- 6.2.1. Industrial
- 6.2.2. Food and Beverage
- 6.2.3. Pharmaceutical and Nutritional
- 6.2.4. Plastics and Fibers
- 6.2.5. Other Applications
- 6.1. Market Analysis, Insights and Forecast - by Product Type
- 7. Asia Pacific Fermentation Chemicals Industry Analysis, Insights and Forecast, 2020-2032
- 7.1. Market Analysis, Insights and Forecast - by Product Type
- 7.1.1. Alcohols
- 7.1.2. Organic Acids
- 7.1.3. Enzymes
- 7.1.4. Other Product Types
- 7.2. Market Analysis, Insights and Forecast - by Application
- 7.2.1. Industrial
- 7.2.2. Food and Beverage
- 7.2.3. Pharmaceutical and Nutritional
- 7.2.4. Plastics and Fibers
- 7.2.5. Other Applications
- 7.1. Market Analysis, Insights and Forecast - by Product Type
- 8. North America Fermentation Chemicals Industry Analysis, Insights and Forecast, 2020-2032
- 8.1. Market Analysis, Insights and Forecast - by Product Type
- 8.1.1. Alcohols
- 8.1.2. Organic Acids
- 8.1.3. Enzymes
- 8.1.4. Other Product Types
- 8.2. Market Analysis, Insights and Forecast - by Application
- 8.2.1. Industrial
- 8.2.2. Food and Beverage
- 8.2.3. Pharmaceutical and Nutritional
- 8.2.4. Plastics and Fibers
- 8.2.5. Other Applications
- 8.1. Market Analysis, Insights and Forecast - by Product Type
- 9. Europe Fermentation Chemicals Industry Analysis, Insights and Forecast, 2020-2032
- 9.1. Market Analysis, Insights and Forecast - by Product Type
- 9.1.1. Alcohols
- 9.1.2. Organic Acids
- 9.1.3. Enzymes
- 9.1.4. Other Product Types
- 9.2. Market Analysis, Insights and Forecast - by Application
- 9.2.1. Industrial
- 9.2.2. Food and Beverage
- 9.2.3. Pharmaceutical and Nutritional
- 9.2.4. Plastics and Fibers
- 9.2.5. Other Applications
- 9.1. Market Analysis, Insights and Forecast - by Product Type
- 10. South America Fermentation Chemicals Industry Analysis, Insights and Forecast, 2020-2032
- 10.1. Market Analysis, Insights and Forecast - by Product Type
- 10.1.1. Alcohols
- 10.1.2. Organic Acids
- 10.1.3. Enzymes
- 10.1.4. Other Product Types
- 10.2. Market Analysis, Insights and Forecast - by Application
- 10.2.1. Industrial
- 10.2.2. Food and Beverage
- 10.2.3. Pharmaceutical and Nutritional
- 10.2.4. Plastics and Fibers
- 10.2.5. Other Applications
- 10.1. Market Analysis, Insights and Forecast - by Product Type
- 11. Middle East and Africa Fermentation Chemicals Industry Analysis, Insights and Forecast, 2020-2032
- 11.1. Market Analysis, Insights and Forecast - by Product Type
- 11.1.1. Alcohols
- 11.1.2. Organic Acids
- 11.1.3. Enzymes
- 11.1.4. Other Product Types
- 11.2. Market Analysis, Insights and Forecast - by Application
- 11.2.1. Industrial
- 11.2.2. Food and Beverage
- 11.2.3. Pharmaceutical and Nutritional
- 11.2.4. Plastics and Fibers
- 11.2.5. Other Applications
- 11.1. Market Analysis, Insights and Forecast - by Product Type
- 12. Competitive Analysis
- 12.1. Company Profiles
- 12.1.1 ADM
- 12.1.1.1. Company Overview
- 12.1.1.2. Products
- 12.1.1.3. Company Financials
- 12.1.1.4. SWOT Analysis
- 12.1.2 MicroBiopharm Japan Co Ltd
- 12.1.2.1. Company Overview
- 12.1.2.2. Products
- 12.1.2.3. Company Financials
- 12.1.2.4. SWOT Analysis
- 12.1.3 AB Enzymes
- 12.1.3.1. Company Overview
- 12.1.3.2. Products
- 12.1.3.3. Company Financials
- 12.1.3.4. SWOT Analysis
- 12.1.4 Cargill Incorporated
- 12.1.4.1. Company Overview
- 12.1.4.2. Products
- 12.1.4.3. Company Financials
- 12.1.4.4. SWOT Analysis
- 12.1.5 Teva Pharmaceutical Industries Ltd *List Not Exhaustive
- 12.1.5.1. Company Overview
- 12.1.5.2. Products
- 12.1.5.3. Company Financials
- 12.1.5.4. SWOT Analysis
- 12.1.6 BioVectra
- 12.1.6.1. Company Overview
- 12.1.6.2. Products
- 12.1.6.3. Company Financials
- 12.1.6.4. SWOT Analysis
- 12.1.7 Novozymes
- 12.1.7.1. Company Overview
- 12.1.7.2. Products
- 12.1.7.3. Company Financials
- 12.1.7.4. SWOT Analysis
- 12.1.8 Evonik Industries AG
- 12.1.8.1. Company Overview
- 12.1.8.2. Products
- 12.1.8.3. Company Financials
- 12.1.8.4. SWOT Analysis
- 12.1.9 Ajinomoto Co Inc
- 12.1.9.1. Company Overview
- 12.1.9.2. Products
- 12.1.9.3. Company Financials
- 12.1.9.4. SWOT Analysis
- 12.1.10 Chr Hansen Holding A/S
- 12.1.10.1. Company Overview
- 12.1.10.2. Products
- 12.1.10.3. Company Financials
- 12.1.10.4. SWOT Analysis
- 12.1.11 BASF SE
- 12.1.11.1. Company Overview
- 12.1.11.2. Products
- 12.1.11.3. Company Financials
- 12.1.11.4. SWOT Analysis
- 12.1.12 Biocon
- 12.1.12.1. Company Overview
- 12.1.12.2. Products
- 12.1.12.3. Company Financials
- 12.1.12.4. SWOT Analysis
- 12.1.13 DSM
- 12.1.13.1. Company Overview
- 12.1.13.2. Products
- 12.1.13.3. Company Financials
- 12.1.13.4. SWOT Analysis
- 12.1.14 Novasep
- 12.1.14.1. Company Overview
- 12.1.14.2. Products
- 12.1.14.3. Company Financials
- 12.1.14.4. SWOT Analysis
- 12.1.15 Lonza
- 12.1.15.1. Company Overview
- 12.1.15.2. Products
- 12.1.15.3. Company Financials
- 12.1.15.4. SWOT Analysis
- 12.1.1 ADM
- 12.2. Market Entropy
- 12.2.1 Company's Key Areas Served
- 12.2.2 Recent Developments
- 12.3. Company Market Share Analysis 2025
- 12.3.1 Top 5 Companies Market Share Analysis
- 12.3.2 Top 3 Companies Market Share Analysis
- 12.4. List of Potential Customers
- 13. Research Methodology
List of Figures
- Figure 1: Global Fermentation Chemicals Industry Revenue Breakdown (Million, %) by Region 2025 & 2033
- Figure 2: Asia Pacific Fermentation Chemicals Industry Revenue (Million), by Product Type 2025 & 2033
- Figure 3: Asia Pacific Fermentation Chemicals Industry Revenue Share (%), by Product Type 2025 & 2033
- Figure 4: Asia Pacific Fermentation Chemicals Industry Revenue (Million), by Application 2025 & 2033
- Figure 5: Asia Pacific Fermentation Chemicals Industry Revenue Share (%), by Application 2025 & 2033
- Figure 6: Asia Pacific Fermentation Chemicals Industry Revenue (Million), by Country 2025 & 2033
- Figure 7: Asia Pacific Fermentation Chemicals Industry Revenue Share (%), by Country 2025 & 2033
- Figure 8: North America Fermentation Chemicals Industry Revenue (Million), by Product Type 2025 & 2033
- Figure 9: North America Fermentation Chemicals Industry Revenue Share (%), by Product Type 2025 & 2033
- Figure 10: North America Fermentation Chemicals Industry Revenue (Million), by Application 2025 & 2033
- Figure 11: North America Fermentation Chemicals Industry Revenue Share (%), by Application 2025 & 2033
- Figure 12: North America Fermentation Chemicals Industry Revenue (Million), by Country 2025 & 2033
- Figure 13: North America Fermentation Chemicals Industry Revenue Share (%), by Country 2025 & 2033
- Figure 14: Europe Fermentation Chemicals Industry Revenue (Million), by Product Type 2025 & 2033
- Figure 15: Europe Fermentation Chemicals Industry Revenue Share (%), by Product Type 2025 & 2033
- Figure 16: Europe Fermentation Chemicals Industry Revenue (Million), by Application 2025 & 2033
- Figure 17: Europe Fermentation Chemicals Industry Revenue Share (%), by Application 2025 & 2033
- Figure 18: Europe Fermentation Chemicals Industry Revenue (Million), by Country 2025 & 2033
- Figure 19: Europe Fermentation Chemicals Industry Revenue Share (%), by Country 2025 & 2033
- Figure 20: South America Fermentation Chemicals Industry Revenue (Million), by Product Type 2025 & 2033
- Figure 21: South America Fermentation Chemicals Industry Revenue Share (%), by Product Type 2025 & 2033
- Figure 22: South America Fermentation Chemicals Industry Revenue (Million), by Application 2025 & 2033
- Figure 23: South America Fermentation Chemicals Industry Revenue Share (%), by Application 2025 & 2033
- Figure 24: South America Fermentation Chemicals Industry Revenue (Million), by Country 2025 & 2033
- Figure 25: South America Fermentation Chemicals Industry Revenue Share (%), by Country 2025 & 2033
- Figure 26: Middle East and Africa Fermentation Chemicals Industry Revenue (Million), by Product Type 2025 & 2033
- Figure 27: Middle East and Africa Fermentation Chemicals Industry Revenue Share (%), by Product Type 2025 & 2033
- Figure 28: Middle East and Africa Fermentation Chemicals Industry Revenue (Million), by Application 2025 & 2033
- Figure 29: Middle East and Africa Fermentation Chemicals Industry Revenue Share (%), by Application 2025 & 2033
- Figure 30: Middle East and Africa Fermentation Chemicals Industry Revenue (Million), by Country 2025 & 2033
- Figure 31: Middle East and Africa Fermentation Chemicals Industry Revenue Share (%), by Country 2025 & 2033
List of Tables
- Table 1: Global Fermentation Chemicals Industry Revenue Million Forecast, by Product Type 2020 & 2033
- Table 2: Global Fermentation Chemicals Industry Revenue Million Forecast, by Application 2020 & 2033
- Table 3: Global Fermentation Chemicals Industry Revenue Million Forecast, by Region 2020 & 2033
- Table 4: Global Fermentation Chemicals Industry Revenue Million Forecast, by Product Type 2020 & 2033
- Table 5: Global Fermentation Chemicals Industry Revenue Million Forecast, by Application 2020 & 2033
- Table 6: Global Fermentation Chemicals Industry Revenue Million Forecast, by Country 2020 & 2033
- Table 7: China Fermentation Chemicals Industry Revenue (Million) Forecast, by Application 2020 & 2033
- Table 8: India Fermentation Chemicals Industry Revenue (Million) Forecast, by Application 2020 & 2033
- Table 9: Japan Fermentation Chemicals Industry Revenue (Million) Forecast, by Application 2020 & 2033
- Table 10: South Korea Fermentation Chemicals Industry Revenue (Million) Forecast, by Application 2020 & 2033
- Table 11: ASEAN Countries Fermentation Chemicals Industry Revenue (Million) Forecast, by Application 2020 & 2033
- Table 12: Rest of Asia Pacific Fermentation Chemicals Industry Revenue (Million) Forecast, by Application 2020 & 2033
- Table 13: Global Fermentation Chemicals Industry Revenue Million Forecast, by Product Type 2020 & 2033
- Table 14: Global Fermentation Chemicals Industry Revenue Million Forecast, by Application 2020 & 2033
- Table 15: Global Fermentation Chemicals Industry Revenue Million Forecast, by Country 2020 & 2033
- Table 16: United States Fermentation Chemicals Industry Revenue (Million) Forecast, by Application 2020 & 2033
- Table 17: Canada Fermentation Chemicals Industry Revenue (Million) Forecast, by Application 2020 & 2033
- Table 18: Mexico Fermentation Chemicals Industry Revenue (Million) Forecast, by Application 2020 & 2033
- Table 19: Global Fermentation Chemicals Industry Revenue Million Forecast, by Product Type 2020 & 2033
- Table 20: Global Fermentation Chemicals Industry Revenue Million Forecast, by Application 2020 & 2033
- Table 21: Global Fermentation Chemicals Industry Revenue Million Forecast, by Country 2020 & 2033
- Table 22: Germany Fermentation Chemicals Industry Revenue (Million) Forecast, by Application 2020 & 2033
- Table 23: United Kingdom Fermentation Chemicals Industry Revenue (Million) Forecast, by Application 2020 & 2033
- Table 24: Italy Fermentation Chemicals Industry Revenue (Million) Forecast, by Application 2020 & 2033
- Table 25: France Fermentation Chemicals Industry Revenue (Million) Forecast, by Application 2020 & 2033
- Table 26: Rest of Europe Fermentation Chemicals Industry Revenue (Million) Forecast, by Application 2020 & 2033
- Table 27: Global Fermentation Chemicals Industry Revenue Million Forecast, by Product Type 2020 & 2033
- Table 28: Global Fermentation Chemicals Industry Revenue Million Forecast, by Application 2020 & 2033
- Table 29: Global Fermentation Chemicals Industry Revenue Million Forecast, by Country 2020 & 2033
- Table 30: Brazil Fermentation Chemicals Industry Revenue (Million) Forecast, by Application 2020 & 2033
- Table 31: Argentina Fermentation Chemicals Industry Revenue (Million) Forecast, by Application 2020 & 2033
- Table 32: Rest of South America Fermentation Chemicals Industry Revenue (Million) Forecast, by Application 2020 & 2033
- Table 33: Global Fermentation Chemicals Industry Revenue Million Forecast, by Product Type 2020 & 2033
- Table 34: Global Fermentation Chemicals Industry Revenue Million Forecast, by Application 2020 & 2033
- Table 35: Global Fermentation Chemicals Industry Revenue Million Forecast, by Country 2020 & 2033
- Table 36: Saudi Arabia Fermentation Chemicals Industry Revenue (Million) Forecast, by Application 2020 & 2033
- Table 37: South Africa Fermentation Chemicals Industry Revenue (Million) Forecast, by Application 2020 & 2033
- Table 38: Rest of Middle East and Africa Fermentation Chemicals Industry Revenue (Million) Forecast, by Application 2020 & 2033
Frequently Asked Questions
1. What is the projected Compound Annual Growth Rate (CAGR) of the Fermentation Chemicals Industry?
The projected CAGR is approximately 4.60%.
2. Which companies are prominent players in the Fermentation Chemicals Industry?
Key companies in the market include ADM, MicroBiopharm Japan Co Ltd, AB Enzymes, Cargill Incorporated, Teva Pharmaceutical Industries Ltd *List Not Exhaustive, BioVectra, Novozymes, Evonik Industries AG, Ajinomoto Co Inc, Chr Hansen Holding A/S, BASF SE, Biocon, DSM, Novasep, Lonza.
3. What are the main segments of the Fermentation Chemicals Industry?
The market segments include Product Type, Application.
4. Can you provide details about the market size?
The market size is estimated to be USD 194.04 Million as of 2022.
5. What are some drivers contributing to market growth?
Growing Demand from Methanol and Ethanol Industry; Increasing Demand from the Pharmaceutical Industry; Other Drivers.
6. What are the notable trends driving market growth?
Food and Beverage Sector to Dominate the Market.
7. Are there any restraints impacting market growth?
High Cost Due to the Complexity Involved in the Manufacturing Process; Other Restraints.
8. Can you provide examples of recent developments in the market?
N/A
9. What pricing options are available for accessing the report?
Pricing options include single-user, multi-user, and enterprise licenses priced at USD 4750, USD 5250, and USD 8750 respectively.
10. Is the market size provided in terms of value or volume?
The market size is provided in terms of value, measured in Million.
11. Are there any specific market keywords associated with the report?
Yes, the market keyword associated with the report is "Fermentation Chemicals Industry," which aids in identifying and referencing the specific market segment covered.
12. How do I determine which pricing option suits my needs best?
The pricing options vary based on user requirements and access needs. Individual users may opt for single-user licenses, while businesses requiring broader access may choose multi-user or enterprise licenses for cost-effective access to the report.
13. Are there any additional resources or data provided in the Fermentation Chemicals Industry report?
While the report offers comprehensive insights, it's advisable to review the specific contents or supplementary materials provided to ascertain if additional resources or data are available.
14. How can I stay updated on further developments or reports in the Fermentation Chemicals Industry?
To stay informed about further developments, trends, and reports in the Fermentation Chemicals Industry, consider subscribing to industry newsletters, following relevant companies and organizations, or regularly checking reputable industry news sources and publications.
Methodology
Step 1 - Identification of Relevant Samples Size from Population Database


Step 2 - Approaches for Defining Global Market Size (Value, Volume* & Price*)

Note*: In applicable scenarios
Step 3 - Data Sources
Primary Research
- Web Analytics
- Survey Reports
- Research Institute
- Latest Research Reports
- Opinion Leaders
Secondary Research
- Annual Reports
- White Paper
- Latest Press Release
- Industry Association
- Paid Database
- Investor Presentations

Step 4 - Data Triangulation
Involves using different sources of information in order to increase the validity of a study
These sources are likely to be stakeholders in a program - participants, other researchers, program staff, other community members, and so on.
Then we put all data in single framework & apply various statistical tools to find out the dynamic on the market.
During the analysis stage, feedback from the stakeholder groups would be compared to determine areas of agreement as well as areas of divergence