

Key Insights
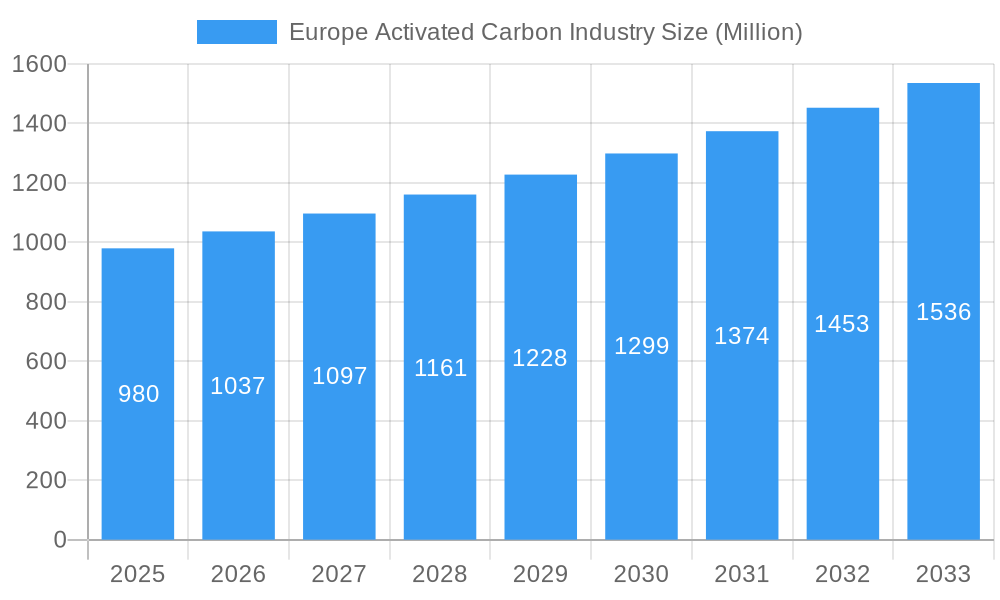
The European activated carbon market, valued at approximately €980 million in 2025, is projected to experience robust growth, driven by increasing demand across diverse applications. The consistent 5.41% CAGR from 2019 to 2024 suggests a continued upward trajectory, fueled primarily by the water purification sector, particularly in countries with stringent water quality regulations like Germany and the UK. Growth in the gas purification segment is also expected, driven by rising environmental concerns and stricter emission control standards across the region. The powdered activated carbon (PAC) segment holds a significant market share due to its cost-effectiveness and widespread use in water treatment plants. However, the granular activated carbon (GAC) segment is anticipated to witness substantial growth due to its superior adsorption capabilities and suitability for various applications. The presence of established players like Donau Chemie AG and Jacobi Carbons Group, alongside international corporations like Albemarle Corporation and Kuraray Co Ltd, fosters healthy competition and innovation within the market. Furthermore, increasing investments in research and development focusing on enhanced carbon materials and sustainable production methods are expected to positively impact market expansion.
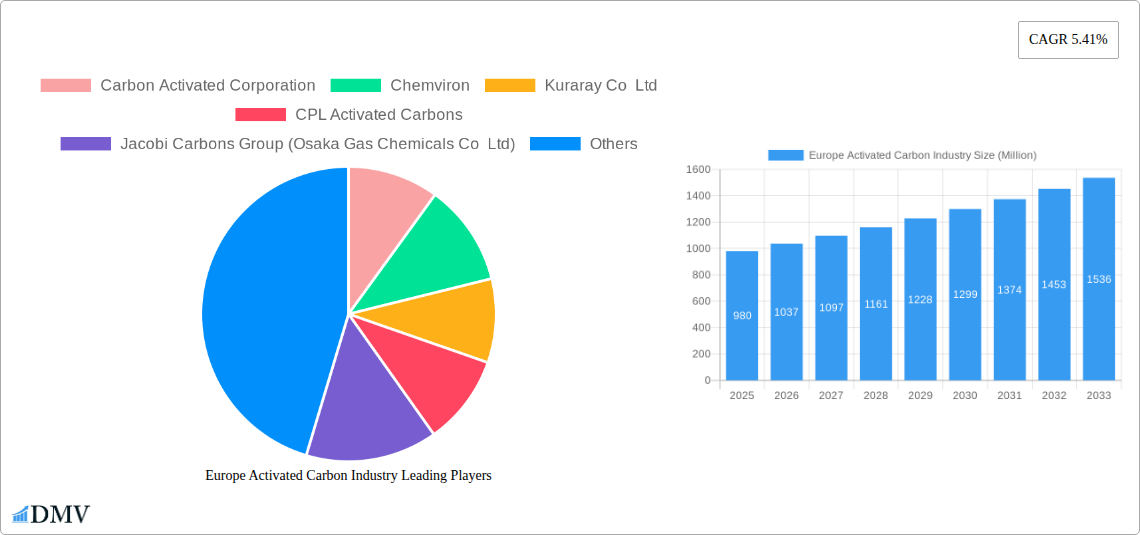
Europe Activated Carbon Industry Market Size (In Million)
Expansion into emerging applications like medicine and metal extraction, coupled with the growing adoption of advanced technologies for carbon production and regeneration, will further stimulate market growth. Germany, France, and the UK represent the largest national markets within Europe, driven by their robust industrial sectors and well-established infrastructure. However, other European countries are also witnessing increased demand, particularly from smaller-scale water treatment facilities and specialized industrial processes. The ongoing focus on sustainability and circular economy principles is creating opportunities for companies offering eco-friendly and recyclable activated carbon solutions. Challenges remain, including fluctuating raw material prices and the potential for substitute technologies, but the overall outlook for the European activated carbon market remains positive, with promising growth prospects throughout the forecast period (2025-2033).
Europe Activated Carbon Industry Company Market Share
Europe Activated Carbon Industry: A Comprehensive Market Report (2019-2033)
This insightful report provides a detailed analysis of the European activated carbon industry, encompassing market size, trends, leading players, and future projections. From granular activated carbon (GAC) to powdered activated carbon (PAC), and covering applications ranging from water purification to medicine, this report offers a 360° view of this dynamic sector. The study period spans 2019-2033, with a base year of 2025 and a forecast period of 2025-2033. Discover key growth drivers, significant challenges, and lucrative opportunities within this thriving market.
Europe Activated Carbon Industry Market Composition & Trends
The European activated carbon market exhibits a moderately concentrated landscape, with key players like Albemarle Corporation, Ingevity, and Kuraray Co Ltd holding significant market share. The exact distribution is xx%, xx%, and xx% respectively in 2025, reflecting a dynamic competitive environment. Innovation is driven by stringent environmental regulations pushing for advanced filtration and purification solutions. Substitute products, such as membrane filtration technologies, pose a competitive threat, though activated carbon maintains its edge in specific applications due to its cost-effectiveness and efficiency. The regulatory landscape, particularly concerning water quality standards and emissions control, heavily influences market growth. End-users span diverse sectors, including water treatment plants, chemical manufacturers, and pharmaceutical companies. The past five years have witnessed several mergers and acquisitions (M&A), with deal values exceeding USD xx Million in total. These activities aim to consolidate market share and expand product portfolios.
- Market Concentration: Moderately concentrated, with top 3 players holding xx% of the market share in 2025.
- Innovation Catalysts: Stringent environmental regulations and demand for advanced filtration solutions.
- Regulatory Landscape: Significant influence on market growth through water quality and emissions standards.
- Substitute Products: Membrane filtration technologies present a competitive challenge.
- M&A Activity: Significant deals exceeding USD xx Million in total value (2019-2024).
Europe Activated Carbon Industry Industry Evolution
The European activated carbon market experienced steady growth during the historical period (2019-2024), with a Compound Annual Growth Rate (CAGR) of approximately xx%. This growth is primarily attributed to increasing industrialization and urbanization, leading to a higher demand for water and air purification solutions. Technological advancements, such as the development of enhanced activated carbon materials with improved adsorption capacities and selectivities, have further fueled market expansion. Shifting consumer demands towards environmentally friendly products and sustainable solutions are driving innovation and adoption of advanced filtration technologies. The forecast period (2025-2033) anticipates continued growth, driven by increasing environmental concerns and stricter regulations. We project a CAGR of xx% for the forecast period, leading to a market valued at USD xx Million by 2033.
Leading Regions, Countries, or Segments in Europe Activated Carbon Industry
Germany, France, and the UK represent the leading regions in the European activated carbon market. The dominance of these regions is attributed to several factors:
- Germany: Strong chemical industry, robust environmental regulations, and high investment in water treatment infrastructure.
- France: Significant presence of water treatment facilities and a focus on water quality standards.
- UK: Growing demand from various sectors, including industrial applications and water purification.
Within the product segments, Granular Activated Carbon (GAC) holds the largest market share, followed by Powdered Activated Carbon (PAC) and Extruded/Pelletized Activated Carbon. The Water Purification application segment dominates the market, driven by stringent water quality regulations and increasing water scarcity.
- Key Drivers for Dominant Regions/Segments:
- Strong Industrial Base: High demand for industrial applications.
- Stringent Environmental Regulations: Driving adoption of advanced filtration technologies.
- Government Investments: Funding in infrastructure development.
Europe Activated Carbon Industry Product Innovations
Recent innovations focus on enhancing adsorption capacity, selectivity, and regeneration capabilities of activated carbon. New materials and production methods are leading to more efficient and sustainable solutions. The development of specialized activated carbons for specific applications, such as the removal of emerging contaminants from water or the capture of specific gases, is another area of intense focus. These improvements are translating into higher performance metrics and reduced operational costs for end-users.
Propelling Factors for Europe Activated Carbon Industry Growth
Several factors fuel the growth of the European activated carbon industry:
- Stringent Environmental Regulations: EU directives on water and air quality are driving adoption.
- Increasing Industrialization: Boosting demand for industrial applications.
- Technological Advancements: Developing more efficient and selective activated carbon materials.
Obstacles in the Europe Activated Carbon Industry Market
The industry faces challenges such as:
- Fluctuating Raw Material Prices: Impacting production costs.
- Supply Chain Disruptions: Affecting product availability and costs.
- Intense Competition: From both established players and new entrants.
Future Opportunities in Europe Activated Carbon Industry
Future opportunities include:
- Expanding into new applications: Such as energy storage and environmental remediation.
- Developing innovative products: With enhanced performance and sustainability.
- Exploring new markets: In developing economies with growing industrialization.
Major Players in the Europe Activated Carbon Industry Ecosystem
- Albemarle Corporation
- Ingevity
- Kuraray Co Ltd
- CPL Activated Carbons
- Jacobi Carbons Group (Osaka Gas Chemicals Co Ltd)
- Kureha Corporation
- Carbon Activated Corporation
- Chemviron
- CarboTech
- Puragen Activated Carbons
- Donau Chemie AG
Key Developments in Europe Activated Carbon Industry Industry
- August 2022: Ingevity invested USD 60 Million in a USD 170 Million round to acquire an equity stake in Nexeon Limited, expanding its presence in the electric vehicle market and its activated carbon business.
Strategic Europe Activated Carbon Industry Market Forecast
The European activated carbon market is poised for sustained growth, driven by continuous technological advancements, stringent environmental regulations, and expanding applications across various industries. The market's expansion will be particularly pronounced in water and air purification segments, fueled by increasing demand and supportive government policies. We anticipate significant opportunities for companies investing in R&D and focusing on sustainable and high-performance activated carbon solutions. The market's robust growth trajectory promises substantial returns for stakeholders in the coming years.
Europe Activated Carbon Industry Segmentation
-
1. Type
- 1.1. Powdered Activated Carbon (PAC)
- 1.2. Granular Activated Carbon (GAC)
- 1.3. Extruded or Pelletized Activated Carbon
-
2. Application
- 2.1. Gas Purification
- 2.2. Water Purification
- 2.3. Metal Extraction
- 2.4. Medicine
- 2.5. Other Applications
Europe Activated Carbon Industry Segmentation By Geography
- 1. Germany
- 2. United Kingdom
- 3. France
- 4. Italy
- 5. Spain
- 6. Rest of Europe
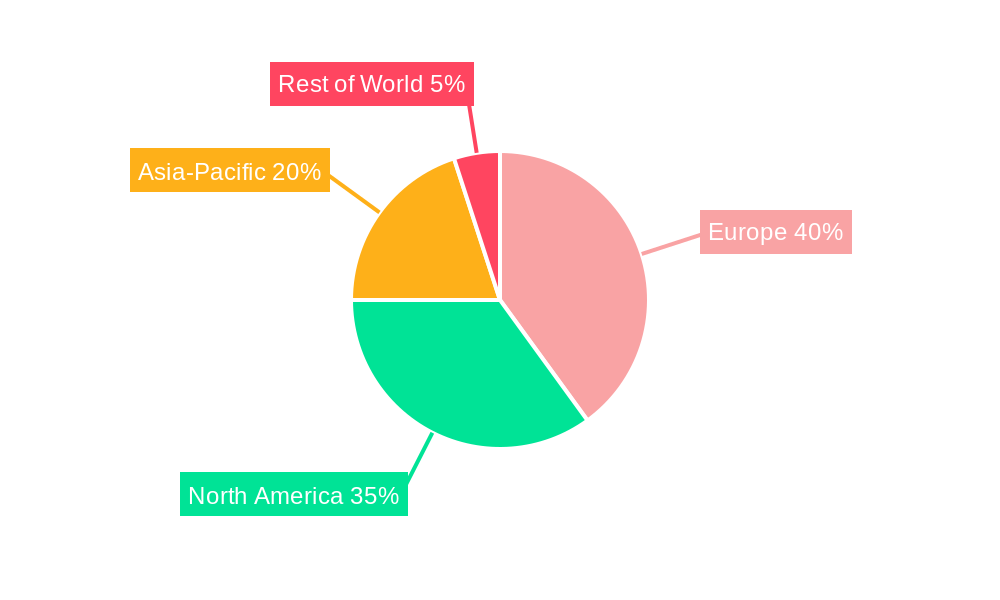
Europe Activated Carbon Industry Regional Market Share
Geographic Coverage of Europe Activated Carbon Industry
Europe Activated Carbon Industry REPORT HIGHLIGHTS
| Aspects | Details |
|---|---|
| Study Period | 2020-2034 |
| Base Year | 2025 |
| Estimated Year | 2026 |
| Forecast Period | 2026-2034 |
| Historical Period | 2020-2025 |
| Growth Rate | CAGR of 5.41% from 2020-2034 |
| Segmentation |
|
Table of Contents
- 1. Introduction
- 1.1. Research Scope
- 1.2. Market Segmentation
- 1.3. Research Objective
- 1.4. Definitions and Assumptions
- 2. Executive Summary
- 2.1. Market Snapshot
- 3. Market Dynamics
- 3.1. Market Drivers
- 3.2. Market Restrains
- 3.3. Market Trends
- 3.4. Market Opportunities
- 4. Market Factor Analysis
- 4.1. Porters Five Forces
- 4.1.1. Bargaining Power of Suppliers
- 4.1.2. Bargaining Power of Buyers
- 4.1.3. Threat of New Entrants
- 4.1.4. Threat of Substitutes
- 4.1.5. Competitive Rivalry
- 4.2. PESTEL analysis
- 4.3. BCG Analysis
- 4.3.1. Stars (High Growth, High Market Share)
- 4.3.2. Cash Cows (Low Growth, High Market Share)
- 4.3.3. Question Mark (High Growth, Low Market Share)
- 4.3.4. Dogs (Low Growth, Low Market Share)
- 4.4. Ansoff Matrix Analysis
- 4.5. Supply Chain Analysis
- 4.6. Regulatory Landscape
- 4.7. Current Market Potential and Opportunity Assessment (TAM–SAM–SOM Framework)
- 4.8. DMV Analyst Note
- 4.1. Porters Five Forces
- 5. Market Analysis, Insights and Forecast 2021-2033
- 5.1. Market Analysis, Insights and Forecast - by Type
- 5.1.1. Powdered Activated Carbon (PAC)
- 5.1.2. Granular Activated Carbon (GAC)
- 5.1.3. Extruded or Pelletized Activated Carbon
- 5.2. Market Analysis, Insights and Forecast - by Application
- 5.2.1. Gas Purification
- 5.2.2. Water Purification
- 5.2.3. Metal Extraction
- 5.2.4. Medicine
- 5.2.5. Other Applications
- 5.3. Market Analysis, Insights and Forecast - by Region
- 5.3.1. Germany
- 5.3.2. United Kingdom
- 5.3.3. France
- 5.3.4. Italy
- 5.3.5. Spain
- 5.3.6. Rest of Europe
- 5.1. Market Analysis, Insights and Forecast - by Type
- 6. Europe Activated Carbon Industry Analysis, Insights and Forecast, 2021-2033
- 6.1. Market Analysis, Insights and Forecast - by Type
- 6.1.1. Powdered Activated Carbon (PAC)
- 6.1.2. Granular Activated Carbon (GAC)
- 6.1.3. Extruded or Pelletized Activated Carbon
- 6.2. Market Analysis, Insights and Forecast - by Application
- 6.2.1. Gas Purification
- 6.2.2. Water Purification
- 6.2.3. Metal Extraction
- 6.2.4. Medicine
- 6.2.5. Other Applications
- 6.1. Market Analysis, Insights and Forecast - by Type
- 7. Germany Europe Activated Carbon Industry Analysis, Insights and Forecast, 2020-2032
- 7.1. Market Analysis, Insights and Forecast - by Type
- 7.1.1. Powdered Activated Carbon (PAC)
- 7.1.2. Granular Activated Carbon (GAC)
- 7.1.3. Extruded or Pelletized Activated Carbon
- 7.2. Market Analysis, Insights and Forecast - by Application
- 7.2.1. Gas Purification
- 7.2.2. Water Purification
- 7.2.3. Metal Extraction
- 7.2.4. Medicine
- 7.2.5. Other Applications
- 7.1. Market Analysis, Insights and Forecast - by Type
- 8. United Kingdom Europe Activated Carbon Industry Analysis, Insights and Forecast, 2020-2032
- 8.1. Market Analysis, Insights and Forecast - by Type
- 8.1.1. Powdered Activated Carbon (PAC)
- 8.1.2. Granular Activated Carbon (GAC)
- 8.1.3. Extruded or Pelletized Activated Carbon
- 8.2. Market Analysis, Insights and Forecast - by Application
- 8.2.1. Gas Purification
- 8.2.2. Water Purification
- 8.2.3. Metal Extraction
- 8.2.4. Medicine
- 8.2.5. Other Applications
- 8.1. Market Analysis, Insights and Forecast - by Type
- 9. France Europe Activated Carbon Industry Analysis, Insights and Forecast, 2020-2032
- 9.1. Market Analysis, Insights and Forecast - by Type
- 9.1.1. Powdered Activated Carbon (PAC)
- 9.1.2. Granular Activated Carbon (GAC)
- 9.1.3. Extruded or Pelletized Activated Carbon
- 9.2. Market Analysis, Insights and Forecast - by Application
- 9.2.1. Gas Purification
- 9.2.2. Water Purification
- 9.2.3. Metal Extraction
- 9.2.4. Medicine
- 9.2.5. Other Applications
- 9.1. Market Analysis, Insights and Forecast - by Type
- 10. Italy Europe Activated Carbon Industry Analysis, Insights and Forecast, 2020-2032
- 10.1. Market Analysis, Insights and Forecast - by Type
- 10.1.1. Powdered Activated Carbon (PAC)
- 10.1.2. Granular Activated Carbon (GAC)
- 10.1.3. Extruded or Pelletized Activated Carbon
- 10.2. Market Analysis, Insights and Forecast - by Application
- 10.2.1. Gas Purification
- 10.2.2. Water Purification
- 10.2.3. Metal Extraction
- 10.2.4. Medicine
- 10.2.5. Other Applications
- 10.1. Market Analysis, Insights and Forecast - by Type
- 11. Spain Europe Activated Carbon Industry Analysis, Insights and Forecast, 2020-2032
- 11.1. Market Analysis, Insights and Forecast - by Type
- 11.1.1. Powdered Activated Carbon (PAC)
- 11.1.2. Granular Activated Carbon (GAC)
- 11.1.3. Extruded or Pelletized Activated Carbon
- 11.2. Market Analysis, Insights and Forecast - by Application
- 11.2.1. Gas Purification
- 11.2.2. Water Purification
- 11.2.3. Metal Extraction
- 11.2.4. Medicine
- 11.2.5. Other Applications
- 11.1. Market Analysis, Insights and Forecast - by Type
- 12. Rest of Europe Europe Activated Carbon Industry Analysis, Insights and Forecast, 2020-2032
- 12.1. Market Analysis, Insights and Forecast - by Type
- 12.1.1. Powdered Activated Carbon (PAC)
- 12.1.2. Granular Activated Carbon (GAC)
- 12.1.3. Extruded or Pelletized Activated Carbon
- 12.2. Market Analysis, Insights and Forecast - by Application
- 12.2.1. Gas Purification
- 12.2.2. Water Purification
- 12.2.3. Metal Extraction
- 12.2.4. Medicine
- 12.2.5. Other Applications
- 12.1. Market Analysis, Insights and Forecast - by Type
- 13. Competitive Analysis
- 13.1. Company Profiles
- 13.1.1 Carbon Activated Corporation
- 13.1.1.1. Company Overview
- 13.1.1.2. Products
- 13.1.1.3. Company Financials
- 13.1.1.4. SWOT Analysis
- 13.1.2 Chemviron
- 13.1.2.1. Company Overview
- 13.1.2.2. Products
- 13.1.2.3. Company Financials
- 13.1.2.4. SWOT Analysis
- 13.1.3 Kuraray Co Ltd
- 13.1.3.1. Company Overview
- 13.1.3.2. Products
- 13.1.3.3. Company Financials
- 13.1.3.4. SWOT Analysis
- 13.1.4 CPL Activated Carbons
- 13.1.4.1. Company Overview
- 13.1.4.2. Products
- 13.1.4.3. Company Financials
- 13.1.4.4. SWOT Analysis
- 13.1.5 Jacobi Carbons Group (Osaka Gas Chemicals Co Ltd)
- 13.1.5.1. Company Overview
- 13.1.5.2. Products
- 13.1.5.3. Company Financials
- 13.1.5.4. SWOT Analysis
- 13.1.6 Kureha Corporation
- 13.1.6.1. Company Overview
- 13.1.6.2. Products
- 13.1.6.3. Company Financials
- 13.1.6.4. SWOT Analysis
- 13.1.7 Ingevity
- 13.1.7.1. Company Overview
- 13.1.7.2. Products
- 13.1.7.3. Company Financials
- 13.1.7.4. SWOT Analysis
- 13.1.8 CarboTech
- 13.1.8.1. Company Overview
- 13.1.8.2. Products
- 13.1.8.3. Company Financials
- 13.1.8.4. SWOT Analysis
- 13.1.9 Puragen Activated Carbons
- 13.1.9.1. Company Overview
- 13.1.9.2. Products
- 13.1.9.3. Company Financials
- 13.1.9.4. SWOT Analysis
- 13.1.10 Donau Chemie AG
- 13.1.10.1. Company Overview
- 13.1.10.2. Products
- 13.1.10.3. Company Financials
- 13.1.10.4. SWOT Analysis
- 13.1.11 Albemarle Corporation
- 13.1.11.1. Company Overview
- 13.1.11.2. Products
- 13.1.11.3. Company Financials
- 13.1.11.4. SWOT Analysis
- 13.1.1 Carbon Activated Corporation
- 13.2. Market Entropy
- 13.2.1 Company's Key Areas Served
- 13.2.2 Recent Developments
- 13.3. Company Market Share Analysis 2025
- 13.3.1 Top 5 Companies Market Share Analysis
- 13.3.2 Top 3 Companies Market Share Analysis
- 13.4. List of Potential Customers
- 14. Research Methodology
List of Figures
- Figure 1: Europe Activated Carbon Industry Revenue Breakdown (Million, %) by Product 2025 & 2033
- Figure 2: Europe Activated Carbon Industry Share (%) by Company 2025
List of Tables
- Table 1: Europe Activated Carbon Industry Revenue Million Forecast, by Type 2020 & 2033
- Table 2: Europe Activated Carbon Industry Volume K Tons Forecast, by Type 2020 & 2033
- Table 3: Europe Activated Carbon Industry Revenue Million Forecast, by Application 2020 & 2033
- Table 4: Europe Activated Carbon Industry Volume K Tons Forecast, by Application 2020 & 2033
- Table 5: Europe Activated Carbon Industry Revenue Million Forecast, by Region 2020 & 2033
- Table 6: Europe Activated Carbon Industry Volume K Tons Forecast, by Region 2020 & 2033
- Table 7: Europe Activated Carbon Industry Revenue Million Forecast, by Type 2020 & 2033
- Table 8: Europe Activated Carbon Industry Volume K Tons Forecast, by Type 2020 & 2033
- Table 9: Europe Activated Carbon Industry Revenue Million Forecast, by Application 2020 & 2033
- Table 10: Europe Activated Carbon Industry Volume K Tons Forecast, by Application 2020 & 2033
- Table 11: Europe Activated Carbon Industry Revenue Million Forecast, by Country 2020 & 2033
- Table 12: Europe Activated Carbon Industry Volume K Tons Forecast, by Country 2020 & 2033
- Table 13: Europe Activated Carbon Industry Revenue Million Forecast, by Type 2020 & 2033
- Table 14: Europe Activated Carbon Industry Volume K Tons Forecast, by Type 2020 & 2033
- Table 15: Europe Activated Carbon Industry Revenue Million Forecast, by Application 2020 & 2033
- Table 16: Europe Activated Carbon Industry Volume K Tons Forecast, by Application 2020 & 2033
- Table 17: Europe Activated Carbon Industry Revenue Million Forecast, by Country 2020 & 2033
- Table 18: Europe Activated Carbon Industry Volume K Tons Forecast, by Country 2020 & 2033
- Table 19: Europe Activated Carbon Industry Revenue Million Forecast, by Type 2020 & 2033
- Table 20: Europe Activated Carbon Industry Volume K Tons Forecast, by Type 2020 & 2033
- Table 21: Europe Activated Carbon Industry Revenue Million Forecast, by Application 2020 & 2033
- Table 22: Europe Activated Carbon Industry Volume K Tons Forecast, by Application 2020 & 2033
- Table 23: Europe Activated Carbon Industry Revenue Million Forecast, by Country 2020 & 2033
- Table 24: Europe Activated Carbon Industry Volume K Tons Forecast, by Country 2020 & 2033
- Table 25: Europe Activated Carbon Industry Revenue Million Forecast, by Type 2020 & 2033
- Table 26: Europe Activated Carbon Industry Volume K Tons Forecast, by Type 2020 & 2033
- Table 27: Europe Activated Carbon Industry Revenue Million Forecast, by Application 2020 & 2033
- Table 28: Europe Activated Carbon Industry Volume K Tons Forecast, by Application 2020 & 2033
- Table 29: Europe Activated Carbon Industry Revenue Million Forecast, by Country 2020 & 2033
- Table 30: Europe Activated Carbon Industry Volume K Tons Forecast, by Country 2020 & 2033
- Table 31: Europe Activated Carbon Industry Revenue Million Forecast, by Type 2020 & 2033
- Table 32: Europe Activated Carbon Industry Volume K Tons Forecast, by Type 2020 & 2033
- Table 33: Europe Activated Carbon Industry Revenue Million Forecast, by Application 2020 & 2033
- Table 34: Europe Activated Carbon Industry Volume K Tons Forecast, by Application 2020 & 2033
- Table 35: Europe Activated Carbon Industry Revenue Million Forecast, by Country 2020 & 2033
- Table 36: Europe Activated Carbon Industry Volume K Tons Forecast, by Country 2020 & 2033
- Table 37: Europe Activated Carbon Industry Revenue Million Forecast, by Type 2020 & 2033
- Table 38: Europe Activated Carbon Industry Volume K Tons Forecast, by Type 2020 & 2033
- Table 39: Europe Activated Carbon Industry Revenue Million Forecast, by Application 2020 & 2033
- Table 40: Europe Activated Carbon Industry Volume K Tons Forecast, by Application 2020 & 2033
- Table 41: Europe Activated Carbon Industry Revenue Million Forecast, by Country 2020 & 2033
- Table 42: Europe Activated Carbon Industry Volume K Tons Forecast, by Country 2020 & 2033
Frequently Asked Questions
1. What is the projected Compound Annual Growth Rate (CAGR) of the Europe Activated Carbon Industry?
The projected CAGR is approximately 5.41%.
2. Which companies are prominent players in the Europe Activated Carbon Industry?
Key companies in the market include Carbon Activated Corporation, Chemviron, Kuraray Co Ltd, CPL Activated Carbons, Jacobi Carbons Group (Osaka Gas Chemicals Co Ltd), Kureha Corporation, Ingevity, CarboTech, Puragen Activated Carbons, Donau Chemie AG, Albemarle Corporation.
3. What are the main segments of the Europe Activated Carbon Industry?
The market segments include Type, Application.
4. Can you provide details about the market size?
The market size is estimated to be USD 0.98 Million as of 2022.
5. What are some drivers contributing to market growth?
Augmenting Prominence for Air Pollution Control; Surge in Demand from Water Treatment and Water Purification Applications; Other Drivers.
6. What are the notable trends driving market growth?
Medicine Segment to be the Fastest Growing Application.
7. Are there any restraints impacting market growth?
Availability of Substitute Products; Other Restraints.
8. Can you provide examples of recent developments in the market?
August 2022: Ingevity invested USD 60 million in a USD 170 million round to acquire an equity stake in Nexeon Limited. It is a strategic move to establish the company's presence in the electric vehicle (EV) market and increase opportunities to grow its activated carbon business.
9. What pricing options are available for accessing the report?
Pricing options include single-user, multi-user, and enterprise licenses priced at USD 3,950, USD 4,950, and USD 6,950 respectively.
10. Is the market size provided in terms of value or volume?
The market size is provided in terms of value, measured in Million and volume, measured in K Tons.
11. Are there any specific market keywords associated with the report?
Yes, the market keyword associated with the report is "Europe Activated Carbon Industry," which aids in identifying and referencing the specific market segment covered.
12. How do I determine which pricing option suits my needs best?
The pricing options vary based on user requirements and access needs. Individual users may opt for single-user licenses, while businesses requiring broader access may choose multi-user or enterprise licenses for cost-effective access to the report.
13. Are there any additional resources or data provided in the Europe Activated Carbon Industry report?
While the report offers comprehensive insights, it's advisable to review the specific contents or supplementary materials provided to ascertain if additional resources or data are available.
14. How can I stay updated on further developments or reports in the Europe Activated Carbon Industry?
To stay informed about further developments, trends, and reports in the Europe Activated Carbon Industry, consider subscribing to industry newsletters, following relevant companies and organizations, or regularly checking reputable industry news sources and publications.
Methodology
Step 1 - Identification of Relevant Samples Size from Population Database


Step 2 - Approaches for Defining Global Market Size (Value, Volume* & Price*)

Note*: In applicable scenarios
Step 3 - Data Sources
Primary Research
- Web Analytics
- Survey Reports
- Research Institute
- Latest Research Reports
- Opinion Leaders
Secondary Research
- Annual Reports
- White Paper
- Latest Press Release
- Industry Association
- Paid Database
- Investor Presentations

Step 4 - Data Triangulation
Involves using different sources of information in order to increase the validity of a study
These sources are likely to be stakeholders in a program - participants, other researchers, program staff, other community members, and so on.
Then we put all data in single framework & apply various statistical tools to find out the dynamic on the market.
During the analysis stage, feedback from the stakeholder groups would be compared to determine areas of agreement as well as areas of divergence