

Key Insights
The global epoxy composite market is poised for substantial expansion, driven by escalating demand across critical industries. Projected to reach $35.04 billion by 2025, the market is expected to experience a Compound Annual Growth Rate (CAGR) of 7.1% from 2025 to 2033. This robust growth is underpinned by several key factors. The aerospace and defense sector's persistent need for advanced, lightweight, and high-strength materials for aircraft and spacecraft is a primary catalyst. Concurrently, the automotive and transportation industry is integrating epoxy composites to enhance fuel efficiency and elevate vehicle performance. The rapidly expanding renewable energy sector, especially wind power, presents significant opportunities, with epoxy composites integral to wind turbine blades and components. Continuous advancements in epoxy resin formulations, leading to superior mechanical properties and increased durability, further fuel market growth. However, the market faces challenges, including the higher cost of epoxy composites relative to alternative materials and environmental impact considerations. Market segmentation indicates that glass fiber dominates the fiber type segment, while aerospace and defense leads the end-user industry segment. Leading companies such as SGL Carbon, Mitsubishi Chemical Corporation, and Hexcel Corporation are strategically positioned to leverage these trends through innovation and market expansion. The Asia Pacific region, particularly China and India, demonstrates strong growth potential, driven by rapid industrialization and infrastructure development.
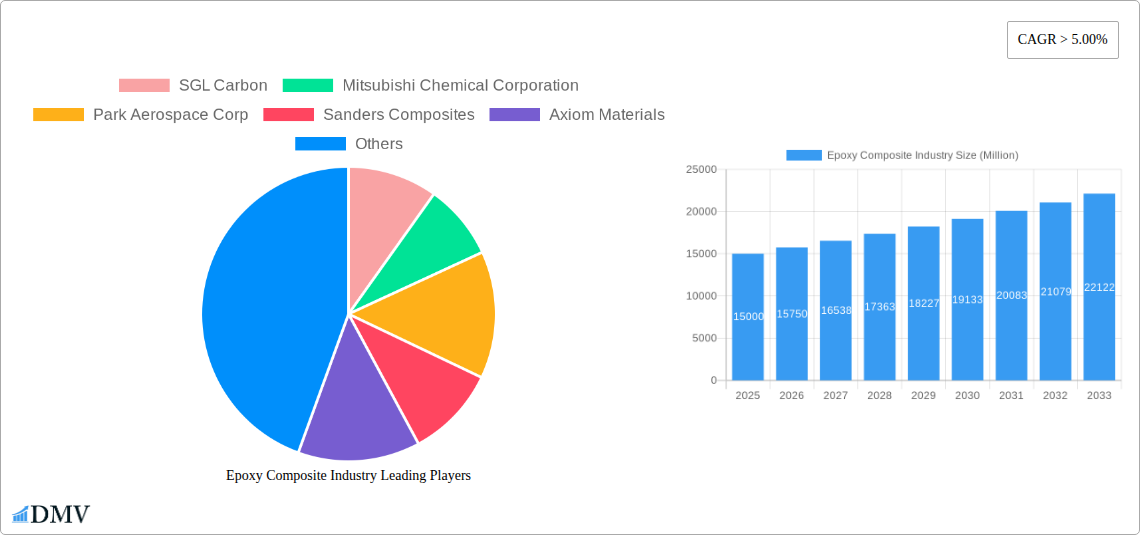
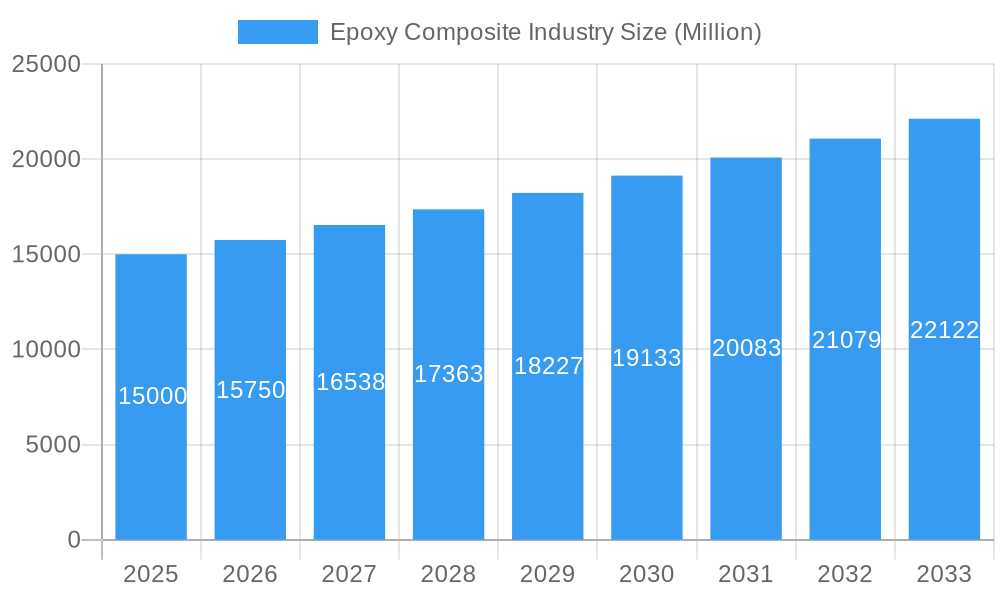
Epoxy Composite Industry Market Size (In Billion)
The forecast period (2025-2033) anticipates sustained market expansion, with accelerated growth anticipated in emerging economies. The increasing adoption of sustainable manufacturing practices within the epoxy composite industry is expected to address environmental concerns. Ongoing research and development focused on improving the recyclability and biodegradability of epoxy composites will further shape the market. Intensified competition among established players and new entrants will necessitate ongoing innovation and strategic alliances to maintain a competitive advantage. In summary, the epoxy composite market offers a compelling investment landscape with significant growth prospects across diverse sectors and geographies.
Epoxy Composite Industry Company Market Share
Epoxy Composite Industry: A Comprehensive Market Report (2019-2033)
This insightful report provides a detailed analysis of the global epoxy composite industry, offering a comprehensive overview of market trends, growth drivers, and future opportunities. The study period spans from 2019 to 2033, with 2025 serving as the base and estimated year. The report utilizes a robust methodology combining extensive primary and secondary research to deliver accurate forecasts and valuable insights for stakeholders. The market is projected to reach xx Million by 2033, presenting significant investment potential. This report is essential for businesses, investors, and researchers seeking to understand and capitalize on the dynamic epoxy composite landscape.
Epoxy Composite Industry Market Composition & Trends
This section delves into the intricate dynamics of the epoxy composite market, evaluating its concentration, innovation drivers, regulatory environment, and competitive landscape. We analyze substitute materials, end-user behavior, and the impact of mergers and acquisitions (M&A) activities.
- Market Concentration: The global epoxy composite market exhibits a moderately concentrated structure, with key players such as SGL Carbon, Mitsubishi Chemical Corporation, and Hexcel Corporation holding significant market share. The report provides a detailed breakdown of market share distribution among the leading players.
- Innovation Catalysts: Continuous advancements in fiber technology (carbon fiber, glass fiber, and others) and resin formulations are driving innovation within the industry. Lightweighting demands across various sectors are spurring the development of high-performance epoxy composites.
- Regulatory Landscape: Environmental regulations and safety standards related to material handling and disposal significantly influence market dynamics. The report analyzes the impact of these regulations across different geographies.
- Substitute Products: Alternative materials like thermoplastics and thermosets pose competitive challenges. The report assesses the competitive landscape by examining the advantages and disadvantages of substitute materials compared to epoxy composites.
- End-User Profiles: The report categorizes end-users across key sectors including aerospace & defense, automotive & transportation, electrical & electronics, wind energy, and sporting goods, providing detailed analysis of market size and growth potential within each sector.
- M&A Activities: The epoxy composite industry has witnessed several strategic mergers and acquisitions in recent years, driven by the need for expansion, technological advancements, and market consolidation. The report analyzes notable M&A deals, valuing them at xx Million collectively during the historical period (2019-2024).
Epoxy Composite Industry Evolution
This section provides a thorough analysis of the epoxy composite industry's historical and projected growth trajectory. We examine technological advancements, evolving consumer preferences, and the changing market dynamics. The historical period (2019-2024) shows an average annual growth rate (AAGR) of xx%, projected to reach an AAGR of xx% during the forecast period (2025-2033). This growth is largely fueled by increasing demand from the automotive and renewable energy sectors. The adoption of epoxy composites in lightweight applications has been steadily rising, contributing significantly to this expansion. Technological advancements, particularly in carbon fiber reinforced polymers (CFRP), are driving efficiency gains and pushing adoption in high-value applications. Shifting consumer preferences toward sustainability are also pushing market demand towards more environmentally friendly solutions, and this is reflected in manufacturers' increased focus on bio-based and recycled materials.
Leading Regions, Countries, or Segments in Epoxy Composite Industry
The report identifies key regions, countries, and segments driving the epoxy composite market.
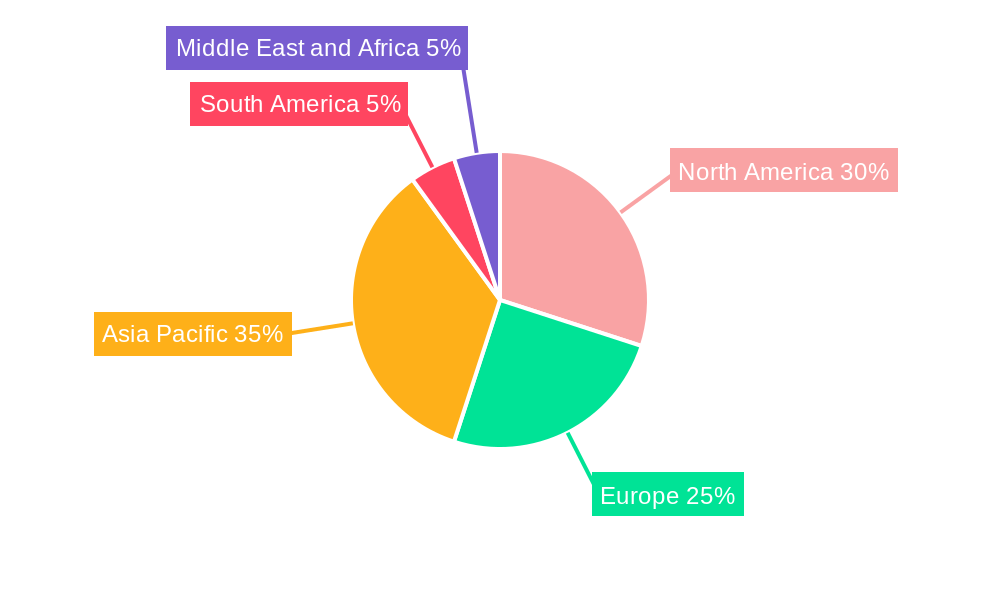
- Dominant Region: North America is currently the leading region for epoxy composite consumption due to a strong presence in the aerospace & defense sector and substantial investments in renewable energy infrastructure. The Asia Pacific region, however, is projected to experience the fastest growth rate in the coming years due to increasing manufacturing activity and automotive production.
- Fiber Type: Carbon fiber composites dominate the market, owing to their high strength-to-weight ratio. However, the glass fiber segment is witnessing substantial growth due to its cost-effectiveness and suitability in various applications.
- End-User Industry: The aerospace & defense sector remains a dominant end-user, due to stringent requirements for lightweight, high-strength materials. The automotive & transportation sector is also a key driver of growth, with rising demand for fuel-efficient vehicles.
- Key Drivers:
- Aerospace & Defense: Stringent lightweighting requirements and superior performance characteristics of epoxy composites.
- Automotive & Transportation: Growing demand for fuel-efficient and high-performance vehicles.
- Wind Energy: The need for lightweight and durable materials in wind turbine blades.
- Investment Trends: Substantial investments in R&D and manufacturing capacity are fueling market expansion.
- Regulatory Support: Government policies promoting the use of sustainable and lightweight materials further boost growth.
Epoxy Composite Industry Product Innovations
Recent advancements include the development of high-temperature resistant epoxy resins for demanding aerospace applications and the introduction of bio-based epoxy resins aimed at addressing sustainability concerns. These innovations enhance material performance, durability, and processing capabilities, leading to improved product lifecycles and reduced environmental impact. Unique selling propositions often center around improved strength-to-weight ratios, enhanced durability, and improved processability.
Propelling Factors for Epoxy Composite Industry Growth
The epoxy composite industry's growth is propelled by several key factors. Technological advancements such as the development of high-performance fibers and resins drive efficiency gains and new applications. The increasing demand for lightweight materials in the aerospace and automotive industries is a significant driver. Favorable government regulations and incentives promoting sustainable materials are also positively influencing the market. The growing adoption of epoxy composites in renewable energy applications, like wind turbine blades, is another significant driver, bolstering market growth.
Obstacles in the Epoxy Composite Industry Market
Despite the promising growth prospects, the epoxy composite market faces certain challenges. Fluctuations in raw material prices (such as epoxy resins and carbon fibers) impact production costs and profitability. Supply chain disruptions and geopolitical instability can also cause delays and increase material costs. Intense competition among manufacturers necessitates continuous innovation and cost optimization.
Future Opportunities in Epoxy Composite Industry
The epoxy composite industry is poised for significant growth. Emerging applications in areas such as 3D printing, construction, and biomedical engineering offer immense market potential. The development of new, sustainable materials and improved recycling processes will further propel market growth. Focus on developing more efficient and cost-effective manufacturing processes will also open new opportunities for the industry.
Major Players in the Epoxy Composite Industry Ecosystem
- SGL Carbon
- Mitsubishi Chemical Corporation
- Park Aerospace Corp
- Sanders Composites
- Axiom Materials
- Barrday
- Veplas d d
- Hexcel Corporation
Key Developments in Epoxy Composite Industry Industry
- 2023-04: Hexcel Corporation launched a new line of high-performance epoxy resins for aerospace applications, enhancing lightweighting capabilities.
- 2022-11: Mitsubishi Chemical Corporation and a partner announced a joint venture to expand carbon fiber production capacity in Asia.
- 2021-09: SGL Carbon acquired a smaller composite material manufacturer, bolstering its market share and product portfolio.
Strategic Epoxy Composite Industry Market Forecast
The epoxy composite market is poised for significant growth driven by technological innovation, increased demand from key industries, and supportive government policies. The expanding use of epoxy composites in lightweight vehicles, renewable energy technologies, and advanced manufacturing processes will drive market expansion. Continued investments in R&D will likely lead to new high-performance materials and applications, further strengthening the market's growth trajectory over the forecast period (2025-2033).
Epoxy Composite Industry Segmentation
-
1. Fiber Type
- 1.1. Glass
- 1.2. Carbon
- 1.3. Other Fiber Types
-
2. End-user Industry
- 2.1. Aerospace and Defense
- 2.2. Automotive and Transportation
- 2.3. Electrical and Electronics
- 2.4. Wind Energy
- 2.5. Sporting Goods
- 2.6. Other End-user Industries
Epoxy Composite Industry Segmentation By Geography
-
1. Asia Pacific
- 1.1. China
- 1.2. India
- 1.3. Japan
- 1.4. South Korea
- 1.5. Malaysia
- 1.6. Thailand
- 1.7. Indonesia
- 1.8. Vietnam
- 1.9. Rest of Asia Pacific
-
2. North America
- 2.1. United States
- 2.2. Canada
- 2.3. Mexico
-
3. Europe
- 3.1. Germany
- 3.2. United Kingdom
- 3.3. Italy
- 3.4. France
- 3.5. Spain
- 3.6. NORDIC Countries
- 3.7. Turkey
- 3.8. Russia
- 3.9. Rest of Europe
-
4. South America
- 4.1. Brazil
- 4.2. Argentina
- 4.3. Colombia
- 4.4. Rest of South America
-
5. Middle East and Africa
- 5.1. Saudi Arabia
- 5.2. South Africa
- 5.3. Nigeria
- 5.4. Qatar
- 5.5. Egypt
- 5.6. United Arab Emirates
- 5.7. Rest of Middle East and Africa
Epoxy Composite Industry Regional Market Share
Geographic Coverage of Epoxy Composite Industry
Epoxy Composite Industry REPORT HIGHLIGHTS
| Aspects | Details |
|---|---|
| Study Period | 2020-2034 |
| Base Year | 2025 |
| Estimated Year | 2026 |
| Forecast Period | 2026-2034 |
| Historical Period | 2020-2025 |
| Growth Rate | CAGR of 7.1% from 2020-2034 |
| Segmentation |
|
Table of Contents
- 1. Introduction
- 1.1. Research Scope
- 1.2. Market Segmentation
- 1.3. Research Objective
- 1.4. Definitions and Assumptions
- 2. Executive Summary
- 2.1. Market Snapshot
- 3. Market Dynamics
- 3.1. Market Drivers
- 3.2. Market Restrains
- 3.3. Market Trends
- 3.4. Market Opportunities
- 4. Market Factor Analysis
- 4.1. Porters Five Forces
- 4.1.1. Bargaining Power of Suppliers
- 4.1.2. Bargaining Power of Buyers
- 4.1.3. Threat of New Entrants
- 4.1.4. Threat of Substitutes
- 4.1.5. Competitive Rivalry
- 4.2. PESTEL analysis
- 4.3. BCG Analysis
- 4.3.1. Stars (High Growth, High Market Share)
- 4.3.2. Cash Cows (Low Growth, High Market Share)
- 4.3.3. Question Mark (High Growth, Low Market Share)
- 4.3.4. Dogs (Low Growth, Low Market Share)
- 4.4. Ansoff Matrix Analysis
- 4.5. Supply Chain Analysis
- 4.6. Regulatory Landscape
- 4.7. Current Market Potential and Opportunity Assessment (TAM–SAM–SOM Framework)
- 4.8. DMV Analyst Note
- 4.1. Porters Five Forces
- 5. Market Analysis, Insights and Forecast 2021-2033
- 5.1. Market Analysis, Insights and Forecast - by Fiber Type
- 5.1.1. Glass
- 5.1.2. Carbon
- 5.1.3. Other Fiber Types
- 5.2. Market Analysis, Insights and Forecast - by End-user Industry
- 5.2.1. Aerospace and Defense
- 5.2.2. Automotive and Transportation
- 5.2.3. Electrical and Electronics
- 5.2.4. Wind Energy
- 5.2.5. Sporting Goods
- 5.2.6. Other End-user Industries
- 5.3. Market Analysis, Insights and Forecast - by Region
- 5.3.1. Asia Pacific
- 5.3.2. North America
- 5.3.3. Europe
- 5.3.4. South America
- 5.3.5. Middle East and Africa
- 5.1. Market Analysis, Insights and Forecast - by Fiber Type
- 6. Global Epoxy Composite Industry Analysis, Insights and Forecast, 2021-2033
- 6.1. Market Analysis, Insights and Forecast - by Fiber Type
- 6.1.1. Glass
- 6.1.2. Carbon
- 6.1.3. Other Fiber Types
- 6.2. Market Analysis, Insights and Forecast - by End-user Industry
- 6.2.1. Aerospace and Defense
- 6.2.2. Automotive and Transportation
- 6.2.3. Electrical and Electronics
- 6.2.4. Wind Energy
- 6.2.5. Sporting Goods
- 6.2.6. Other End-user Industries
- 6.1. Market Analysis, Insights and Forecast - by Fiber Type
- 7. Asia Pacific Epoxy Composite Industry Analysis, Insights and Forecast, 2020-2032
- 7.1. Market Analysis, Insights and Forecast - by Fiber Type
- 7.1.1. Glass
- 7.1.2. Carbon
- 7.1.3. Other Fiber Types
- 7.2. Market Analysis, Insights and Forecast - by End-user Industry
- 7.2.1. Aerospace and Defense
- 7.2.2. Automotive and Transportation
- 7.2.3. Electrical and Electronics
- 7.2.4. Wind Energy
- 7.2.5. Sporting Goods
- 7.2.6. Other End-user Industries
- 7.1. Market Analysis, Insights and Forecast - by Fiber Type
- 8. North America Epoxy Composite Industry Analysis, Insights and Forecast, 2020-2032
- 8.1. Market Analysis, Insights and Forecast - by Fiber Type
- 8.1.1. Glass
- 8.1.2. Carbon
- 8.1.3. Other Fiber Types
- 8.2. Market Analysis, Insights and Forecast - by End-user Industry
- 8.2.1. Aerospace and Defense
- 8.2.2. Automotive and Transportation
- 8.2.3. Electrical and Electronics
- 8.2.4. Wind Energy
- 8.2.5. Sporting Goods
- 8.2.6. Other End-user Industries
- 8.1. Market Analysis, Insights and Forecast - by Fiber Type
- 9. Europe Epoxy Composite Industry Analysis, Insights and Forecast, 2020-2032
- 9.1. Market Analysis, Insights and Forecast - by Fiber Type
- 9.1.1. Glass
- 9.1.2. Carbon
- 9.1.3. Other Fiber Types
- 9.2. Market Analysis, Insights and Forecast - by End-user Industry
- 9.2.1. Aerospace and Defense
- 9.2.2. Automotive and Transportation
- 9.2.3. Electrical and Electronics
- 9.2.4. Wind Energy
- 9.2.5. Sporting Goods
- 9.2.6. Other End-user Industries
- 9.1. Market Analysis, Insights and Forecast - by Fiber Type
- 10. South America Epoxy Composite Industry Analysis, Insights and Forecast, 2020-2032
- 10.1. Market Analysis, Insights and Forecast - by Fiber Type
- 10.1.1. Glass
- 10.1.2. Carbon
- 10.1.3. Other Fiber Types
- 10.2. Market Analysis, Insights and Forecast - by End-user Industry
- 10.2.1. Aerospace and Defense
- 10.2.2. Automotive and Transportation
- 10.2.3. Electrical and Electronics
- 10.2.4. Wind Energy
- 10.2.5. Sporting Goods
- 10.2.6. Other End-user Industries
- 10.1. Market Analysis, Insights and Forecast - by Fiber Type
- 11. Middle East and Africa Epoxy Composite Industry Analysis, Insights and Forecast, 2020-2032
- 11.1. Market Analysis, Insights and Forecast - by Fiber Type
- 11.1.1. Glass
- 11.1.2. Carbon
- 11.1.3. Other Fiber Types
- 11.2. Market Analysis, Insights and Forecast - by End-user Industry
- 11.2.1. Aerospace and Defense
- 11.2.2. Automotive and Transportation
- 11.2.3. Electrical and Electronics
- 11.2.4. Wind Energy
- 11.2.5. Sporting Goods
- 11.2.6. Other End-user Industries
- 11.1. Market Analysis, Insights and Forecast - by Fiber Type
- 12. Competitive Analysis
- 12.1. Company Profiles
- 12.1.1 SGL Carbon
- 12.1.1.1. Company Overview
- 12.1.1.2. Products
- 12.1.1.3. Company Financials
- 12.1.1.4. SWOT Analysis
- 12.1.2 Mitsubishi Chemical Corporation
- 12.1.2.1. Company Overview
- 12.1.2.2. Products
- 12.1.2.3. Company Financials
- 12.1.2.4. SWOT Analysis
- 12.1.3 Park Aerospace Corp
- 12.1.3.1. Company Overview
- 12.1.3.2. Products
- 12.1.3.3. Company Financials
- 12.1.3.4. SWOT Analysis
- 12.1.4 Sanders Composites
- 12.1.4.1. Company Overview
- 12.1.4.2. Products
- 12.1.4.3. Company Financials
- 12.1.4.4. SWOT Analysis
- 12.1.5 Axiom Materials
- 12.1.5.1. Company Overview
- 12.1.5.2. Products
- 12.1.5.3. Company Financials
- 12.1.5.4. SWOT Analysis
- 12.1.6 Barrday
- 12.1.6.1. Company Overview
- 12.1.6.2. Products
- 12.1.6.3. Company Financials
- 12.1.6.4. SWOT Analysis
- 12.1.7 Veplas d d
- 12.1.7.1. Company Overview
- 12.1.7.2. Products
- 12.1.7.3. Company Financials
- 12.1.7.4. SWOT Analysis
- 12.1.8 Hexcel Corporation
- 12.1.8.1. Company Overview
- 12.1.8.2. Products
- 12.1.8.3. Company Financials
- 12.1.8.4. SWOT Analysis
- 12.1.1 SGL Carbon
- 12.2. Market Entropy
- 12.2.1 Company's Key Areas Served
- 12.2.2 Recent Developments
- 12.3. Company Market Share Analysis 2025
- 12.3.1 Top 5 Companies Market Share Analysis
- 12.3.2 Top 3 Companies Market Share Analysis
- 12.4. List of Potential Customers
- 13. Research Methodology
List of Figures
- Figure 1: Global Epoxy Composite Industry Revenue Breakdown (billion, %) by Region 2025 & 2033
- Figure 2: Global Epoxy Composite Industry Volume Breakdown (K Tons, %) by Region 2025 & 2033
- Figure 3: Asia Pacific Epoxy Composite Industry Revenue (billion), by Fiber Type 2025 & 2033
- Figure 4: Asia Pacific Epoxy Composite Industry Volume (K Tons), by Fiber Type 2025 & 2033
- Figure 5: Asia Pacific Epoxy Composite Industry Revenue Share (%), by Fiber Type 2025 & 2033
- Figure 6: Asia Pacific Epoxy Composite Industry Volume Share (%), by Fiber Type 2025 & 2033
- Figure 7: Asia Pacific Epoxy Composite Industry Revenue (billion), by End-user Industry 2025 & 2033
- Figure 8: Asia Pacific Epoxy Composite Industry Volume (K Tons), by End-user Industry 2025 & 2033
- Figure 9: Asia Pacific Epoxy Composite Industry Revenue Share (%), by End-user Industry 2025 & 2033
- Figure 10: Asia Pacific Epoxy Composite Industry Volume Share (%), by End-user Industry 2025 & 2033
- Figure 11: Asia Pacific Epoxy Composite Industry Revenue (billion), by Country 2025 & 2033
- Figure 12: Asia Pacific Epoxy Composite Industry Volume (K Tons), by Country 2025 & 2033
- Figure 13: Asia Pacific Epoxy Composite Industry Revenue Share (%), by Country 2025 & 2033
- Figure 14: Asia Pacific Epoxy Composite Industry Volume Share (%), by Country 2025 & 2033
- Figure 15: North America Epoxy Composite Industry Revenue (billion), by Fiber Type 2025 & 2033
- Figure 16: North America Epoxy Composite Industry Volume (K Tons), by Fiber Type 2025 & 2033
- Figure 17: North America Epoxy Composite Industry Revenue Share (%), by Fiber Type 2025 & 2033
- Figure 18: North America Epoxy Composite Industry Volume Share (%), by Fiber Type 2025 & 2033
- Figure 19: North America Epoxy Composite Industry Revenue (billion), by End-user Industry 2025 & 2033
- Figure 20: North America Epoxy Composite Industry Volume (K Tons), by End-user Industry 2025 & 2033
- Figure 21: North America Epoxy Composite Industry Revenue Share (%), by End-user Industry 2025 & 2033
- Figure 22: North America Epoxy Composite Industry Volume Share (%), by End-user Industry 2025 & 2033
- Figure 23: North America Epoxy Composite Industry Revenue (billion), by Country 2025 & 2033
- Figure 24: North America Epoxy Composite Industry Volume (K Tons), by Country 2025 & 2033
- Figure 25: North America Epoxy Composite Industry Revenue Share (%), by Country 2025 & 2033
- Figure 26: North America Epoxy Composite Industry Volume Share (%), by Country 2025 & 2033
- Figure 27: Europe Epoxy Composite Industry Revenue (billion), by Fiber Type 2025 & 2033
- Figure 28: Europe Epoxy Composite Industry Volume (K Tons), by Fiber Type 2025 & 2033
- Figure 29: Europe Epoxy Composite Industry Revenue Share (%), by Fiber Type 2025 & 2033
- Figure 30: Europe Epoxy Composite Industry Volume Share (%), by Fiber Type 2025 & 2033
- Figure 31: Europe Epoxy Composite Industry Revenue (billion), by End-user Industry 2025 & 2033
- Figure 32: Europe Epoxy Composite Industry Volume (K Tons), by End-user Industry 2025 & 2033
- Figure 33: Europe Epoxy Composite Industry Revenue Share (%), by End-user Industry 2025 & 2033
- Figure 34: Europe Epoxy Composite Industry Volume Share (%), by End-user Industry 2025 & 2033
- Figure 35: Europe Epoxy Composite Industry Revenue (billion), by Country 2025 & 2033
- Figure 36: Europe Epoxy Composite Industry Volume (K Tons), by Country 2025 & 2033
- Figure 37: Europe Epoxy Composite Industry Revenue Share (%), by Country 2025 & 2033
- Figure 38: Europe Epoxy Composite Industry Volume Share (%), by Country 2025 & 2033
- Figure 39: South America Epoxy Composite Industry Revenue (billion), by Fiber Type 2025 & 2033
- Figure 40: South America Epoxy Composite Industry Volume (K Tons), by Fiber Type 2025 & 2033
- Figure 41: South America Epoxy Composite Industry Revenue Share (%), by Fiber Type 2025 & 2033
- Figure 42: South America Epoxy Composite Industry Volume Share (%), by Fiber Type 2025 & 2033
- Figure 43: South America Epoxy Composite Industry Revenue (billion), by End-user Industry 2025 & 2033
- Figure 44: South America Epoxy Composite Industry Volume (K Tons), by End-user Industry 2025 & 2033
- Figure 45: South America Epoxy Composite Industry Revenue Share (%), by End-user Industry 2025 & 2033
- Figure 46: South America Epoxy Composite Industry Volume Share (%), by End-user Industry 2025 & 2033
- Figure 47: South America Epoxy Composite Industry Revenue (billion), by Country 2025 & 2033
- Figure 48: South America Epoxy Composite Industry Volume (K Tons), by Country 2025 & 2033
- Figure 49: South America Epoxy Composite Industry Revenue Share (%), by Country 2025 & 2033
- Figure 50: South America Epoxy Composite Industry Volume Share (%), by Country 2025 & 2033
- Figure 51: Middle East and Africa Epoxy Composite Industry Revenue (billion), by Fiber Type 2025 & 2033
- Figure 52: Middle East and Africa Epoxy Composite Industry Volume (K Tons), by Fiber Type 2025 & 2033
- Figure 53: Middle East and Africa Epoxy Composite Industry Revenue Share (%), by Fiber Type 2025 & 2033
- Figure 54: Middle East and Africa Epoxy Composite Industry Volume Share (%), by Fiber Type 2025 & 2033
- Figure 55: Middle East and Africa Epoxy Composite Industry Revenue (billion), by End-user Industry 2025 & 2033
- Figure 56: Middle East and Africa Epoxy Composite Industry Volume (K Tons), by End-user Industry 2025 & 2033
- Figure 57: Middle East and Africa Epoxy Composite Industry Revenue Share (%), by End-user Industry 2025 & 2033
- Figure 58: Middle East and Africa Epoxy Composite Industry Volume Share (%), by End-user Industry 2025 & 2033
- Figure 59: Middle East and Africa Epoxy Composite Industry Revenue (billion), by Country 2025 & 2033
- Figure 60: Middle East and Africa Epoxy Composite Industry Volume (K Tons), by Country 2025 & 2033
- Figure 61: Middle East and Africa Epoxy Composite Industry Revenue Share (%), by Country 2025 & 2033
- Figure 62: Middle East and Africa Epoxy Composite Industry Volume Share (%), by Country 2025 & 2033
List of Tables
- Table 1: Global Epoxy Composite Industry Revenue billion Forecast, by Fiber Type 2020 & 2033
- Table 2: Global Epoxy Composite Industry Volume K Tons Forecast, by Fiber Type 2020 & 2033
- Table 3: Global Epoxy Composite Industry Revenue billion Forecast, by End-user Industry 2020 & 2033
- Table 4: Global Epoxy Composite Industry Volume K Tons Forecast, by End-user Industry 2020 & 2033
- Table 5: Global Epoxy Composite Industry Revenue billion Forecast, by Region 2020 & 2033
- Table 6: Global Epoxy Composite Industry Volume K Tons Forecast, by Region 2020 & 2033
- Table 7: Global Epoxy Composite Industry Revenue billion Forecast, by Fiber Type 2020 & 2033
- Table 8: Global Epoxy Composite Industry Volume K Tons Forecast, by Fiber Type 2020 & 2033
- Table 9: Global Epoxy Composite Industry Revenue billion Forecast, by End-user Industry 2020 & 2033
- Table 10: Global Epoxy Composite Industry Volume K Tons Forecast, by End-user Industry 2020 & 2033
- Table 11: Global Epoxy Composite Industry Revenue billion Forecast, by Country 2020 & 2033
- Table 12: Global Epoxy Composite Industry Volume K Tons Forecast, by Country 2020 & 2033
- Table 13: China Epoxy Composite Industry Revenue (billion) Forecast, by Application 2020 & 2033
- Table 14: China Epoxy Composite Industry Volume (K Tons) Forecast, by Application 2020 & 2033
- Table 15: India Epoxy Composite Industry Revenue (billion) Forecast, by Application 2020 & 2033
- Table 16: India Epoxy Composite Industry Volume (K Tons) Forecast, by Application 2020 & 2033
- Table 17: Japan Epoxy Composite Industry Revenue (billion) Forecast, by Application 2020 & 2033
- Table 18: Japan Epoxy Composite Industry Volume (K Tons) Forecast, by Application 2020 & 2033
- Table 19: South Korea Epoxy Composite Industry Revenue (billion) Forecast, by Application 2020 & 2033
- Table 20: South Korea Epoxy Composite Industry Volume (K Tons) Forecast, by Application 2020 & 2033
- Table 21: Malaysia Epoxy Composite Industry Revenue (billion) Forecast, by Application 2020 & 2033
- Table 22: Malaysia Epoxy Composite Industry Volume (K Tons) Forecast, by Application 2020 & 2033
- Table 23: Thailand Epoxy Composite Industry Revenue (billion) Forecast, by Application 2020 & 2033
- Table 24: Thailand Epoxy Composite Industry Volume (K Tons) Forecast, by Application 2020 & 2033
- Table 25: Indonesia Epoxy Composite Industry Revenue (billion) Forecast, by Application 2020 & 2033
- Table 26: Indonesia Epoxy Composite Industry Volume (K Tons) Forecast, by Application 2020 & 2033
- Table 27: Vietnam Epoxy Composite Industry Revenue (billion) Forecast, by Application 2020 & 2033
- Table 28: Vietnam Epoxy Composite Industry Volume (K Tons) Forecast, by Application 2020 & 2033
- Table 29: Rest of Asia Pacific Epoxy Composite Industry Revenue (billion) Forecast, by Application 2020 & 2033
- Table 30: Rest of Asia Pacific Epoxy Composite Industry Volume (K Tons) Forecast, by Application 2020 & 2033
- Table 31: Global Epoxy Composite Industry Revenue billion Forecast, by Fiber Type 2020 & 2033
- Table 32: Global Epoxy Composite Industry Volume K Tons Forecast, by Fiber Type 2020 & 2033
- Table 33: Global Epoxy Composite Industry Revenue billion Forecast, by End-user Industry 2020 & 2033
- Table 34: Global Epoxy Composite Industry Volume K Tons Forecast, by End-user Industry 2020 & 2033
- Table 35: Global Epoxy Composite Industry Revenue billion Forecast, by Country 2020 & 2033
- Table 36: Global Epoxy Composite Industry Volume K Tons Forecast, by Country 2020 & 2033
- Table 37: United States Epoxy Composite Industry Revenue (billion) Forecast, by Application 2020 & 2033
- Table 38: United States Epoxy Composite Industry Volume (K Tons) Forecast, by Application 2020 & 2033
- Table 39: Canada Epoxy Composite Industry Revenue (billion) Forecast, by Application 2020 & 2033
- Table 40: Canada Epoxy Composite Industry Volume (K Tons) Forecast, by Application 2020 & 2033
- Table 41: Mexico Epoxy Composite Industry Revenue (billion) Forecast, by Application 2020 & 2033
- Table 42: Mexico Epoxy Composite Industry Volume (K Tons) Forecast, by Application 2020 & 2033
- Table 43: Global Epoxy Composite Industry Revenue billion Forecast, by Fiber Type 2020 & 2033
- Table 44: Global Epoxy Composite Industry Volume K Tons Forecast, by Fiber Type 2020 & 2033
- Table 45: Global Epoxy Composite Industry Revenue billion Forecast, by End-user Industry 2020 & 2033
- Table 46: Global Epoxy Composite Industry Volume K Tons Forecast, by End-user Industry 2020 & 2033
- Table 47: Global Epoxy Composite Industry Revenue billion Forecast, by Country 2020 & 2033
- Table 48: Global Epoxy Composite Industry Volume K Tons Forecast, by Country 2020 & 2033
- Table 49: Germany Epoxy Composite Industry Revenue (billion) Forecast, by Application 2020 & 2033
- Table 50: Germany Epoxy Composite Industry Volume (K Tons) Forecast, by Application 2020 & 2033
- Table 51: United Kingdom Epoxy Composite Industry Revenue (billion) Forecast, by Application 2020 & 2033
- Table 52: United Kingdom Epoxy Composite Industry Volume (K Tons) Forecast, by Application 2020 & 2033
- Table 53: Italy Epoxy Composite Industry Revenue (billion) Forecast, by Application 2020 & 2033
- Table 54: Italy Epoxy Composite Industry Volume (K Tons) Forecast, by Application 2020 & 2033
- Table 55: France Epoxy Composite Industry Revenue (billion) Forecast, by Application 2020 & 2033
- Table 56: France Epoxy Composite Industry Volume (K Tons) Forecast, by Application 2020 & 2033
- Table 57: Spain Epoxy Composite Industry Revenue (billion) Forecast, by Application 2020 & 2033
- Table 58: Spain Epoxy Composite Industry Volume (K Tons) Forecast, by Application 2020 & 2033
- Table 59: NORDIC Countries Epoxy Composite Industry Revenue (billion) Forecast, by Application 2020 & 2033
- Table 60: NORDIC Countries Epoxy Composite Industry Volume (K Tons) Forecast, by Application 2020 & 2033
- Table 61: Turkey Epoxy Composite Industry Revenue (billion) Forecast, by Application 2020 & 2033
- Table 62: Turkey Epoxy Composite Industry Volume (K Tons) Forecast, by Application 2020 & 2033
- Table 63: Russia Epoxy Composite Industry Revenue (billion) Forecast, by Application 2020 & 2033
- Table 64: Russia Epoxy Composite Industry Volume (K Tons) Forecast, by Application 2020 & 2033
- Table 65: Rest of Europe Epoxy Composite Industry Revenue (billion) Forecast, by Application 2020 & 2033
- Table 66: Rest of Europe Epoxy Composite Industry Volume (K Tons) Forecast, by Application 2020 & 2033
- Table 67: Global Epoxy Composite Industry Revenue billion Forecast, by Fiber Type 2020 & 2033
- Table 68: Global Epoxy Composite Industry Volume K Tons Forecast, by Fiber Type 2020 & 2033
- Table 69: Global Epoxy Composite Industry Revenue billion Forecast, by End-user Industry 2020 & 2033
- Table 70: Global Epoxy Composite Industry Volume K Tons Forecast, by End-user Industry 2020 & 2033
- Table 71: Global Epoxy Composite Industry Revenue billion Forecast, by Country 2020 & 2033
- Table 72: Global Epoxy Composite Industry Volume K Tons Forecast, by Country 2020 & 2033
- Table 73: Brazil Epoxy Composite Industry Revenue (billion) Forecast, by Application 2020 & 2033
- Table 74: Brazil Epoxy Composite Industry Volume (K Tons) Forecast, by Application 2020 & 2033
- Table 75: Argentina Epoxy Composite Industry Revenue (billion) Forecast, by Application 2020 & 2033
- Table 76: Argentina Epoxy Composite Industry Volume (K Tons) Forecast, by Application 2020 & 2033
- Table 77: Colombia Epoxy Composite Industry Revenue (billion) Forecast, by Application 2020 & 2033
- Table 78: Colombia Epoxy Composite Industry Volume (K Tons) Forecast, by Application 2020 & 2033
- Table 79: Rest of South America Epoxy Composite Industry Revenue (billion) Forecast, by Application 2020 & 2033
- Table 80: Rest of South America Epoxy Composite Industry Volume (K Tons) Forecast, by Application 2020 & 2033
- Table 81: Global Epoxy Composite Industry Revenue billion Forecast, by Fiber Type 2020 & 2033
- Table 82: Global Epoxy Composite Industry Volume K Tons Forecast, by Fiber Type 2020 & 2033
- Table 83: Global Epoxy Composite Industry Revenue billion Forecast, by End-user Industry 2020 & 2033
- Table 84: Global Epoxy Composite Industry Volume K Tons Forecast, by End-user Industry 2020 & 2033
- Table 85: Global Epoxy Composite Industry Revenue billion Forecast, by Country 2020 & 2033
- Table 86: Global Epoxy Composite Industry Volume K Tons Forecast, by Country 2020 & 2033
- Table 87: Saudi Arabia Epoxy Composite Industry Revenue (billion) Forecast, by Application 2020 & 2033
- Table 88: Saudi Arabia Epoxy Composite Industry Volume (K Tons) Forecast, by Application 2020 & 2033
- Table 89: South Africa Epoxy Composite Industry Revenue (billion) Forecast, by Application 2020 & 2033
- Table 90: South Africa Epoxy Composite Industry Volume (K Tons) Forecast, by Application 2020 & 2033
- Table 91: Nigeria Epoxy Composite Industry Revenue (billion) Forecast, by Application 2020 & 2033
- Table 92: Nigeria Epoxy Composite Industry Volume (K Tons) Forecast, by Application 2020 & 2033
- Table 93: Qatar Epoxy Composite Industry Revenue (billion) Forecast, by Application 2020 & 2033
- Table 94: Qatar Epoxy Composite Industry Volume (K Tons) Forecast, by Application 2020 & 2033
- Table 95: Egypt Epoxy Composite Industry Revenue (billion) Forecast, by Application 2020 & 2033
- Table 96: Egypt Epoxy Composite Industry Volume (K Tons) Forecast, by Application 2020 & 2033
- Table 97: United Arab Emirates Epoxy Composite Industry Revenue (billion) Forecast, by Application 2020 & 2033
- Table 98: United Arab Emirates Epoxy Composite Industry Volume (K Tons) Forecast, by Application 2020 & 2033
- Table 99: Rest of Middle East and Africa Epoxy Composite Industry Revenue (billion) Forecast, by Application 2020 & 2033
- Table 100: Rest of Middle East and Africa Epoxy Composite Industry Volume (K Tons) Forecast, by Application 2020 & 2033
Frequently Asked Questions
1. What is the projected Compound Annual Growth Rate (CAGR) of the Epoxy Composite Industry?
The projected CAGR is approximately 7.1%.
2. Which companies are prominent players in the Epoxy Composite Industry?
Key companies in the market include SGL Carbon, Mitsubishi Chemical Corporation, Park Aerospace Corp, Sanders Composites, Axiom Materials, Barrday, Veplas d d , Hexcel Corporation.
3. What are the main segments of the Epoxy Composite Industry?
The market segments include Fiber Type, End-user Industry.
4. Can you provide details about the market size?
The market size is estimated to be USD 35.04 billion as of 2022.
5. What are some drivers contributing to market growth?
Growing Demand from the Wind Energy Sector; Other Drivers.
6. What are the notable trends driving market growth?
Growing Demand from the Aerospace and Defense Industry.
7. Are there any restraints impacting market growth?
Availability of Close Substitutes; Unfavorable Conditions Arising Due to COVID-19 Outbreak.
8. Can you provide examples of recent developments in the market?
N/A
9. What pricing options are available for accessing the report?
Pricing options include single-user, multi-user, and enterprise licenses priced at USD 4750, USD 5250, and USD 8750 respectively.
10. Is the market size provided in terms of value or volume?
The market size is provided in terms of value, measured in billion and volume, measured in K Tons.
11. Are there any specific market keywords associated with the report?
Yes, the market keyword associated with the report is "Epoxy Composite Industry," which aids in identifying and referencing the specific market segment covered.
12. How do I determine which pricing option suits my needs best?
The pricing options vary based on user requirements and access needs. Individual users may opt for single-user licenses, while businesses requiring broader access may choose multi-user or enterprise licenses for cost-effective access to the report.
13. Are there any additional resources or data provided in the Epoxy Composite Industry report?
While the report offers comprehensive insights, it's advisable to review the specific contents or supplementary materials provided to ascertain if additional resources or data are available.
14. How can I stay updated on further developments or reports in the Epoxy Composite Industry?
To stay informed about further developments, trends, and reports in the Epoxy Composite Industry, consider subscribing to industry newsletters, following relevant companies and organizations, or regularly checking reputable industry news sources and publications.
Methodology
Step 1 - Identification of Relevant Samples Size from Population Database


Step 2 - Approaches for Defining Global Market Size (Value, Volume* & Price*)

Note*: In applicable scenarios
Step 3 - Data Sources
Primary Research
- Web Analytics
- Survey Reports
- Research Institute
- Latest Research Reports
- Opinion Leaders
Secondary Research
- Annual Reports
- White Paper
- Latest Press Release
- Industry Association
- Paid Database
- Investor Presentations

Step 4 - Data Triangulation
Involves using different sources of information in order to increase the validity of a study
These sources are likely to be stakeholders in a program - participants, other researchers, program staff, other community members, and so on.
Then we put all data in single framework & apply various statistical tools to find out the dynamic on the market.
During the analysis stage, feedback from the stakeholder groups would be compared to determine areas of agreement as well as areas of divergence