

Key Insights
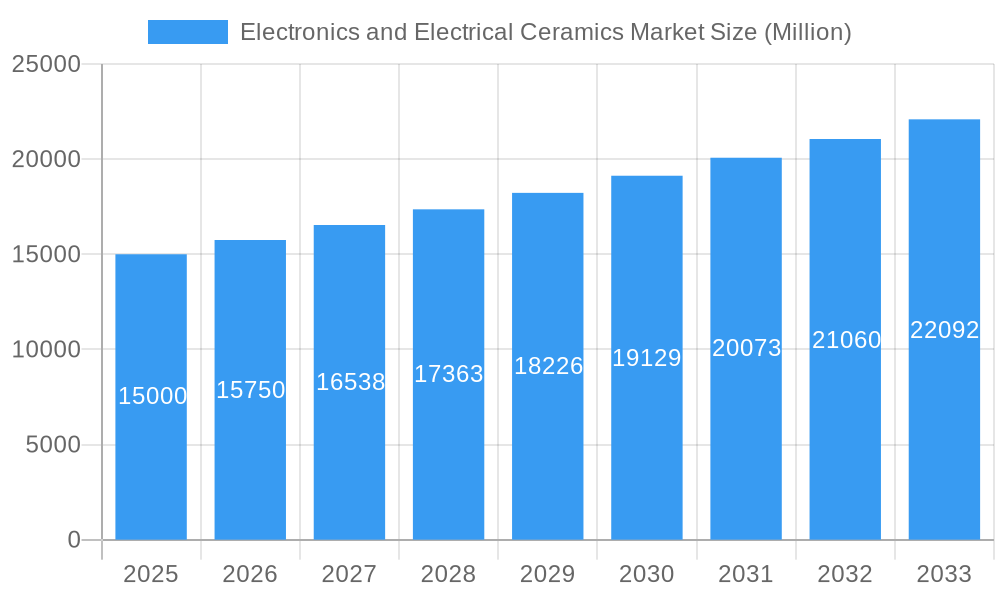
The global electronics and electrical ceramics market is experiencing robust growth, projected to maintain a Compound Annual Growth Rate (CAGR) exceeding 5% from 2025 to 2033. This expansion is driven by several key factors. The increasing demand for miniaturized and high-performance electronic components across various sectors, including consumer appliances (smartphones, wearables), power grids (advanced energy storage solutions), and medical devices (sensors, implants), fuels market growth. Technological advancements in material science, leading to the development of improved ceramic materials like alumina, zirconia, and titanate ceramics with enhanced properties such as higher dielectric strength and thermal conductivity, further contribute to market expansion. The rising adoption of electric vehicles and renewable energy technologies also presents significant growth opportunities for specialized ceramic components in power electronics and energy storage systems. While the market faces some constraints such as the high cost of advanced ceramic materials and the complexity of manufacturing processes, these challenges are being mitigated through ongoing research and development efforts focused on cost-effective production techniques and the exploration of alternative materials. The Asia-Pacific region, particularly China and India, is expected to dominate the market due to rapid industrialization and the burgeoning electronics manufacturing sector. However, North America and Europe will remain important markets, driven by strong demand from advanced technology sectors and a focus on sustainable energy solutions.
Electronics and Electrical Ceramics Market Market Size (In Billion)
The market segmentation reveals a diverse landscape, with monolithic ceramics maintaining the largest share by product type due to their wide applicability. However, ceramic matrix composites and ceramic coatings are witnessing significant growth due to their superior performance characteristics in high-temperature and high-stress applications. In terms of end-user industries, consumer appliances currently dominate, but the medical devices and power grids segments are exhibiting faster growth rates, indicating a shift towards more technologically advanced applications. Key players in the market, including Heraeus Holding, Saint-Gobain, and NGK INSULATORS LTD, are actively engaged in strategic partnerships, acquisitions, and research & development activities to consolidate their market positions and expand their product portfolios. The long-term outlook remains positive, with continuous innovations in material science and manufacturing technologies promising further market expansion in the coming years.
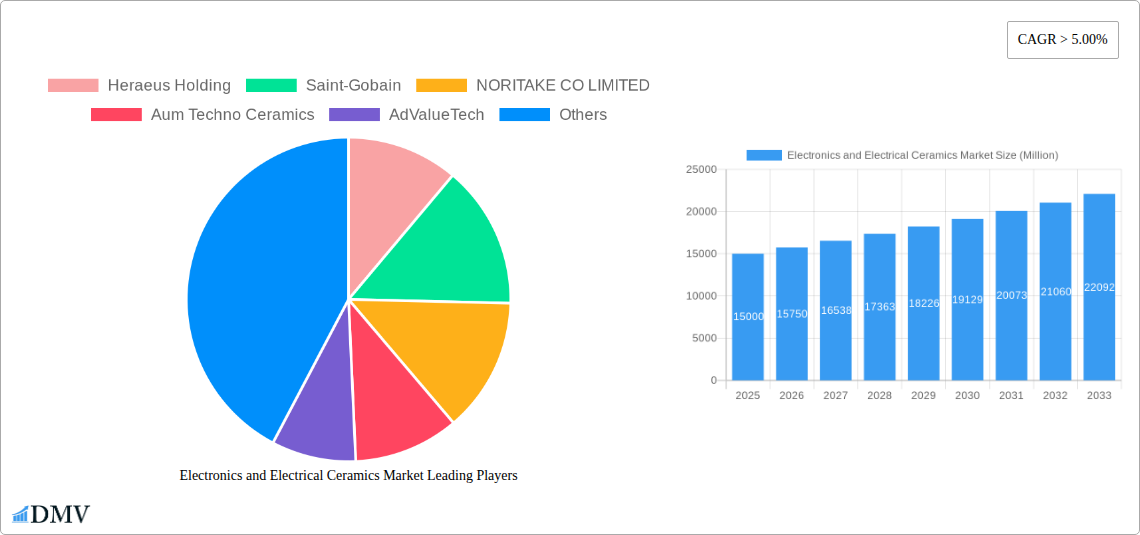
Electronics and Electrical Ceramics Market Company Market Share
Electronics and Electrical Ceramics Market: A Comprehensive Report (2019-2033)
This insightful report provides a detailed analysis of the Electronics and Electrical Ceramics Market, offering a comprehensive overview of market trends, leading players, and future growth prospects. The study period spans from 2019 to 2033, with 2025 serving as the base and estimated year. The report leverages extensive market research and data analysis to deliver actionable insights for stakeholders across the electronics and electrical ceramics value chain. The market is segmented by product type (Monolithic Ceramics, Ceramic Matrix Composites, Ceramic Coatings, Others), end-user industry (Consumer Appliances, Power Grids, Medical Devices, Others), and material type (Alumina Ceramics, Titanate Ceramics, Zirconia Ceramics, Silica Ceramics, Others). The total market size is estimated at xx Million in 2025 and is projected to reach xx Million by 2033, exhibiting a CAGR of xx% during the forecast period (2025-2033).
Electronics and Electrical Ceramics Market Market Composition & Trends
This section delves into the competitive landscape of the Electronics and Electrical Ceramics Market, analyzing market concentration, innovation drivers, regulatory frameworks, substitute products, end-user profiles, and merger & acquisition (M&A) activities. We examine the market share distribution among key players, including Heraeus Holding, Saint-Gobain, NORITAKE CO LIMITED, Aum Techno Ceramics, AdValueTech, NGK INSULATORS LTD, KCM Corporation Co Ltd, IBIDEN, CoorsTek Inc, NIPPON CARBIDE INDUSTRIES CO INC, CeramTec, TAYCA, MARUWA Co Ltd, Murata Manufacturing Co Ltd, and Kyocera Group. The report further investigates the impact of technological advancements, evolving regulations, and the emergence of substitute materials on market dynamics. Analysis includes an assessment of M&A activities within the industry, including deal values and their influence on market consolidation. The market share distribution in 2025 is estimated as follows: Heraeus Holding (xx%), Saint-Gobain (xx%), NORITAKE CO LIMITED (xx%), and others (xx%). Total M&A deal value in the historical period (2019-2024) is estimated at xx Million.
- Market Concentration: High/Medium/Low (Choose one based on analysis)
- Innovation Catalysts: Advancements in material science, miniaturization trends.
- Regulatory Landscape: Impact of RoHS, REACH, and other relevant regulations.
- Substitute Products: Analysis of alternative materials and their market penetration.
- End-User Profiles: Detailed analysis of consumer appliance, power grid, and medical device sectors.
Electronics and Electrical Ceramics Market Industry Evolution
This section provides a detailed historical and future outlook on the Electronics and Electrical Ceramics Market, analyzing market growth trajectories, technological advancements, and evolving consumer demands. The report examines the historical period (2019-2024) and projects the market's growth trajectory until 2033. We explore the impact of technological innovations, such as the development of high-performance ceramics and advanced manufacturing techniques, on market growth. Furthermore, we analyze the influence of shifting consumer preferences towards energy efficiency and miniaturization. The market witnessed a growth rate of xx% during the historical period (2019-2024) primarily driven by [mention specific factors]. Adoption rates for specific ceramic types, such as alumina ceramics in consumer electronics, are also analyzed. Specific data points like growth rates and adoption metrics are provided throughout this analysis. The forecasted growth rate for 2025-2033 is xx%, driven by [mention factors].
Leading Regions, Countries, or Segments in Electronics and Electrical Ceramics Market
This section identifies the dominant regions, countries, and segments within the Electronics and Electrical Ceramics Market. The analysis encompasses product type, end-user industry, and material type. Key drivers for dominance in each segment are explored.
Dominant Region/Country: [Specify region/country and provide rationale]
- Product Type:
- Monolithic Ceramics: High demand driven by [mention factors].
- Ceramic Matrix Composites: Growth driven by [mention factors].
- Ceramic Coatings: Expanding applications in [mention sectors].
- Others: Market share and growth potential.
- End-User Industry:
- Consumer Appliances: High volume driven by [mention factors].
- Power Grids: Growth fuelled by [mention factors].
- Medical Devices: Demand driven by [mention factors].
- Others: Market share and growth potential.
- Material Type:
- Alumina Ceramics: Wide application in various sectors.
- Titanate Ceramics: Specific application niches.
- Zirconia Ceramics: High-performance applications.
- Silica Ceramics: Specific application niches.
- Others: Market share and growth potential
Electronics and Electrical Ceramics Market Product Innovations
Recent advancements in electronics and electrical ceramics have led to the development of novel materials with improved properties, such as enhanced dielectric strength, thermal conductivity, and chemical resistance. These innovations include the introduction of [mention specific examples], resulting in improved device performance and miniaturization. Unique selling propositions (USPs) include [mention USPs]. These advancements are driving adoption in various applications, impacting overall market growth.
Propelling Factors for Electronics and Electrical Ceramics Market Growth
Several key factors are driving the growth of the Electronics and Electrical Ceramics Market. These include:
- Technological Advancements: Development of new materials with enhanced properties.
- Economic Growth: Increasing demand from emerging economies.
- Stringent Regulations: Demand for environmentally friendly materials.
- Rising Demand in Specific Sectors: Growth in consumer electronics, automotive, and medical industries.
Obstacles in the Electronics and Electrical Ceramics Market Market
Several challenges hinder the growth of the Electronics and Electrical Ceramics Market. These include:
- Regulatory Hurdles: Compliance costs and restrictions on certain materials.
- Supply Chain Disruptions: Global supply chain volatility impacting material availability and pricing.
- Intense Competition: Presence of numerous established and emerging players.
- High Manufacturing Costs: Impeding market penetration in price-sensitive segments.
Future Opportunities in Electronics and Electrical Ceramics Market
Emerging opportunities in the Electronics and Electrical Ceramics Market include:
- Expansion into New Markets: Untapped potential in developing economies.
- Technological Breakthroughs: Advancements in material science and manufacturing processes.
- New Applications: Growth in emerging sectors like renewable energy and aerospace.
- Sustainable Materials: Increased focus on environmentally friendly ceramics.
Major Players in the Electronics and Electrical Ceramics Market Ecosystem
- Heraeus Holding
- Saint-Gobain
- NORITAKE CO LIMITED
- Aum Techno Ceramics
- AdValueTech
- NGK INSULATORS LTD
- KCM Corporation Co Ltd
- IBIDEN
- CoorsTek Inc
- NIPPON CARBIDE INDUSTRIES CO INC
- CeramTec
- TAYCA
- MARUWA Co Ltd
- Murata Manufacturing Co Ltd
- Kyocera Group
Key Developments in Electronics and Electrical Ceramics Market Industry
- [Month, Year]: [Company Name] launches a new [product type] with enhanced [property].
- [Month, Year]: [Company A] and [Company B] announce a merger, creating a larger player in the market.
- [Month, Year]: New regulations are implemented impacting the use of [specific material].
- [Month, Year]: Significant investment in R&D for advanced ceramics.
(Add more bullet points as needed with specific events and their impacts.)
Strategic Electronics and Electrical Ceramics Market Market Forecast
The Electronics and Electrical Ceramics Market is poised for significant growth in the coming years, driven by technological advancements, rising demand from diverse end-user industries, and the increasing adoption of sustainable materials. The market is expected to witness substantial expansion across various segments, driven by innovations and opportunities in high-growth markets. This positive outlook is supported by projections indicating a robust CAGR during the forecast period (2025-2033).
Electronics and Electrical Ceramics Market Segmentation
-
1. Material Type
- 1.1. Alumina Ceramics
- 1.2. Titanate Ceramics
- 1.3. Zirconia Ceramics
- 1.4. Silica Ceramics
- 1.5. Others
-
2. Product Type
- 2.1. Monolithic Ceramics
- 2.2. Ceramic Matrix Composites
- 2.3. Ceramic Coatings
- 2.4. Others
-
3. End-user Industry
- 3.1. Consumer Appliances
- 3.2. Power Grids
- 3.3. Medical Devices
- 3.4. Others
Electronics and Electrical Ceramics Market Segmentation By Geography
-
1. Asia Pacific
- 1.1. China
- 1.2. India
- 1.3. Japan
- 1.4. South Korea
- 1.5. Rest of Asia Pacific
-
2. North America
- 2.1. United States
- 2.2. Canada
- 2.3. Mexico
-
3. Europe
- 3.1. Germany
- 3.2. United Kingdom
- 3.3. France
- 3.4. Italy
- 3.5. Rest of Europe
-
4. South America
- 4.1. Brazil
- 4.2. Argentina
- 4.3. Rest of South America
-
5. Middle East and Africa
- 5.1. Saudi Arabia
- 5.2. South Africa
- 5.3. Rest of Middle East and Africa
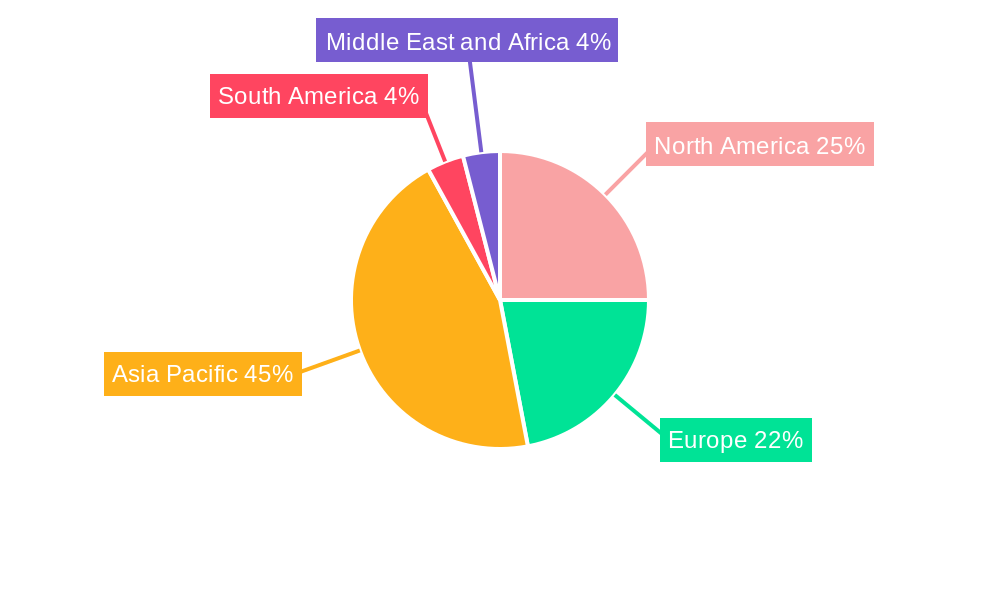
Electronics and Electrical Ceramics Market Regional Market Share
Geographic Coverage of Electronics and Electrical Ceramics Market
Electronics and Electrical Ceramics Market REPORT HIGHLIGHTS
| Aspects | Details |
|---|---|
| Study Period | 2020-2034 |
| Base Year | 2025 |
| Estimated Year | 2026 |
| Forecast Period | 2026-2034 |
| Historical Period | 2020-2025 |
| Growth Rate | CAGR of 6.8% from 2020-2034 |
| Segmentation |
|
Table of Contents
- 1. Introduction
- 1.1. Research Scope
- 1.2. Market Segmentation
- 1.3. Research Objective
- 1.4. Definitions and Assumptions
- 2. Executive Summary
- 2.1. Market Snapshot
- 3. Market Dynamics
- 3.1. Market Drivers
- 3.2. Market Restrains
- 3.3. Market Trends
- 3.4. Market Opportunities
- 4. Market Factor Analysis
- 4.1. Porters Five Forces
- 4.1.1. Bargaining Power of Suppliers
- 4.1.2. Bargaining Power of Buyers
- 4.1.3. Threat of New Entrants
- 4.1.4. Threat of Substitutes
- 4.1.5. Competitive Rivalry
- 4.2. PESTEL analysis
- 4.3. BCG Analysis
- 4.3.1. Stars (High Growth, High Market Share)
- 4.3.2. Cash Cows (Low Growth, High Market Share)
- 4.3.3. Question Mark (High Growth, Low Market Share)
- 4.3.4. Dogs (Low Growth, Low Market Share)
- 4.4. Ansoff Matrix Analysis
- 4.5. Supply Chain Analysis
- 4.6. Regulatory Landscape
- 4.7. Current Market Potential and Opportunity Assessment (TAM–SAM–SOM Framework)
- 4.8. DMV Analyst Note
- 4.1. Porters Five Forces
- 5. Market Analysis, Insights and Forecast 2021-2033
- 5.1. Market Analysis, Insights and Forecast - by Material Type
- 5.1.1. Alumina Ceramics
- 5.1.2. Titanate Ceramics
- 5.1.3. Zirconia Ceramics
- 5.1.4. Silica Ceramics
- 5.1.5. Others
- 5.2. Market Analysis, Insights and Forecast - by Product Type
- 5.2.1. Monolithic Ceramics
- 5.2.2. Ceramic Matrix Composites
- 5.2.3. Ceramic Coatings
- 5.2.4. Others
- 5.3. Market Analysis, Insights and Forecast - by End-user Industry
- 5.3.1. Consumer Appliances
- 5.3.2. Power Grids
- 5.3.3. Medical Devices
- 5.3.4. Others
- 5.4. Market Analysis, Insights and Forecast - by Region
- 5.4.1. Asia Pacific
- 5.4.2. North America
- 5.4.3. Europe
- 5.4.4. South America
- 5.4.5. Middle East and Africa
- 5.1. Market Analysis, Insights and Forecast - by Material Type
- 6. Global Electronics and Electrical Ceramics Market Analysis, Insights and Forecast, 2021-2033
- 6.1. Market Analysis, Insights and Forecast - by Material Type
- 6.1.1. Alumina Ceramics
- 6.1.2. Titanate Ceramics
- 6.1.3. Zirconia Ceramics
- 6.1.4. Silica Ceramics
- 6.1.5. Others
- 6.2. Market Analysis, Insights and Forecast - by Product Type
- 6.2.1. Monolithic Ceramics
- 6.2.2. Ceramic Matrix Composites
- 6.2.3. Ceramic Coatings
- 6.2.4. Others
- 6.3. Market Analysis, Insights and Forecast - by End-user Industry
- 6.3.1. Consumer Appliances
- 6.3.2. Power Grids
- 6.3.3. Medical Devices
- 6.3.4. Others
- 6.1. Market Analysis, Insights and Forecast - by Material Type
- 7. Asia Pacific Electronics and Electrical Ceramics Market Analysis, Insights and Forecast, 2020-2032
- 7.1. Market Analysis, Insights and Forecast - by Material Type
- 7.1.1. Alumina Ceramics
- 7.1.2. Titanate Ceramics
- 7.1.3. Zirconia Ceramics
- 7.1.4. Silica Ceramics
- 7.1.5. Others
- 7.2. Market Analysis, Insights and Forecast - by Product Type
- 7.2.1. Monolithic Ceramics
- 7.2.2. Ceramic Matrix Composites
- 7.2.3. Ceramic Coatings
- 7.2.4. Others
- 7.3. Market Analysis, Insights and Forecast - by End-user Industry
- 7.3.1. Consumer Appliances
- 7.3.2. Power Grids
- 7.3.3. Medical Devices
- 7.3.4. Others
- 7.1. Market Analysis, Insights and Forecast - by Material Type
- 8. North America Electronics and Electrical Ceramics Market Analysis, Insights and Forecast, 2020-2032
- 8.1. Market Analysis, Insights and Forecast - by Material Type
- 8.1.1. Alumina Ceramics
- 8.1.2. Titanate Ceramics
- 8.1.3. Zirconia Ceramics
- 8.1.4. Silica Ceramics
- 8.1.5. Others
- 8.2. Market Analysis, Insights and Forecast - by Product Type
- 8.2.1. Monolithic Ceramics
- 8.2.2. Ceramic Matrix Composites
- 8.2.3. Ceramic Coatings
- 8.2.4. Others
- 8.3. Market Analysis, Insights and Forecast - by End-user Industry
- 8.3.1. Consumer Appliances
- 8.3.2. Power Grids
- 8.3.3. Medical Devices
- 8.3.4. Others
- 8.1. Market Analysis, Insights and Forecast - by Material Type
- 9. Europe Electronics and Electrical Ceramics Market Analysis, Insights and Forecast, 2020-2032
- 9.1. Market Analysis, Insights and Forecast - by Material Type
- 9.1.1. Alumina Ceramics
- 9.1.2. Titanate Ceramics
- 9.1.3. Zirconia Ceramics
- 9.1.4. Silica Ceramics
- 9.1.5. Others
- 9.2. Market Analysis, Insights and Forecast - by Product Type
- 9.2.1. Monolithic Ceramics
- 9.2.2. Ceramic Matrix Composites
- 9.2.3. Ceramic Coatings
- 9.2.4. Others
- 9.3. Market Analysis, Insights and Forecast - by End-user Industry
- 9.3.1. Consumer Appliances
- 9.3.2. Power Grids
- 9.3.3. Medical Devices
- 9.3.4. Others
- 9.1. Market Analysis, Insights and Forecast - by Material Type
- 10. South America Electronics and Electrical Ceramics Market Analysis, Insights and Forecast, 2020-2032
- 10.1. Market Analysis, Insights and Forecast - by Material Type
- 10.1.1. Alumina Ceramics
- 10.1.2. Titanate Ceramics
- 10.1.3. Zirconia Ceramics
- 10.1.4. Silica Ceramics
- 10.1.5. Others
- 10.2. Market Analysis, Insights and Forecast - by Product Type
- 10.2.1. Monolithic Ceramics
- 10.2.2. Ceramic Matrix Composites
- 10.2.3. Ceramic Coatings
- 10.2.4. Others
- 10.3. Market Analysis, Insights and Forecast - by End-user Industry
- 10.3.1. Consumer Appliances
- 10.3.2. Power Grids
- 10.3.3. Medical Devices
- 10.3.4. Others
- 10.1. Market Analysis, Insights and Forecast - by Material Type
- 11. Middle East and Africa Electronics and Electrical Ceramics Market Analysis, Insights and Forecast, 2020-2032
- 11.1. Market Analysis, Insights and Forecast - by Material Type
- 11.1.1. Alumina Ceramics
- 11.1.2. Titanate Ceramics
- 11.1.3. Zirconia Ceramics
- 11.1.4. Silica Ceramics
- 11.1.5. Others
- 11.2. Market Analysis, Insights and Forecast - by Product Type
- 11.2.1. Monolithic Ceramics
- 11.2.2. Ceramic Matrix Composites
- 11.2.3. Ceramic Coatings
- 11.2.4. Others
- 11.3. Market Analysis, Insights and Forecast - by End-user Industry
- 11.3.1. Consumer Appliances
- 11.3.2. Power Grids
- 11.3.3. Medical Devices
- 11.3.4. Others
- 11.1. Market Analysis, Insights and Forecast - by Material Type
- 12. Competitive Analysis
- 12.1. Company Profiles
- 12.1.1 Heraeus Holding
- 12.1.1.1. Company Overview
- 12.1.1.2. Products
- 12.1.1.3. Company Financials
- 12.1.1.4. SWOT Analysis
- 12.1.2 Saint-Gobain
- 12.1.2.1. Company Overview
- 12.1.2.2. Products
- 12.1.2.3. Company Financials
- 12.1.2.4. SWOT Analysis
- 12.1.3 NORITAKE CO LIMITED
- 12.1.3.1. Company Overview
- 12.1.3.2. Products
- 12.1.3.3. Company Financials
- 12.1.3.4. SWOT Analysis
- 12.1.4 Aum Techno Ceramics
- 12.1.4.1. Company Overview
- 12.1.4.2. Products
- 12.1.4.3. Company Financials
- 12.1.4.4. SWOT Analysis
- 12.1.5 AdValueTech
- 12.1.5.1. Company Overview
- 12.1.5.2. Products
- 12.1.5.3. Company Financials
- 12.1.5.4. SWOT Analysis
- 12.1.6 NGK INSULATORS LTD
- 12.1.6.1. Company Overview
- 12.1.6.2. Products
- 12.1.6.3. Company Financials
- 12.1.6.4. SWOT Analysis
- 12.1.7 KCM Corporation Co Ltd
- 12.1.7.1. Company Overview
- 12.1.7.2. Products
- 12.1.7.3. Company Financials
- 12.1.7.4. SWOT Analysis
- 12.1.8 IBIDEN
- 12.1.8.1. Company Overview
- 12.1.8.2. Products
- 12.1.8.3. Company Financials
- 12.1.8.4. SWOT Analysis
- 12.1.9 CoorsTek Inc
- 12.1.9.1. Company Overview
- 12.1.9.2. Products
- 12.1.9.3. Company Financials
- 12.1.9.4. SWOT Analysis
- 12.1.10 NIPPON CARBIDE INDUSTRIES CO INC
- 12.1.10.1. Company Overview
- 12.1.10.2. Products
- 12.1.10.3. Company Financials
- 12.1.10.4. SWOT Analysis
- 12.1.11 CeramTec
- 12.1.11.1. Company Overview
- 12.1.11.2. Products
- 12.1.11.3. Company Financials
- 12.1.11.4. SWOT Analysis
- 12.1.12 TAYCA*List Not Exhaustive
- 12.1.12.1. Company Overview
- 12.1.12.2. Products
- 12.1.12.3. Company Financials
- 12.1.12.4. SWOT Analysis
- 12.1.13 MARUWA Co Ltd
- 12.1.13.1. Company Overview
- 12.1.13.2. Products
- 12.1.13.3. Company Financials
- 12.1.13.4. SWOT Analysis
- 12.1.14 Murata Manufacturing Co Ltd
- 12.1.14.1. Company Overview
- 12.1.14.2. Products
- 12.1.14.3. Company Financials
- 12.1.14.4. SWOT Analysis
- 12.1.15 Kyocera Group
- 12.1.15.1. Company Overview
- 12.1.15.2. Products
- 12.1.15.3. Company Financials
- 12.1.15.4. SWOT Analysis
- 12.1.1 Heraeus Holding
- 12.2. Market Entropy
- 12.2.1 Company's Key Areas Served
- 12.2.2 Recent Developments
- 12.3. Company Market Share Analysis 2025
- 12.3.1 Top 5 Companies Market Share Analysis
- 12.3.2 Top 3 Companies Market Share Analysis
- 12.4. List of Potential Customers
- 13. Research Methodology
List of Figures
- Figure 1: Global Electronics and Electrical Ceramics Market Revenue Breakdown (billion, %) by Region 2025 & 2033
- Figure 2: Asia Pacific Electronics and Electrical Ceramics Market Revenue (billion), by Material Type 2025 & 2033
- Figure 3: Asia Pacific Electronics and Electrical Ceramics Market Revenue Share (%), by Material Type 2025 & 2033
- Figure 4: Asia Pacific Electronics and Electrical Ceramics Market Revenue (billion), by Product Type 2025 & 2033
- Figure 5: Asia Pacific Electronics and Electrical Ceramics Market Revenue Share (%), by Product Type 2025 & 2033
- Figure 6: Asia Pacific Electronics and Electrical Ceramics Market Revenue (billion), by End-user Industry 2025 & 2033
- Figure 7: Asia Pacific Electronics and Electrical Ceramics Market Revenue Share (%), by End-user Industry 2025 & 2033
- Figure 8: Asia Pacific Electronics and Electrical Ceramics Market Revenue (billion), by Country 2025 & 2033
- Figure 9: Asia Pacific Electronics and Electrical Ceramics Market Revenue Share (%), by Country 2025 & 2033
- Figure 10: North America Electronics and Electrical Ceramics Market Revenue (billion), by Material Type 2025 & 2033
- Figure 11: North America Electronics and Electrical Ceramics Market Revenue Share (%), by Material Type 2025 & 2033
- Figure 12: North America Electronics and Electrical Ceramics Market Revenue (billion), by Product Type 2025 & 2033
- Figure 13: North America Electronics and Electrical Ceramics Market Revenue Share (%), by Product Type 2025 & 2033
- Figure 14: North America Electronics and Electrical Ceramics Market Revenue (billion), by End-user Industry 2025 & 2033
- Figure 15: North America Electronics and Electrical Ceramics Market Revenue Share (%), by End-user Industry 2025 & 2033
- Figure 16: North America Electronics and Electrical Ceramics Market Revenue (billion), by Country 2025 & 2033
- Figure 17: North America Electronics and Electrical Ceramics Market Revenue Share (%), by Country 2025 & 2033
- Figure 18: Europe Electronics and Electrical Ceramics Market Revenue (billion), by Material Type 2025 & 2033
- Figure 19: Europe Electronics and Electrical Ceramics Market Revenue Share (%), by Material Type 2025 & 2033
- Figure 20: Europe Electronics and Electrical Ceramics Market Revenue (billion), by Product Type 2025 & 2033
- Figure 21: Europe Electronics and Electrical Ceramics Market Revenue Share (%), by Product Type 2025 & 2033
- Figure 22: Europe Electronics and Electrical Ceramics Market Revenue (billion), by End-user Industry 2025 & 2033
- Figure 23: Europe Electronics and Electrical Ceramics Market Revenue Share (%), by End-user Industry 2025 & 2033
- Figure 24: Europe Electronics and Electrical Ceramics Market Revenue (billion), by Country 2025 & 2033
- Figure 25: Europe Electronics and Electrical Ceramics Market Revenue Share (%), by Country 2025 & 2033
- Figure 26: South America Electronics and Electrical Ceramics Market Revenue (billion), by Material Type 2025 & 2033
- Figure 27: South America Electronics and Electrical Ceramics Market Revenue Share (%), by Material Type 2025 & 2033
- Figure 28: South America Electronics and Electrical Ceramics Market Revenue (billion), by Product Type 2025 & 2033
- Figure 29: South America Electronics and Electrical Ceramics Market Revenue Share (%), by Product Type 2025 & 2033
- Figure 30: South America Electronics and Electrical Ceramics Market Revenue (billion), by End-user Industry 2025 & 2033
- Figure 31: South America Electronics and Electrical Ceramics Market Revenue Share (%), by End-user Industry 2025 & 2033
- Figure 32: South America Electronics and Electrical Ceramics Market Revenue (billion), by Country 2025 & 2033
- Figure 33: South America Electronics and Electrical Ceramics Market Revenue Share (%), by Country 2025 & 2033
- Figure 34: Middle East and Africa Electronics and Electrical Ceramics Market Revenue (billion), by Material Type 2025 & 2033
- Figure 35: Middle East and Africa Electronics and Electrical Ceramics Market Revenue Share (%), by Material Type 2025 & 2033
- Figure 36: Middle East and Africa Electronics and Electrical Ceramics Market Revenue (billion), by Product Type 2025 & 2033
- Figure 37: Middle East and Africa Electronics and Electrical Ceramics Market Revenue Share (%), by Product Type 2025 & 2033
- Figure 38: Middle East and Africa Electronics and Electrical Ceramics Market Revenue (billion), by End-user Industry 2025 & 2033
- Figure 39: Middle East and Africa Electronics and Electrical Ceramics Market Revenue Share (%), by End-user Industry 2025 & 2033
- Figure 40: Middle East and Africa Electronics and Electrical Ceramics Market Revenue (billion), by Country 2025 & 2033
- Figure 41: Middle East and Africa Electronics and Electrical Ceramics Market Revenue Share (%), by Country 2025 & 2033
List of Tables
- Table 1: Global Electronics and Electrical Ceramics Market Revenue billion Forecast, by Material Type 2020 & 2033
- Table 2: Global Electronics and Electrical Ceramics Market Revenue billion Forecast, by Product Type 2020 & 2033
- Table 3: Global Electronics and Electrical Ceramics Market Revenue billion Forecast, by End-user Industry 2020 & 2033
- Table 4: Global Electronics and Electrical Ceramics Market Revenue billion Forecast, by Region 2020 & 2033
- Table 5: Global Electronics and Electrical Ceramics Market Revenue billion Forecast, by Material Type 2020 & 2033
- Table 6: Global Electronics and Electrical Ceramics Market Revenue billion Forecast, by Product Type 2020 & 2033
- Table 7: Global Electronics and Electrical Ceramics Market Revenue billion Forecast, by End-user Industry 2020 & 2033
- Table 8: Global Electronics and Electrical Ceramics Market Revenue billion Forecast, by Country 2020 & 2033
- Table 9: China Electronics and Electrical Ceramics Market Revenue (billion) Forecast, by Application 2020 & 2033
- Table 10: India Electronics and Electrical Ceramics Market Revenue (billion) Forecast, by Application 2020 & 2033
- Table 11: Japan Electronics and Electrical Ceramics Market Revenue (billion) Forecast, by Application 2020 & 2033
- Table 12: South Korea Electronics and Electrical Ceramics Market Revenue (billion) Forecast, by Application 2020 & 2033
- Table 13: Rest of Asia Pacific Electronics and Electrical Ceramics Market Revenue (billion) Forecast, by Application 2020 & 2033
- Table 14: Global Electronics and Electrical Ceramics Market Revenue billion Forecast, by Material Type 2020 & 2033
- Table 15: Global Electronics and Electrical Ceramics Market Revenue billion Forecast, by Product Type 2020 & 2033
- Table 16: Global Electronics and Electrical Ceramics Market Revenue billion Forecast, by End-user Industry 2020 & 2033
- Table 17: Global Electronics and Electrical Ceramics Market Revenue billion Forecast, by Country 2020 & 2033
- Table 18: United States Electronics and Electrical Ceramics Market Revenue (billion) Forecast, by Application 2020 & 2033
- Table 19: Canada Electronics and Electrical Ceramics Market Revenue (billion) Forecast, by Application 2020 & 2033
- Table 20: Mexico Electronics and Electrical Ceramics Market Revenue (billion) Forecast, by Application 2020 & 2033
- Table 21: Global Electronics and Electrical Ceramics Market Revenue billion Forecast, by Material Type 2020 & 2033
- Table 22: Global Electronics and Electrical Ceramics Market Revenue billion Forecast, by Product Type 2020 & 2033
- Table 23: Global Electronics and Electrical Ceramics Market Revenue billion Forecast, by End-user Industry 2020 & 2033
- Table 24: Global Electronics and Electrical Ceramics Market Revenue billion Forecast, by Country 2020 & 2033
- Table 25: Germany Electronics and Electrical Ceramics Market Revenue (billion) Forecast, by Application 2020 & 2033
- Table 26: United Kingdom Electronics and Electrical Ceramics Market Revenue (billion) Forecast, by Application 2020 & 2033
- Table 27: France Electronics and Electrical Ceramics Market Revenue (billion) Forecast, by Application 2020 & 2033
- Table 28: Italy Electronics and Electrical Ceramics Market Revenue (billion) Forecast, by Application 2020 & 2033
- Table 29: Rest of Europe Electronics and Electrical Ceramics Market Revenue (billion) Forecast, by Application 2020 & 2033
- Table 30: Global Electronics and Electrical Ceramics Market Revenue billion Forecast, by Material Type 2020 & 2033
- Table 31: Global Electronics and Electrical Ceramics Market Revenue billion Forecast, by Product Type 2020 & 2033
- Table 32: Global Electronics and Electrical Ceramics Market Revenue billion Forecast, by End-user Industry 2020 & 2033
- Table 33: Global Electronics and Electrical Ceramics Market Revenue billion Forecast, by Country 2020 & 2033
- Table 34: Brazil Electronics and Electrical Ceramics Market Revenue (billion) Forecast, by Application 2020 & 2033
- Table 35: Argentina Electronics and Electrical Ceramics Market Revenue (billion) Forecast, by Application 2020 & 2033
- Table 36: Rest of South America Electronics and Electrical Ceramics Market Revenue (billion) Forecast, by Application 2020 & 2033
- Table 37: Global Electronics and Electrical Ceramics Market Revenue billion Forecast, by Material Type 2020 & 2033
- Table 38: Global Electronics and Electrical Ceramics Market Revenue billion Forecast, by Product Type 2020 & 2033
- Table 39: Global Electronics and Electrical Ceramics Market Revenue billion Forecast, by End-user Industry 2020 & 2033
- Table 40: Global Electronics and Electrical Ceramics Market Revenue billion Forecast, by Country 2020 & 2033
- Table 41: Saudi Arabia Electronics and Electrical Ceramics Market Revenue (billion) Forecast, by Application 2020 & 2033
- Table 42: South Africa Electronics and Electrical Ceramics Market Revenue (billion) Forecast, by Application 2020 & 2033
- Table 43: Rest of Middle East and Africa Electronics and Electrical Ceramics Market Revenue (billion) Forecast, by Application 2020 & 2033
Frequently Asked Questions
1. What is the projected Compound Annual Growth Rate (CAGR) of the Electronics and Electrical Ceramics Market?
The projected CAGR is approximately 6.8%.
2. Which companies are prominent players in the Electronics and Electrical Ceramics Market?
Key companies in the market include Heraeus Holding, Saint-Gobain, NORITAKE CO LIMITED, Aum Techno Ceramics, AdValueTech, NGK INSULATORS LTD, KCM Corporation Co Ltd, IBIDEN, CoorsTek Inc, NIPPON CARBIDE INDUSTRIES CO INC, CeramTec, TAYCA*List Not Exhaustive, MARUWA Co Ltd, Murata Manufacturing Co Ltd, Kyocera Group.
3. What are the main segments of the Electronics and Electrical Ceramics Market?
The market segments include Material Type, Product Type, End-user Industry.
4. Can you provide details about the market size?
The market size is estimated to be USD 108.6 billion as of 2022.
5. What are some drivers contributing to market growth?
; Increase Demand for Consumer Electronics; Upcoming Power Generation Projects in Asia-Pacific.
6. What are the notable trends driving market growth?
Consumer Appliances Application to Dominate the Market.
7. Are there any restraints impacting market growth?
; Higher Cost Compared to Other Materials like Metals and Alloys; Unfavorable Conditions Arising Due to COVID-19 Outbreak.
8. Can you provide examples of recent developments in the market?
N/A
9. What pricing options are available for accessing the report?
Pricing options include single-user, multi-user, and enterprise licenses priced at USD 4750, USD 5250, and USD 8750 respectively.
10. Is the market size provided in terms of value or volume?
The market size is provided in terms of value, measured in billion.
11. Are there any specific market keywords associated with the report?
Yes, the market keyword associated with the report is "Electronics and Electrical Ceramics Market," which aids in identifying and referencing the specific market segment covered.
12. How do I determine which pricing option suits my needs best?
The pricing options vary based on user requirements and access needs. Individual users may opt for single-user licenses, while businesses requiring broader access may choose multi-user or enterprise licenses for cost-effective access to the report.
13. Are there any additional resources or data provided in the Electronics and Electrical Ceramics Market report?
While the report offers comprehensive insights, it's advisable to review the specific contents or supplementary materials provided to ascertain if additional resources or data are available.
14. How can I stay updated on further developments or reports in the Electronics and Electrical Ceramics Market?
To stay informed about further developments, trends, and reports in the Electronics and Electrical Ceramics Market, consider subscribing to industry newsletters, following relevant companies and organizations, or regularly checking reputable industry news sources and publications.
Methodology
Step 1 - Identification of Relevant Samples Size from Population Database


Step 2 - Approaches for Defining Global Market Size (Value, Volume* & Price*)

Note*: In applicable scenarios
Step 3 - Data Sources
Primary Research
- Web Analytics
- Survey Reports
- Research Institute
- Latest Research Reports
- Opinion Leaders
Secondary Research
- Annual Reports
- White Paper
- Latest Press Release
- Industry Association
- Paid Database
- Investor Presentations

Step 4 - Data Triangulation
Involves using different sources of information in order to increase the validity of a study
These sources are likely to be stakeholders in a program - participants, other researchers, program staff, other community members, and so on.
Then we put all data in single framework & apply various statistical tools to find out the dynamic on the market.
During the analysis stage, feedback from the stakeholder groups would be compared to determine areas of agreement as well as areas of divergence