

Key Insights
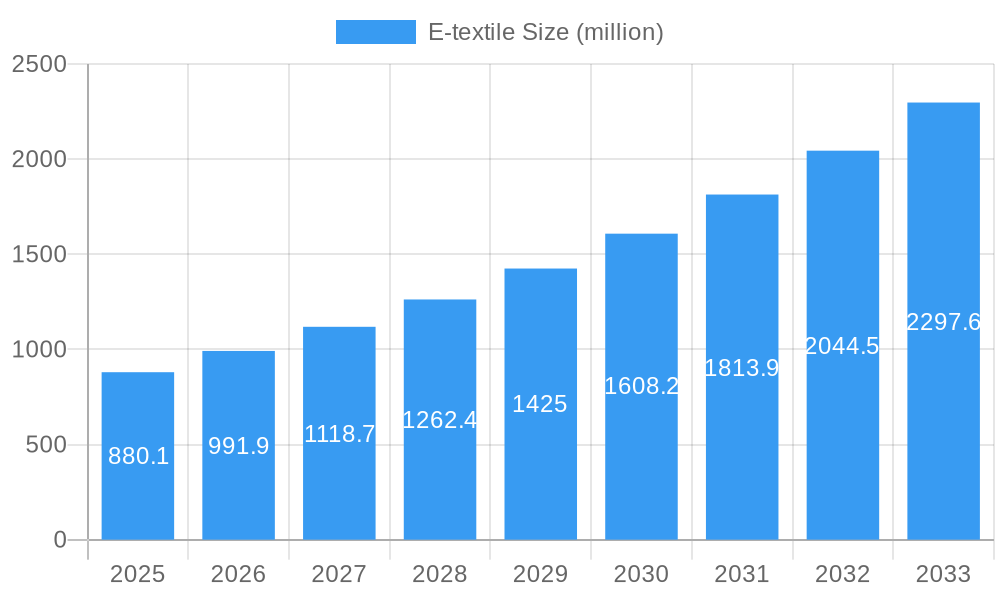
The global E-textile market is poised for substantial growth, driven by increasing innovation and expanding applications across various sectors. With a projected market size of $880.1 million in 2025, the industry is set to expand at a robust Compound Annual Growth Rate (CAGR) of 12.7% from 2019 to 2033. This impressive trajectory is fueled by escalating demand for smart textiles in military applications, where enhanced soldier performance and communication are paramount. Furthermore, the healthcare sector is increasingly adopting E-textiles for remote patient monitoring, wearable diagnostics, and therapeutic solutions, creating significant new avenues for market penetration. The civil uses, encompassing activewear, fashion, and automotive interiors, are also contributing to this growth as consumers embrace the convenience and advanced functionalities offered by integrated electronic capabilities in everyday fabrics.
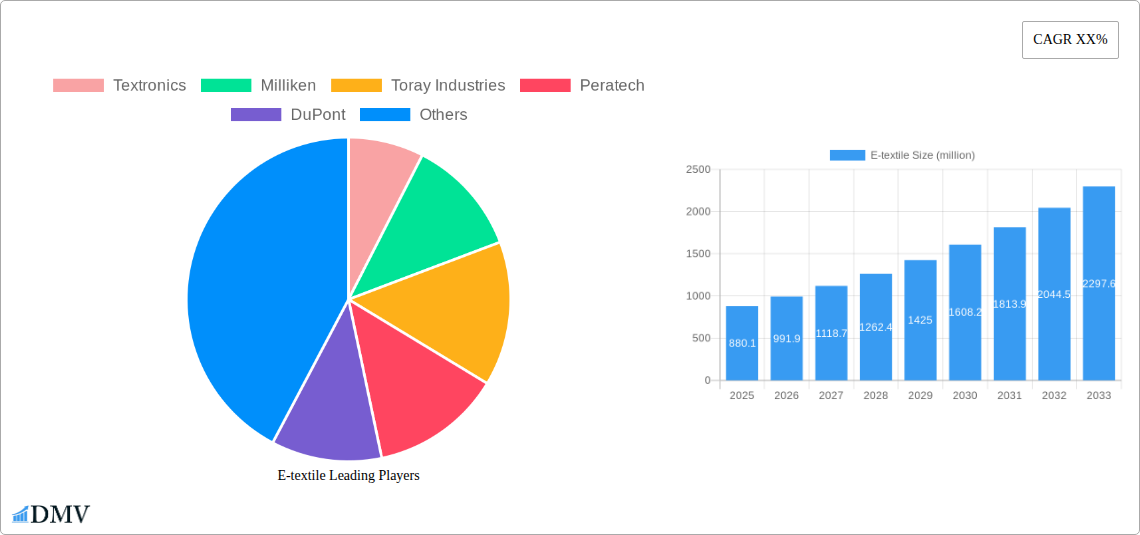
E-textile Market Size (In Million)
The market's expansion is further supported by ongoing advancements in materials science and miniaturization of electronic components, leading to more sophisticated and user-friendly E-textile products. Passive electronic textiles, which integrate conductive threads for simple functions, are evolving into active electronic textiles capable of sensing, processing, and communicating data. The emergence of ultra-electronic textiles, representing the next frontier in this domain, promises even more complex functionalities. Key industry players like Textronics, Milliken, and Toray Industries are at the forefront of these developments, investing heavily in research and development to introduce novel solutions. While the market benefits from strong demand drivers, potential restraints such as high manufacturing costs and the need for standardization in interoperability may pose challenges that require strategic mitigation. Nevertheless, the overall outlook for the E-textile market remains exceptionally positive, promising a transformative impact across numerous industries.
E-textile Company Market Share
E-textile Market Composition & Trends
The E-textile market, a rapidly evolving sector integrating electronics with textiles, is characterized by a dynamic mix of established players and emerging innovators. Market concentration is currently moderate, with a few key companies like Textronics, Milliken, and Toray Industries holding significant market shares in specific segments. However, the landscape is continuously shaped by substantial innovation, driven by advancements in conductive yarns, flexible sensors, and integrated power sources. The regulatory landscape is still developing, with a growing emphasis on safety, interoperability, and data privacy for wearable electronic devices. Substitute products, such as standalone wearable tech without integrated textile functionality, pose a competitive challenge, but the seamless integration and aesthetic appeal of e-textiles offer distinct advantages. End-user profiles range from military personnel requiring enhanced situational awareness and soldier systems to consumers seeking smart apparel for fitness tracking and health monitoring. The healthcare sector is a burgeoning area, with e-textiles enabling remote patient monitoring and advanced medical garments. Mergers and acquisitions (M&A) are becoming increasingly prevalent as larger companies seek to acquire innovative startups or expand their portfolios. For instance, M&A deal values in the e-textile ecosystem have reached an estimated XXX million over the historical period (2019-2024). The market share distribution across various applications like Military Uses (XX%), Civil Uses (XX%), and Healthcare Uses (XX%) is indicative of current adoption rates and future growth potential.
E-textile Industry Evolution
The E-textile industry has witnessed a transformative evolution, driven by a confluence of technological breakthroughs, increasing consumer demand for connected living, and strategic industry investments. The study period from 2019 to 2033, with a base year of 2025, projects a robust growth trajectory, underpinned by a compound annual growth rate (CAGR) estimated at XX% during the forecast period (2025–2033). This growth is fueled by relentless technological advancements in areas such as miniaturization of electronic components, development of highly flexible and durable conductive materials, and sophisticated integration techniques for seamless functionality. Companies like Peratech and DuPont are at the forefront of material science innovations, developing novel conductive inks and polymers that enhance the performance and washability of e-textiles. Texas Instruments and other semiconductor giants are contributing by providing specialized, low-power microcontrollers and sensors tailored for wearable applications. The consumer demand for smart garments has shifted significantly, moving beyond novelty to essential functionalities like health monitoring, enhanced athletic performance tracking, and interactive fashion. The adoption of Passive Electronic Textiles, characterized by embedded conductive threads for basic connectivity, is steadily increasing, while Active Electronic Textiles, incorporating sensors and microprocessors for more complex interactions, are gaining traction. Ultra-Electronic Textiles, representing the most advanced integration of AI and complex computational capabilities within fabrics, are on the horizon, promising revolutionary applications. The historical period (2019–2024) saw initial market penetration and proof-of-concept deployments, laying the groundwork for the accelerated growth anticipated in the coming years. Innovations in energy harvesting and storage within textiles are also crucial, addressing a key bottleneck for widespread adoption and paving the way for self-powered smart clothing. The increasing sophistication of haptic feedback, thermal regulation through materials like Outlast and Schoeller Textiles AG, and biometric sensing are further propelling the industry forward.
Leading Regions, Countries, or Segments in E-textile
The E-textile market's leadership is a multifaceted phenomenon, with distinct regions and segments demonstrating remarkable growth and innovation. Among the key segments, Civil Uses are emerging as a dominant force, driven by widespread consumer adoption and the integration of smart functionalities into everyday apparel. The projected market size for Civil Uses is estimated to reach XXX million by 2033.
Key Drivers for Dominance in Civil Uses:
- Consumer Demand for Wearable Technology: A burgeoning desire for integrated health monitoring, fitness tracking, and enhanced personal connectivity fuels the demand for smart clothing and accessories.
- Fashion and Lifestyle Integration: Leading fashion brands are increasingly incorporating e-textile technologies to offer unique, interactive, and performance-enhancing apparel, blurring the lines between technology and style.
- Advancements in User Interface and Experience: Companies like Clothing+ are focusing on creating comfortable, intuitive, and aesthetically pleasing e-textile solutions that seamlessly integrate into existing wardrobes.
- Falling Component Costs: The decreasing cost of micro-sensors, flexible displays, and low-power processors makes smart apparel more accessible to a broader consumer base.
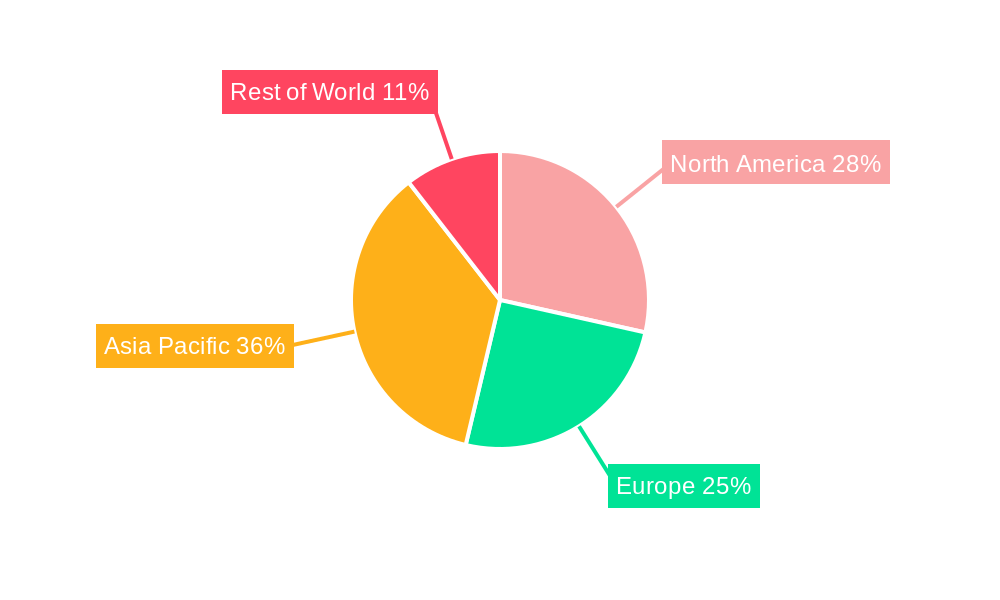
In terms of regional dominance, North America is currently leading the e-textile market, followed closely by Europe. This leadership is attributed to several factors:
- Strong R&D Ecosystem: The presence of leading research institutions and technology companies, including Texas Instruments and d3o lab, fosters continuous innovation and product development.
- Significant Venture Capital Investment: Robust investment in the wearable technology and smart textiles sector accelerates the commercialization of new products and technologies.
- Early Adoption of Smart Devices: North American consumers have historically shown a high propensity to adopt new technologies, including wearable devices, creating a fertile ground for e-textile integration.
- Supportive Regulatory Framework: Favorable policies and a clear regulatory path for the development and deployment of electronic components and consumer electronics contribute to market growth.
Within the Types of e-textiles, Active Electronic Textiles are currently experiencing the most significant growth, projected to account for XX% of the market share by 2033. These textiles go beyond passive conductivity to actively sense, process, and communicate data.
Key Drivers for Dominance in Active Electronic Textiles:
- Sophisticated Sensing Capabilities: Integration of advanced sensors for vital signs (e.g., heart rate, respiration), motion, and environmental factors. Companies like Peratech are instrumental in developing highly sensitive force-sensitive resistors.
- On-Textile Computing: The ability to embed microcontrollers and processors directly into the fabric enables real-time data analysis and personalized feedback.
- Interactive Features: Development of haptic feedback, embedded displays, and connectivity to external devices, enhancing user interaction.
- Application in Healthcare and Sports: Active e-textiles are crucial for remote patient monitoring, rehabilitation, and performance optimization for athletes.
While Military Uses and Healthcare Uses are significant niche markets with high growth potential, the sheer breadth of consumer applications in Civil Uses, coupled with the technological maturity of Active Electronic Textiles, positions them as the current leaders shaping the e-textile industry.
E-textile Product Innovations
E-textile product innovations are revolutionizing how we interact with our clothing and environment. Advancements in conductive yarns and inks, pioneered by companies like Toray Industries and DuPont, enable seamless integration of electronic functionalities into fabrics without compromising comfort or washability. This has led to the development of smart apparel capable of real-time biometric monitoring, with systems from Interactive Wear AG tracking heart rate, respiration, and even muscle activity. Exo2's heated clothing utilizes flexible heating elements for superior thermal regulation, while d3o lab's impact protection materials offer advanced shock absorption in lightweight, flexible forms. These innovations are enhancing performance in sports, improving safety in occupational settings, and enabling new frontiers in personalized healthcare.
Propelling Factors for E-textile Growth
The growth of the e-textile market is propelled by several converging factors. Technological advancements in miniaturization and flexibility of electronic components, alongside the development of durable conductive materials, are making e-textiles more practical and affordable. Increasing consumer demand for connected devices and smart wearable technology, driven by health and fitness trends, creates a strong market pull. Favorable government initiatives and research funding, particularly in defense and healthcare applications, further accelerate innovation and adoption. The development of advanced sensor technology by companies like Peratech and integrated solutions from Texas Instruments are key enablers. Furthermore, the growing awareness of the potential for e-textiles in remote patient monitoring and rehabilitation is opening up significant opportunities in the healthcare sector.
Obstacles in the E-textile Market
Despite its immense potential, the e-textile market faces several significant obstacles. Regulatory hurdles related to data privacy and device certification for wearable electronics can slow down product launches. Supply chain disruptions, particularly in the sourcing of specialized electronic components and conductive materials, can impact production timelines and costs. The high initial cost of some advanced e-textile products can also be a barrier to mass adoption, especially for consumer-grade items. Furthermore, challenges in ensuring the durability and washability of integrated electronics remain a key concern for end-users, impacting long-term product viability. Competitive pressures from traditional apparel and electronics manufacturers entering the market also present a challenge.
Future Opportunities in E-textile
The future of e-textiles is brimming with opportunities. The expansion of e-textiles into new markets, such as smart home textiles and advanced industrial safety gear, represents significant growth potential. Emerging technologies like integrated energy harvesting and self-healing conductive materials will address current limitations and enable more sophisticated applications. The growing trend towards personalized medicine and remote healthcare will drive demand for sophisticated e-textile solutions for continuous patient monitoring and diagnostics. Furthermore, the integration of artificial intelligence and machine learning directly within e-textile systems will unlock new levels of interactivity and data-driven insights, transforming user experiences.
Major Players in the E-textile Ecosystem
- Textronics
- Milliken
- Toray Industries
- Peratech
- DuPont
- Clothing+
- Outlast
- d3o lab
- Schoeller Textiles AG
- Texas Instruments
- Exo2
- Vista Medical Ltd.
- Ohmatex ApS
- Interactive Wear AG
Key Developments in E-textile Industry
- 2023 October: Peratech unveils new sensitive electronic textile technology for advanced haptic feedback.
- 2023 July: DuPont announces advancements in flexible conductive inks for printed electronics on textiles.
- 2023 April: Texas Instruments releases new low-power microcontrollers optimized for wearable and e-textile applications.
- 2022 December: Schoeller Textiles AG introduces a new range of smart fabrics with integrated thermal regulation capabilities.
- 2022 September: Clothing+ partners with a major fashion brand to launch a line of smart jackets with integrated connectivity.
- 2022 June: Outlast develops new phase change materials for enhanced temperature regulation in e-textiles.
- 2021 November: Vista Medical Ltd. showcases a smart garment for continuous blood pressure monitoring.
- 2021 August: Ohmatex ApS highlights progress in developing washable e-textile sensor arrays for sports analytics.
- 2021 March: Exo2 enhances its heated apparel line with improved battery life and wireless control.
- 2020 October: Interactive Wear AG demonstrates real-time gait analysis using embedded textile sensors.
- 2020 July: d3o lab introduces a new generation of flexible impact protection for sportswear.
- 2019-2024: Consistent M&A activities as larger corporations acquire innovative e-textile startups.
Strategic E-textile Market Forecast
The strategic forecast for the e-textile market is exceptionally positive, fueled by a synergistic combination of technological innovation, expanding application horizons, and increasing consumer and industry acceptance. The anticipated growth is driven by breakthroughs in materials science, power management, and data analytics, enabling truly intelligent and integrated textile solutions. Key growth catalysts include the increasing penetration of e-textiles in the healthcare sector for remote monitoring and personalized wellness, the continued evolution of smart apparel for athletic performance and everyday comfort, and the expanding utility in specialized military and industrial applications. The market potential is immense, as e-textiles are poised to become an indispensable component of the future connected world.
E-textile Segmentation
-
1. Application
- 1.1. Military Uses
- 1.2. Civil Uses
- 1.3. Healthcare Uses
- 1.4. Other
-
2. Types
- 2.1. Passive Electronic Textiles
- 2.2. Active Electronic Textiles
- 2.3. Ultra-Electronic Textiles
E-textile Segmentation By Geography
-
1. North America
- 1.1. United States
- 1.2. Canada
- 1.3. Mexico
-
2. South America
- 2.1. Brazil
- 2.2. Argentina
- 2.3. Rest of South America
-
3. Europe
- 3.1. United Kingdom
- 3.2. Germany
- 3.3. France
- 3.4. Italy
- 3.5. Spain
- 3.6. Russia
- 3.7. Benelux
- 3.8. Nordics
- 3.9. Rest of Europe
-
4. Middle East & Africa
- 4.1. Turkey
- 4.2. Israel
- 4.3. GCC
- 4.4. North Africa
- 4.5. South Africa
- 4.6. Rest of Middle East & Africa
-
5. Asia Pacific
- 5.1. China
- 5.2. India
- 5.3. Japan
- 5.4. South Korea
- 5.5. ASEAN
- 5.6. Oceania
- 5.7. Rest of Asia Pacific
E-textile Regional Market Share
Geographic Coverage of E-textile
E-textile REPORT HIGHLIGHTS
| Aspects | Details |
|---|---|
| Study Period | 2020-2034 |
| Base Year | 2025 |
| Estimated Year | 2026 |
| Forecast Period | 2026-2034 |
| Historical Period | 2020-2025 |
| Growth Rate | CAGR of 12.7% from 2020-2034 |
| Segmentation |
|
Table of Contents
- 1. Introduction
- 1.1. Research Scope
- 1.2. Market Segmentation
- 1.3. Research Methodology
- 1.4. Definitions and Assumptions
- 2. Executive Summary
- 2.1. Introduction
- 3. Market Dynamics
- 3.1. Introduction
- 3.2. Market Drivers
- 3.3. Market Restrains
- 3.4. Market Trends
- 4. Market Factor Analysis
- 4.1. Porters Five Forces
- 4.2. Supply/Value Chain
- 4.3. PESTEL analysis
- 4.4. Market Entropy
- 4.5. Patent/Trademark Analysis
- 5. Global E-textile Analysis, Insights and Forecast, 2020-2032
- 5.1. Market Analysis, Insights and Forecast - by Application
- 5.1.1. Military Uses
- 5.1.2. Civil Uses
- 5.1.3. Healthcare Uses
- 5.1.4. Other
- 5.2. Market Analysis, Insights and Forecast - by Types
- 5.2.1. Passive Electronic Textiles
- 5.2.2. Active Electronic Textiles
- 5.2.3. Ultra-Electronic Textiles
- 5.3. Market Analysis, Insights and Forecast - by Region
- 5.3.1. North America
- 5.3.2. South America
- 5.3.3. Europe
- 5.3.4. Middle East & Africa
- 5.3.5. Asia Pacific
- 5.1. Market Analysis, Insights and Forecast - by Application
- 6. North America E-textile Analysis, Insights and Forecast, 2020-2032
- 6.1. Market Analysis, Insights and Forecast - by Application
- 6.1.1. Military Uses
- 6.1.2. Civil Uses
- 6.1.3. Healthcare Uses
- 6.1.4. Other
- 6.2. Market Analysis, Insights and Forecast - by Types
- 6.2.1. Passive Electronic Textiles
- 6.2.2. Active Electronic Textiles
- 6.2.3. Ultra-Electronic Textiles
- 6.1. Market Analysis, Insights and Forecast - by Application
- 7. South America E-textile Analysis, Insights and Forecast, 2020-2032
- 7.1. Market Analysis, Insights and Forecast - by Application
- 7.1.1. Military Uses
- 7.1.2. Civil Uses
- 7.1.3. Healthcare Uses
- 7.1.4. Other
- 7.2. Market Analysis, Insights and Forecast - by Types
- 7.2.1. Passive Electronic Textiles
- 7.2.2. Active Electronic Textiles
- 7.2.3. Ultra-Electronic Textiles
- 7.1. Market Analysis, Insights and Forecast - by Application
- 8. Europe E-textile Analysis, Insights and Forecast, 2020-2032
- 8.1. Market Analysis, Insights and Forecast - by Application
- 8.1.1. Military Uses
- 8.1.2. Civil Uses
- 8.1.3. Healthcare Uses
- 8.1.4. Other
- 8.2. Market Analysis, Insights and Forecast - by Types
- 8.2.1. Passive Electronic Textiles
- 8.2.2. Active Electronic Textiles
- 8.2.3. Ultra-Electronic Textiles
- 8.1. Market Analysis, Insights and Forecast - by Application
- 9. Middle East & Africa E-textile Analysis, Insights and Forecast, 2020-2032
- 9.1. Market Analysis, Insights and Forecast - by Application
- 9.1.1. Military Uses
- 9.1.2. Civil Uses
- 9.1.3. Healthcare Uses
- 9.1.4. Other
- 9.2. Market Analysis, Insights and Forecast - by Types
- 9.2.1. Passive Electronic Textiles
- 9.2.2. Active Electronic Textiles
- 9.2.3. Ultra-Electronic Textiles
- 9.1. Market Analysis, Insights and Forecast - by Application
- 10. Asia Pacific E-textile Analysis, Insights and Forecast, 2020-2032
- 10.1. Market Analysis, Insights and Forecast - by Application
- 10.1.1. Military Uses
- 10.1.2. Civil Uses
- 10.1.3. Healthcare Uses
- 10.1.4. Other
- 10.2. Market Analysis, Insights and Forecast - by Types
- 10.2.1. Passive Electronic Textiles
- 10.2.2. Active Electronic Textiles
- 10.2.3. Ultra-Electronic Textiles
- 10.1. Market Analysis, Insights and Forecast - by Application
- 11. Competitive Analysis
- 11.1. Global Market Share Analysis 2025
- 11.2. Company Profiles
- 11.2.1 Textronics
- 11.2.1.1. Overview
- 11.2.1.2. Products
- 11.2.1.3. SWOT Analysis
- 11.2.1.4. Recent Developments
- 11.2.1.5. Financials (Based on Availability)
- 11.2.2 Milliken
- 11.2.2.1. Overview
- 11.2.2.2. Products
- 11.2.2.3. SWOT Analysis
- 11.2.2.4. Recent Developments
- 11.2.2.5. Financials (Based on Availability)
- 11.2.3 Toray Industries
- 11.2.3.1. Overview
- 11.2.3.2. Products
- 11.2.3.3. SWOT Analysis
- 11.2.3.4. Recent Developments
- 11.2.3.5. Financials (Based on Availability)
- 11.2.4 Peratech
- 11.2.4.1. Overview
- 11.2.4.2. Products
- 11.2.4.3. SWOT Analysis
- 11.2.4.4. Recent Developments
- 11.2.4.5. Financials (Based on Availability)
- 11.2.5 DuPont
- 11.2.5.1. Overview
- 11.2.5.2. Products
- 11.2.5.3. SWOT Analysis
- 11.2.5.4. Recent Developments
- 11.2.5.5. Financials (Based on Availability)
- 11.2.6 Clothing+
- 11.2.6.1. Overview
- 11.2.6.2. Products
- 11.2.6.3. SWOT Analysis
- 11.2.6.4. Recent Developments
- 11.2.6.5. Financials (Based on Availability)
- 11.2.7 Outlast
- 11.2.7.1. Overview
- 11.2.7.2. Products
- 11.2.7.3. SWOT Analysis
- 11.2.7.4. Recent Developments
- 11.2.7.5. Financials (Based on Availability)
- 11.2.8 d3o lab
- 11.2.8.1. Overview
- 11.2.8.2. Products
- 11.2.8.3. SWOT Analysis
- 11.2.8.4. Recent Developments
- 11.2.8.5. Financials (Based on Availability)
- 11.2.9 Schoeller Textiles AG
- 11.2.9.1. Overview
- 11.2.9.2. Products
- 11.2.9.3. SWOT Analysis
- 11.2.9.4. Recent Developments
- 11.2.9.5. Financials (Based on Availability)
- 11.2.10 Texas Instruments
- 11.2.10.1. Overview
- 11.2.10.2. Products
- 11.2.10.3. SWOT Analysis
- 11.2.10.4. Recent Developments
- 11.2.10.5. Financials (Based on Availability)
- 11.2.11 Exo2
- 11.2.11.1. Overview
- 11.2.11.2. Products
- 11.2.11.3. SWOT Analysis
- 11.2.11.4. Recent Developments
- 11.2.11.5. Financials (Based on Availability)
- 11.2.12 Vista Medical Ltd.
- 11.2.12.1. Overview
- 11.2.12.2. Products
- 11.2.12.3. SWOT Analysis
- 11.2.12.4. Recent Developments
- 11.2.12.5. Financials (Based on Availability)
- 11.2.13 Ohmatex ApS
- 11.2.13.1. Overview
- 11.2.13.2. Products
- 11.2.13.3. SWOT Analysis
- 11.2.13.4. Recent Developments
- 11.2.13.5. Financials (Based on Availability)
- 11.2.14 Interactive Wear AG
- 11.2.14.1. Overview
- 11.2.14.2. Products
- 11.2.14.3. SWOT Analysis
- 11.2.14.4. Recent Developments
- 11.2.14.5. Financials (Based on Availability)
- 11.2.1 Textronics
List of Figures
- Figure 1: Global E-textile Revenue Breakdown (undefined, %) by Region 2025 & 2033
- Figure 2: Global E-textile Volume Breakdown (K, %) by Region 2025 & 2033
- Figure 3: North America E-textile Revenue (undefined), by Application 2025 & 2033
- Figure 4: North America E-textile Volume (K), by Application 2025 & 2033
- Figure 5: North America E-textile Revenue Share (%), by Application 2025 & 2033
- Figure 6: North America E-textile Volume Share (%), by Application 2025 & 2033
- Figure 7: North America E-textile Revenue (undefined), by Types 2025 & 2033
- Figure 8: North America E-textile Volume (K), by Types 2025 & 2033
- Figure 9: North America E-textile Revenue Share (%), by Types 2025 & 2033
- Figure 10: North America E-textile Volume Share (%), by Types 2025 & 2033
- Figure 11: North America E-textile Revenue (undefined), by Country 2025 & 2033
- Figure 12: North America E-textile Volume (K), by Country 2025 & 2033
- Figure 13: North America E-textile Revenue Share (%), by Country 2025 & 2033
- Figure 14: North America E-textile Volume Share (%), by Country 2025 & 2033
- Figure 15: South America E-textile Revenue (undefined), by Application 2025 & 2033
- Figure 16: South America E-textile Volume (K), by Application 2025 & 2033
- Figure 17: South America E-textile Revenue Share (%), by Application 2025 & 2033
- Figure 18: South America E-textile Volume Share (%), by Application 2025 & 2033
- Figure 19: South America E-textile Revenue (undefined), by Types 2025 & 2033
- Figure 20: South America E-textile Volume (K), by Types 2025 & 2033
- Figure 21: South America E-textile Revenue Share (%), by Types 2025 & 2033
- Figure 22: South America E-textile Volume Share (%), by Types 2025 & 2033
- Figure 23: South America E-textile Revenue (undefined), by Country 2025 & 2033
- Figure 24: South America E-textile Volume (K), by Country 2025 & 2033
- Figure 25: South America E-textile Revenue Share (%), by Country 2025 & 2033
- Figure 26: South America E-textile Volume Share (%), by Country 2025 & 2033
- Figure 27: Europe E-textile Revenue (undefined), by Application 2025 & 2033
- Figure 28: Europe E-textile Volume (K), by Application 2025 & 2033
- Figure 29: Europe E-textile Revenue Share (%), by Application 2025 & 2033
- Figure 30: Europe E-textile Volume Share (%), by Application 2025 & 2033
- Figure 31: Europe E-textile Revenue (undefined), by Types 2025 & 2033
- Figure 32: Europe E-textile Volume (K), by Types 2025 & 2033
- Figure 33: Europe E-textile Revenue Share (%), by Types 2025 & 2033
- Figure 34: Europe E-textile Volume Share (%), by Types 2025 & 2033
- Figure 35: Europe E-textile Revenue (undefined), by Country 2025 & 2033
- Figure 36: Europe E-textile Volume (K), by Country 2025 & 2033
- Figure 37: Europe E-textile Revenue Share (%), by Country 2025 & 2033
- Figure 38: Europe E-textile Volume Share (%), by Country 2025 & 2033
- Figure 39: Middle East & Africa E-textile Revenue (undefined), by Application 2025 & 2033
- Figure 40: Middle East & Africa E-textile Volume (K), by Application 2025 & 2033
- Figure 41: Middle East & Africa E-textile Revenue Share (%), by Application 2025 & 2033
- Figure 42: Middle East & Africa E-textile Volume Share (%), by Application 2025 & 2033
- Figure 43: Middle East & Africa E-textile Revenue (undefined), by Types 2025 & 2033
- Figure 44: Middle East & Africa E-textile Volume (K), by Types 2025 & 2033
- Figure 45: Middle East & Africa E-textile Revenue Share (%), by Types 2025 & 2033
- Figure 46: Middle East & Africa E-textile Volume Share (%), by Types 2025 & 2033
- Figure 47: Middle East & Africa E-textile Revenue (undefined), by Country 2025 & 2033
- Figure 48: Middle East & Africa E-textile Volume (K), by Country 2025 & 2033
- Figure 49: Middle East & Africa E-textile Revenue Share (%), by Country 2025 & 2033
- Figure 50: Middle East & Africa E-textile Volume Share (%), by Country 2025 & 2033
- Figure 51: Asia Pacific E-textile Revenue (undefined), by Application 2025 & 2033
- Figure 52: Asia Pacific E-textile Volume (K), by Application 2025 & 2033
- Figure 53: Asia Pacific E-textile Revenue Share (%), by Application 2025 & 2033
- Figure 54: Asia Pacific E-textile Volume Share (%), by Application 2025 & 2033
- Figure 55: Asia Pacific E-textile Revenue (undefined), by Types 2025 & 2033
- Figure 56: Asia Pacific E-textile Volume (K), by Types 2025 & 2033
- Figure 57: Asia Pacific E-textile Revenue Share (%), by Types 2025 & 2033
- Figure 58: Asia Pacific E-textile Volume Share (%), by Types 2025 & 2033
- Figure 59: Asia Pacific E-textile Revenue (undefined), by Country 2025 & 2033
- Figure 60: Asia Pacific E-textile Volume (K), by Country 2025 & 2033
- Figure 61: Asia Pacific E-textile Revenue Share (%), by Country 2025 & 2033
- Figure 62: Asia Pacific E-textile Volume Share (%), by Country 2025 & 2033
List of Tables
- Table 1: Global E-textile Revenue undefined Forecast, by Application 2020 & 2033
- Table 2: Global E-textile Volume K Forecast, by Application 2020 & 2033
- Table 3: Global E-textile Revenue undefined Forecast, by Types 2020 & 2033
- Table 4: Global E-textile Volume K Forecast, by Types 2020 & 2033
- Table 5: Global E-textile Revenue undefined Forecast, by Region 2020 & 2033
- Table 6: Global E-textile Volume K Forecast, by Region 2020 & 2033
- Table 7: Global E-textile Revenue undefined Forecast, by Application 2020 & 2033
- Table 8: Global E-textile Volume K Forecast, by Application 2020 & 2033
- Table 9: Global E-textile Revenue undefined Forecast, by Types 2020 & 2033
- Table 10: Global E-textile Volume K Forecast, by Types 2020 & 2033
- Table 11: Global E-textile Revenue undefined Forecast, by Country 2020 & 2033
- Table 12: Global E-textile Volume K Forecast, by Country 2020 & 2033
- Table 13: United States E-textile Revenue (undefined) Forecast, by Application 2020 & 2033
- Table 14: United States E-textile Volume (K) Forecast, by Application 2020 & 2033
- Table 15: Canada E-textile Revenue (undefined) Forecast, by Application 2020 & 2033
- Table 16: Canada E-textile Volume (K) Forecast, by Application 2020 & 2033
- Table 17: Mexico E-textile Revenue (undefined) Forecast, by Application 2020 & 2033
- Table 18: Mexico E-textile Volume (K) Forecast, by Application 2020 & 2033
- Table 19: Global E-textile Revenue undefined Forecast, by Application 2020 & 2033
- Table 20: Global E-textile Volume K Forecast, by Application 2020 & 2033
- Table 21: Global E-textile Revenue undefined Forecast, by Types 2020 & 2033
- Table 22: Global E-textile Volume K Forecast, by Types 2020 & 2033
- Table 23: Global E-textile Revenue undefined Forecast, by Country 2020 & 2033
- Table 24: Global E-textile Volume K Forecast, by Country 2020 & 2033
- Table 25: Brazil E-textile Revenue (undefined) Forecast, by Application 2020 & 2033
- Table 26: Brazil E-textile Volume (K) Forecast, by Application 2020 & 2033
- Table 27: Argentina E-textile Revenue (undefined) Forecast, by Application 2020 & 2033
- Table 28: Argentina E-textile Volume (K) Forecast, by Application 2020 & 2033
- Table 29: Rest of South America E-textile Revenue (undefined) Forecast, by Application 2020 & 2033
- Table 30: Rest of South America E-textile Volume (K) Forecast, by Application 2020 & 2033
- Table 31: Global E-textile Revenue undefined Forecast, by Application 2020 & 2033
- Table 32: Global E-textile Volume K Forecast, by Application 2020 & 2033
- Table 33: Global E-textile Revenue undefined Forecast, by Types 2020 & 2033
- Table 34: Global E-textile Volume K Forecast, by Types 2020 & 2033
- Table 35: Global E-textile Revenue undefined Forecast, by Country 2020 & 2033
- Table 36: Global E-textile Volume K Forecast, by Country 2020 & 2033
- Table 37: United Kingdom E-textile Revenue (undefined) Forecast, by Application 2020 & 2033
- Table 38: United Kingdom E-textile Volume (K) Forecast, by Application 2020 & 2033
- Table 39: Germany E-textile Revenue (undefined) Forecast, by Application 2020 & 2033
- Table 40: Germany E-textile Volume (K) Forecast, by Application 2020 & 2033
- Table 41: France E-textile Revenue (undefined) Forecast, by Application 2020 & 2033
- Table 42: France E-textile Volume (K) Forecast, by Application 2020 & 2033
- Table 43: Italy E-textile Revenue (undefined) Forecast, by Application 2020 & 2033
- Table 44: Italy E-textile Volume (K) Forecast, by Application 2020 & 2033
- Table 45: Spain E-textile Revenue (undefined) Forecast, by Application 2020 & 2033
- Table 46: Spain E-textile Volume (K) Forecast, by Application 2020 & 2033
- Table 47: Russia E-textile Revenue (undefined) Forecast, by Application 2020 & 2033
- Table 48: Russia E-textile Volume (K) Forecast, by Application 2020 & 2033
- Table 49: Benelux E-textile Revenue (undefined) Forecast, by Application 2020 & 2033
- Table 50: Benelux E-textile Volume (K) Forecast, by Application 2020 & 2033
- Table 51: Nordics E-textile Revenue (undefined) Forecast, by Application 2020 & 2033
- Table 52: Nordics E-textile Volume (K) Forecast, by Application 2020 & 2033
- Table 53: Rest of Europe E-textile Revenue (undefined) Forecast, by Application 2020 & 2033
- Table 54: Rest of Europe E-textile Volume (K) Forecast, by Application 2020 & 2033
- Table 55: Global E-textile Revenue undefined Forecast, by Application 2020 & 2033
- Table 56: Global E-textile Volume K Forecast, by Application 2020 & 2033
- Table 57: Global E-textile Revenue undefined Forecast, by Types 2020 & 2033
- Table 58: Global E-textile Volume K Forecast, by Types 2020 & 2033
- Table 59: Global E-textile Revenue undefined Forecast, by Country 2020 & 2033
- Table 60: Global E-textile Volume K Forecast, by Country 2020 & 2033
- Table 61: Turkey E-textile Revenue (undefined) Forecast, by Application 2020 & 2033
- Table 62: Turkey E-textile Volume (K) Forecast, by Application 2020 & 2033
- Table 63: Israel E-textile Revenue (undefined) Forecast, by Application 2020 & 2033
- Table 64: Israel E-textile Volume (K) Forecast, by Application 2020 & 2033
- Table 65: GCC E-textile Revenue (undefined) Forecast, by Application 2020 & 2033
- Table 66: GCC E-textile Volume (K) Forecast, by Application 2020 & 2033
- Table 67: North Africa E-textile Revenue (undefined) Forecast, by Application 2020 & 2033
- Table 68: North Africa E-textile Volume (K) Forecast, by Application 2020 & 2033
- Table 69: South Africa E-textile Revenue (undefined) Forecast, by Application 2020 & 2033
- Table 70: South Africa E-textile Volume (K) Forecast, by Application 2020 & 2033
- Table 71: Rest of Middle East & Africa E-textile Revenue (undefined) Forecast, by Application 2020 & 2033
- Table 72: Rest of Middle East & Africa E-textile Volume (K) Forecast, by Application 2020 & 2033
- Table 73: Global E-textile Revenue undefined Forecast, by Application 2020 & 2033
- Table 74: Global E-textile Volume K Forecast, by Application 2020 & 2033
- Table 75: Global E-textile Revenue undefined Forecast, by Types 2020 & 2033
- Table 76: Global E-textile Volume K Forecast, by Types 2020 & 2033
- Table 77: Global E-textile Revenue undefined Forecast, by Country 2020 & 2033
- Table 78: Global E-textile Volume K Forecast, by Country 2020 & 2033
- Table 79: China E-textile Revenue (undefined) Forecast, by Application 2020 & 2033
- Table 80: China E-textile Volume (K) Forecast, by Application 2020 & 2033
- Table 81: India E-textile Revenue (undefined) Forecast, by Application 2020 & 2033
- Table 82: India E-textile Volume (K) Forecast, by Application 2020 & 2033
- Table 83: Japan E-textile Revenue (undefined) Forecast, by Application 2020 & 2033
- Table 84: Japan E-textile Volume (K) Forecast, by Application 2020 & 2033
- Table 85: South Korea E-textile Revenue (undefined) Forecast, by Application 2020 & 2033
- Table 86: South Korea E-textile Volume (K) Forecast, by Application 2020 & 2033
- Table 87: ASEAN E-textile Revenue (undefined) Forecast, by Application 2020 & 2033
- Table 88: ASEAN E-textile Volume (K) Forecast, by Application 2020 & 2033
- Table 89: Oceania E-textile Revenue (undefined) Forecast, by Application 2020 & 2033
- Table 90: Oceania E-textile Volume (K) Forecast, by Application 2020 & 2033
- Table 91: Rest of Asia Pacific E-textile Revenue (undefined) Forecast, by Application 2020 & 2033
- Table 92: Rest of Asia Pacific E-textile Volume (K) Forecast, by Application 2020 & 2033
Frequently Asked Questions
1. What is the projected Compound Annual Growth Rate (CAGR) of the E-textile?
The projected CAGR is approximately 12.7%.
2. Which companies are prominent players in the E-textile?
Key companies in the market include Textronics, Milliken, Toray Industries, Peratech, DuPont, Clothing+, Outlast, d3o lab, Schoeller Textiles AG, Texas Instruments, Exo2, Vista Medical Ltd., Ohmatex ApS, Interactive Wear AG.
3. What are the main segments of the E-textile?
The market segments include Application, Types.
4. Can you provide details about the market size?
The market size is estimated to be USD XXX N/A as of 2022.
5. What are some drivers contributing to market growth?
N/A
6. What are the notable trends driving market growth?
N/A
7. Are there any restraints impacting market growth?
N/A
8. Can you provide examples of recent developments in the market?
N/A
9. What pricing options are available for accessing the report?
Pricing options include single-user, multi-user, and enterprise licenses priced at USD 3350.00, USD 5025.00, and USD 6700.00 respectively.
10. Is the market size provided in terms of value or volume?
The market size is provided in terms of value, measured in N/A and volume, measured in K.
11. Are there any specific market keywords associated with the report?
Yes, the market keyword associated with the report is "E-textile," which aids in identifying and referencing the specific market segment covered.
12. How do I determine which pricing option suits my needs best?
The pricing options vary based on user requirements and access needs. Individual users may opt for single-user licenses, while businesses requiring broader access may choose multi-user or enterprise licenses for cost-effective access to the report.
13. Are there any additional resources or data provided in the E-textile report?
While the report offers comprehensive insights, it's advisable to review the specific contents or supplementary materials provided to ascertain if additional resources or data are available.
14. How can I stay updated on further developments or reports in the E-textile?
To stay informed about further developments, trends, and reports in the E-textile, consider subscribing to industry newsletters, following relevant companies and organizations, or regularly checking reputable industry news sources and publications.
Methodology
Step 1 - Identification of Relevant Samples Size from Population Database


Step 2 - Approaches for Defining Global Market Size (Value, Volume* & Price*)

Note*: In applicable scenarios
Step 3 - Data Sources
Primary Research
- Web Analytics
- Survey Reports
- Research Institute
- Latest Research Reports
- Opinion Leaders
Secondary Research
- Annual Reports
- White Paper
- Latest Press Release
- Industry Association
- Paid Database
- Investor Presentations

Step 4 - Data Triangulation
Involves using different sources of information in order to increase the validity of a study
These sources are likely to be stakeholders in a program - participants, other researchers, program staff, other community members, and so on.
Then we put all data in single framework & apply various statistical tools to find out the dynamic on the market.
During the analysis stage, feedback from the stakeholder groups would be compared to determine areas of agreement as well as areas of divergence