

Key Insights
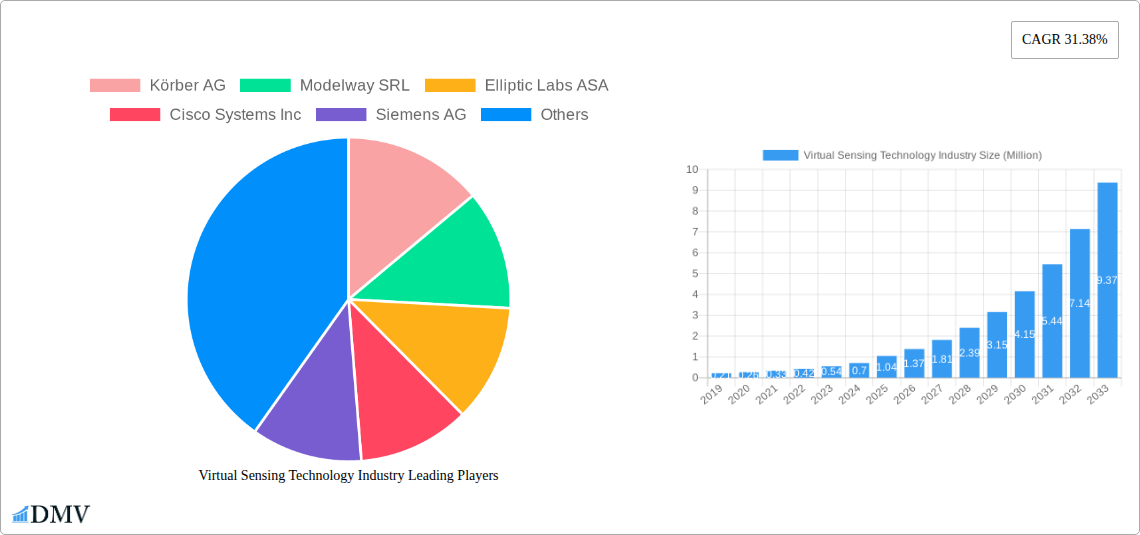
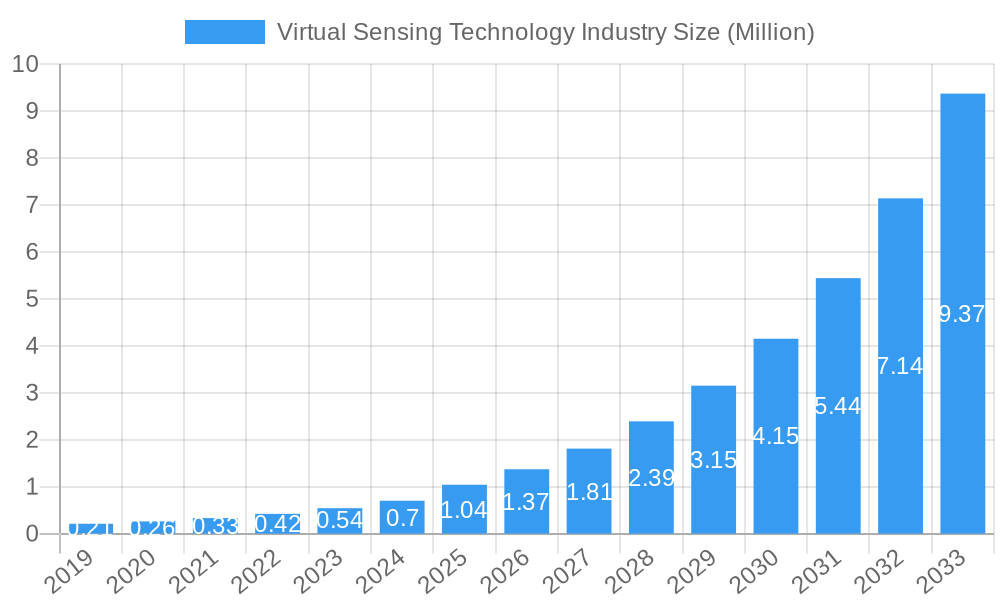
The Virtual Sensing Technology Industry is poised for remarkable expansion, projected to reach a substantial 1.04 Million value unit by 2025, with an impressive Compound Annual Growth Rate (CAGR) of 31.38% expected through 2033. This dynamic growth is fueled by a confluence of significant drivers, including the escalating need for predictive maintenance across industries to minimize downtime and optimize operational efficiency, the burgeoning demand for enhanced safety and compliance measures, and the relentless advancement in AI and IoT technologies that underpin virtual sensing capabilities. Furthermore, the industry is witnessing a transformative trend towards greater automation and the integration of digital twins, enabling sophisticated real-time monitoring and control. The widespread adoption of cloud-based deployment models is significantly lowering barriers to entry, making advanced virtual sensing solutions more accessible.
Virtual Sensing Technology Industry Market Size (In Million)
Despite its robust growth trajectory, the market encounters certain restraints, primarily the initial implementation costs and the challenges associated with data security and privacy concerns. However, these are being effectively addressed through ongoing innovations in cybersecurity and the development of more cost-effective solutions. The market segmentation reveals a strong presence in sectors such as Oil and Gas, Manufacturing, and Transportation and Automotive, with significant potential in Aerospace and Defense and Electronics. Companies are strategically focusing on delivering enhanced value propositions through improved accuracy, real-time insights, and reduced operational expenditures. Distribution channels are increasingly leaning towards direct sales and strategic partnerships to ensure effective market penetration and customer support. The competitive landscape is characterized by key players like Siemens AG, General Electric Company, and Schneider Electric SE, actively investing in R&D to maintain a competitive edge. Addressing market challenges involves robust data management strategies and a focus on interoperability between different systems.
Virtual Sensing Technology Industry Company Market Share
This comprehensive report delves into the dynamic Virtual Sensing Technology Industry, offering an in-depth analysis of market trends, growth drivers, competitive strategies, and future opportunities. With a study period spanning from 2019 to 2033, a base year of 2025, and a forecast period from 2025 to 2033, this report equips stakeholders with critical data and actionable insights to navigate this rapidly evolving landscape. We explore the transformative impact of virtual sensing across diverse end-user industries, from Manufacturing and Oil & Gas to Transportation & Automotive and Aerospace & Defense, highlighting the increasing demand for predictive maintenance, enhanced operational efficiency, and real-time data analytics.
The Virtual Sensing Technology market is experiencing robust growth driven by the proliferation of IoT devices, advancements in AI and machine learning, and the growing need for cost-effective, non-intrusive monitoring solutions. This report examines key market segments, including Cloud and On-premise deployments, and provides detailed insights into the value proposition, distribution channel strategies, and competitive landscape shaping the industry.
Virtual Sensing Technology Industry Market Composition & Trends
The Virtual Sensing Technology Industry exhibits a moderately concentrated market, with key players investing heavily in research and development to drive innovation. The market is characterized by a growing adoption of AI-driven virtual sensors that replicate the functionality of physical sensors, offering cost savings and enhanced flexibility. Regulatory landscapes are evolving to accommodate these novel technologies, particularly in safety-critical sectors. Substitute products, primarily traditional physical sensors, are facing increasing pressure from the superior performance and adaptability of virtual sensing solutions. End-user profiles are diverse, with a strong emphasis on industries demanding real-time data for process optimization and predictive capabilities. Mergers and acquisitions (M&A) are active, with deal values in the range of several hundred million dollars, indicating a consolidation trend and strategic partnerships aimed at expanding market reach and technological portfolios.
- Market Concentration: Moderate, with strategic collaborations and acquisitions shaping market share distribution.
- Innovation Catalysts: AI/ML advancements, IoT proliferation, demand for predictive maintenance.
- Regulatory Landscapes: Evolving, with a focus on data security and operational integrity.
- Substitute Products: Traditional physical sensors are increasingly being augmented or replaced by virtual sensing.
- End-User Profiles: Manufacturing, Oil & Gas, Transportation, Aerospace & Defense, Electronics.
- M&A Activities: Active, with significant deal values in the hundreds of millions.
Virtual Sensing Technology Industry Industry Evolution
The Virtual Sensing Technology Industry has witnessed a significant evolutionary trajectory, marked by consistent market growth and rapid technological advancements. Over the historical period (2019-2024), the market has transitioned from nascent experimental phases to widespread industrial application. Growth rates have been impressive, with compound annual growth rates (CAGRs) projected to remain robust throughout the forecast period (2025-2033). This expansion is primarily fueled by the increasing need for data-driven decision-making across various sectors. Early adopters in manufacturing and automation have paved the way for broader acceptance, leading to enhanced operational efficiencies and reduced maintenance costs. The adoption metrics for virtual sensing solutions are steadily rising as industries recognize their potential to overcome the limitations of physical sensors, such as installation complexity, calibration requirements, and susceptibility to environmental factors. The demand for real-time, predictive insights has become a critical differentiator, pushing companies to invest in sophisticated virtual sensing platforms. The industry's evolution is also characterized by a shift towards more intelligent and context-aware virtual sensors, capable of learning and adapting to changing operational conditions. This continuous improvement in performance and application scope underpins the strong market growth observed and anticipated.
Leading Regions, Countries, or Segments in Virtual Sensing Technology Industry
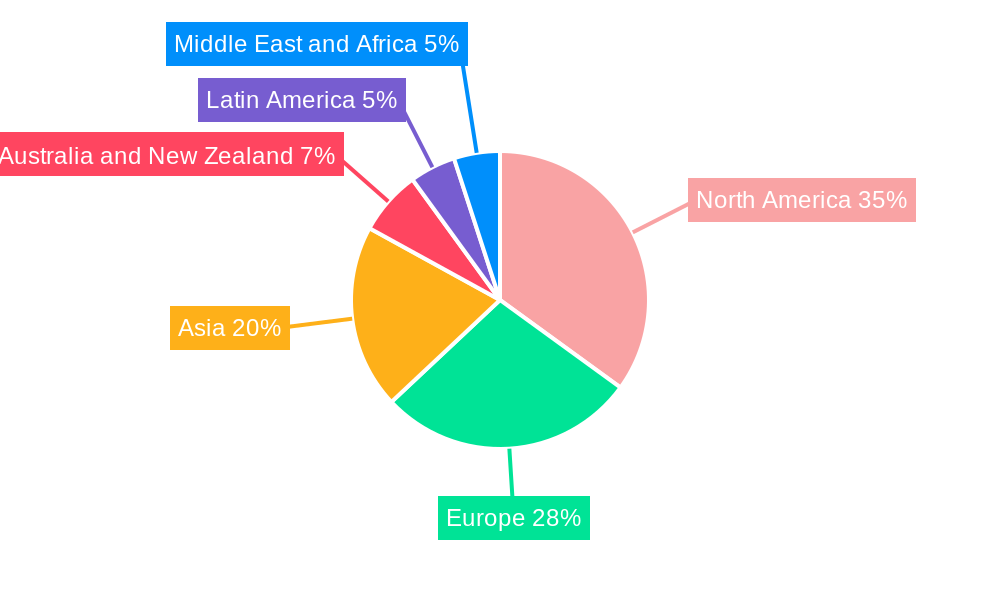
North America and Europe currently lead the Virtual Sensing Technology Industry, driven by substantial investments in Industry 4.0 initiatives and a strong presence of key end-user industries like manufacturing and aerospace. The United States, in particular, stands out due to its advanced technological infrastructure and a high concentration of companies actively developing and deploying virtual sensing solutions. The Manufacturing sector is a dominant end-user industry, leveraging virtual sensing for predictive maintenance, quality control, and process optimization, contributing significantly to market growth. Furthermore, the Cloud deployment type is experiencing accelerated adoption, offering scalability, accessibility, and cost-effectiveness for virtual sensing solutions.
- Dominant Region: North America & Europe.
- Leading Countries: United States, Germany, United Kingdom.
- Dominant End-User Industry: Manufacturing.
- Key Drivers:
- High adoption of industrial automation and IoT.
- Government initiatives promoting digital transformation.
- Demand for predictive maintenance and operational efficiency.
- Presence of major technology providers and end-users.
- Key Drivers:
- Dominant Deployment Type: Cloud.
- Key Drivers:
- Scalability and flexibility for diverse applications.
- Reduced upfront infrastructure costs.
- Enhanced data accessibility and collaboration.
- Integration with existing cloud-based platforms.
- Key Drivers:
Virtual Sensing Technology Industry Product Innovations
Product innovations in the Virtual Sensing Technology Industry are centered on developing highly accurate, AI-powered virtual sensors that mimic physical counterparts. These innovations focus on creating virtual proximity sensors, virtual temperature sensors, and virtual pressure sensors, among others, that can be deployed entirely in software. For instance, Elliptic Labs' INNER BEAUTY AI Virtual Proximity Sensor demonstrates remarkable performance by leveraging ultrasonic and AI technologies, reducing the need for hardware components and enhancing device aesthetics and functionality. Such advancements offer unique selling propositions like reduced bill of materials (BOM), improved power efficiency, and novel interaction possibilities in consumer electronics and industrial applications.
Propelling Factors for Virtual Sensing Technology Industry Growth
The growth of the Virtual Sensing Technology Industry is propelled by several critical factors. The exponential increase in IoT devices generates vast amounts of data, creating a demand for sophisticated analytical tools like virtual sensors to interpret and utilize this information effectively. Advancements in Artificial Intelligence (AI) and Machine Learning (ML) are foundational, enabling the creation of increasingly accurate and robust virtual sensing models. Economic factors, such as the need for cost reduction in manufacturing and operations through predictive maintenance and reduced hardware dependency, are significant drivers. Furthermore, supportive regulatory environments in certain regions, encouraging the adoption of digital technologies for industrial modernization, contribute to market expansion. The pursuit of enhanced operational efficiency, improved safety, and novel product functionalities across industries like Transportation and Automotive, and Aerospace and Defense further fuels demand.
Obstacles in the Virtual Sensing Technology Industry Market
Despite its promising growth, the Virtual Sensing Technology Industry faces several obstacles. Regulatory challenges related to data privacy, security, and the certification of virtual sensing systems in critical applications can slow down adoption. Supply chain disruptions, while less impactful than for physical hardware, can affect the availability of processing power and specialized software components. Competitive pressures from established physical sensor manufacturers and the need for significant upfront investment in AI/ML development can also be barriers. Furthermore, a lack of standardization and the complexity of integration with existing legacy systems in certain industries require significant technical expertise, hindering widespread implementation.
Future Opportunities in Virtual Sensing Technology Industry
The Virtual Sensing Technology Industry is poised for substantial future opportunities. The expanding Internet of Things (IoT) ecosystem, with billions of connected devices, presents a vast market for virtual sensing solutions to extract meaningful insights. Emerging technologies such as 5G connectivity will enable real-time data transmission and processing, enhancing the capabilities of virtual sensors in time-sensitive applications. The growing demand for digital twins across industries offers a prime area for virtual sensing integration, providing dynamic, data-driven models of physical assets. Furthermore, the exploration of new application areas in healthcare, smart cities, and agriculture, coupled with advancements in AI and edge computing, will unlock new market segments and revenue streams for virtual sensing technology providers.
Major Players in the Virtual Sensing Technology Industry Ecosystem
- Körber AG
- Modelway SRL
- Elliptic Labs ASA
- Cisco Systems Inc
- Siemens AG
- Schneider Electric SE
- Andata Lt
- Intelli Dynamics (Biocomp Systems Inc )
- General Electric Company
Key Developments in Virtual Sensing Technology Industry Industry
- March 2024: Elliptic Labs announced the deployment of over 500 million devices, shipping its AI Virtual Proximity Sensor INNER BEAUTY on the Lava Blaze Curve smartphone. Lava International, a new smartphone customer, partnered with Elliptic Labs' collaborator MediaTek, selecting their Dimensity 7050 chipset for the Blaze Curve smartphone, following Elliptic Labs' prior contract announcement for this launch.
- February 2024: Capgemini and Unity expanded their strategic alliance. Capgemini integrated Unity's Digital Twin Professional Services arm, forming one of the largest global pools of Unity enterprise developers. This strategic move aims to accelerate the development and deployment of real-time 3D visualization software for industrial digital twin applications.
Strategic Virtual Sensing Technology Industry Market Forecast
The strategic Virtual Sensing Technology Industry market forecast is exceptionally optimistic, driven by the fundamental shift towards data-centric operations and the inherent advantages of software-defined sensing. The continuous advancements in AI and edge computing, coupled with the pervasive growth of IoT, will create a fertile ground for virtual sensors to replace or augment traditional hardware. Sectors like Manufacturing, Transportation & Automotive, and Aerospace & Defense will continue to be primary beneficiaries, demanding greater efficiency, predictive capabilities, and cost optimization. The expansion of cloud-based virtual sensing platforms will democratize access to advanced monitoring and analytics, further accelerating market penetration. Emerging applications in new verticals and the increasing sophistication of virtual sensing algorithms promise sustained high growth and significant market potential in the coming years.
Virtual Sensing Technology Industry Segmentation
-
1. Deployment Type
- 1.1. Cloud
- 1.2. On-premise
-
2. End-user Industry
- 2.1. Oil and Gas
- 2.2. Manufacturing
- 2.3. Transportation and Automotive
- 2.4. Metal and Mining
- 2.5. Aerospace and Defense
- 2.6. Electronics and Consumer Technologies
- 2.7. Other End User Industries
- 3. Market Segmentation and Target Audience
- 4. Value Proposition
- 5. Distribution Channel Strategies
- 6. Competitive Landscape
- 7. Addressing Market Challenges
- 8. Conclusion and Recommendations
Virtual Sensing Technology Industry Segmentation By Geography
-
1. North America
- 1.1. United States
- 1.2. Canada
-
2. Europe
- 2.1. United Kingdom
- 2.2. Germany
- 2.3. France
- 2.4. Italy
-
3. Asia
- 3.1. China
- 3.2. Japan
- 3.3. India
- 4. Australia and New Zealand
- 5. Latin America
- 6. Middle East and Africa
Virtual Sensing Technology Industry Regional Market Share
Geographic Coverage of Virtual Sensing Technology Industry
Virtual Sensing Technology Industry REPORT HIGHLIGHTS
| Aspects | Details |
|---|---|
| Study Period | 2020-2034 |
| Base Year | 2025 |
| Estimated Year | 2026 |
| Forecast Period | 2026-2034 |
| Historical Period | 2020-2025 |
| Growth Rate | CAGR of 31.38% from 2020-2034 |
| Segmentation |
|
Table of Contents
- 1. Introduction
- 1.1. Research Scope
- 1.2. Market Segmentation
- 1.3. Research Objective
- 1.4. Definitions and Assumptions
- 2. Executive Summary
- 2.1. Market Snapshot
- 3. Market Dynamics
- 3.1. Market Drivers
- 3.2. Market Restrains
- 3.3. Market Trends
- 3.4. Market Opportunities
- 4. Market Factor Analysis
- 4.1. Porters Five Forces
- 4.1.1. Bargaining Power of Suppliers
- 4.1.2. Bargaining Power of Buyers
- 4.1.3. Threat of New Entrants
- 4.1.4. Threat of Substitutes
- 4.1.5. Competitive Rivalry
- 4.2. PESTEL analysis
- 4.3. BCG Analysis
- 4.3.1. Stars (High Growth, High Market Share)
- 4.3.2. Cash Cows (Low Growth, High Market Share)
- 4.3.3. Question Mark (High Growth, Low Market Share)
- 4.3.4. Dogs (Low Growth, Low Market Share)
- 4.4. Ansoff Matrix Analysis
- 4.5. Supply Chain Analysis
- 4.6. Regulatory Landscape
- 4.7. Current Market Potential and Opportunity Assessment (TAM–SAM–SOM Framework)
- 4.8. DMV Analyst Note
- 4.1. Porters Five Forces
- 5. Market Analysis, Insights and Forecast 2021-2033
- 5.1. Market Analysis, Insights and Forecast - by Deployment Type
- 5.1.1. Cloud
- 5.1.2. On-premise
- 5.2. Market Analysis, Insights and Forecast - by End-user Industry
- 5.2.1. Oil and Gas
- 5.2.2. Manufacturing
- 5.2.3. Transportation and Automotive
- 5.2.4. Metal and Mining
- 5.2.5. Aerospace and Defense
- 5.2.6. Electronics and Consumer Technologies
- 5.2.7. Other End User Industries
- 5.3. Market Analysis, Insights and Forecast - by Market Segmentation and Target Audience
- 5.4. Market Analysis, Insights and Forecast - by Value Proposition
- 5.5. Market Analysis, Insights and Forecast - by Distribution Channel Strategies
- 5.6. Market Analysis, Insights and Forecast - by Competitive Landscape
- 5.7. Market Analysis, Insights and Forecast - by Addressing Market Challenges
- 5.8. Market Analysis, Insights and Forecast - by Conclusion and Recommendations
- 5.9. Market Analysis, Insights and Forecast - by Region
- 5.9.1. North America
- 5.9.2. Europe
- 5.9.3. Asia
- 5.9.4. Australia and New Zealand
- 5.9.5. Latin America
- 5.9.6. Middle East and Africa
- 5.1. Market Analysis, Insights and Forecast - by Deployment Type
- 6. Global Virtual Sensing Technology Industry Analysis, Insights and Forecast, 2021-2033
- 6.1. Market Analysis, Insights and Forecast - by Deployment Type
- 6.1.1. Cloud
- 6.1.2. On-premise
- 6.2. Market Analysis, Insights and Forecast - by End-user Industry
- 6.2.1. Oil and Gas
- 6.2.2. Manufacturing
- 6.2.3. Transportation and Automotive
- 6.2.4. Metal and Mining
- 6.2.5. Aerospace and Defense
- 6.2.6. Electronics and Consumer Technologies
- 6.2.7. Other End User Industries
- 6.3. Market Analysis, Insights and Forecast - by Market Segmentation and Target Audience
- 6.4. Market Analysis, Insights and Forecast - by Value Proposition
- 6.5. Market Analysis, Insights and Forecast - by Distribution Channel Strategies
- 6.6. Market Analysis, Insights and Forecast - by Competitive Landscape
- 6.7. Market Analysis, Insights and Forecast - by Addressing Market Challenges
- 6.8. Market Analysis, Insights and Forecast - by Conclusion and Recommendations
- 6.1. Market Analysis, Insights and Forecast - by Deployment Type
- 7. North America Virtual Sensing Technology Industry Analysis, Insights and Forecast, 2020-2032
- 7.1. Market Analysis, Insights and Forecast - by Deployment Type
- 7.1.1. Cloud
- 7.1.2. On-premise
- 7.2. Market Analysis, Insights and Forecast - by End-user Industry
- 7.2.1. Oil and Gas
- 7.2.2. Manufacturing
- 7.2.3. Transportation and Automotive
- 7.2.4. Metal and Mining
- 7.2.5. Aerospace and Defense
- 7.2.6. Electronics and Consumer Technologies
- 7.2.7. Other End User Industries
- 7.3. Market Analysis, Insights and Forecast - by Market Segmentation and Target Audience
- 7.4. Market Analysis, Insights and Forecast - by Value Proposition
- 7.5. Market Analysis, Insights and Forecast - by Distribution Channel Strategies
- 7.6. Market Analysis, Insights and Forecast - by Competitive Landscape
- 7.7. Market Analysis, Insights and Forecast - by Addressing Market Challenges
- 7.8. Market Analysis, Insights and Forecast - by Conclusion and Recommendations
- 7.1. Market Analysis, Insights and Forecast - by Deployment Type
- 8. Europe Virtual Sensing Technology Industry Analysis, Insights and Forecast, 2020-2032
- 8.1. Market Analysis, Insights and Forecast - by Deployment Type
- 8.1.1. Cloud
- 8.1.2. On-premise
- 8.2. Market Analysis, Insights and Forecast - by End-user Industry
- 8.2.1. Oil and Gas
- 8.2.2. Manufacturing
- 8.2.3. Transportation and Automotive
- 8.2.4. Metal and Mining
- 8.2.5. Aerospace and Defense
- 8.2.6. Electronics and Consumer Technologies
- 8.2.7. Other End User Industries
- 8.3. Market Analysis, Insights and Forecast - by Market Segmentation and Target Audience
- 8.4. Market Analysis, Insights and Forecast - by Value Proposition
- 8.5. Market Analysis, Insights and Forecast - by Distribution Channel Strategies
- 8.6. Market Analysis, Insights and Forecast - by Competitive Landscape
- 8.7. Market Analysis, Insights and Forecast - by Addressing Market Challenges
- 8.8. Market Analysis, Insights and Forecast - by Conclusion and Recommendations
- 8.1. Market Analysis, Insights and Forecast - by Deployment Type
- 9. Asia Virtual Sensing Technology Industry Analysis, Insights and Forecast, 2020-2032
- 9.1. Market Analysis, Insights and Forecast - by Deployment Type
- 9.1.1. Cloud
- 9.1.2. On-premise
- 9.2. Market Analysis, Insights and Forecast - by End-user Industry
- 9.2.1. Oil and Gas
- 9.2.2. Manufacturing
- 9.2.3. Transportation and Automotive
- 9.2.4. Metal and Mining
- 9.2.5. Aerospace and Defense
- 9.2.6. Electronics and Consumer Technologies
- 9.2.7. Other End User Industries
- 9.3. Market Analysis, Insights and Forecast - by Market Segmentation and Target Audience
- 9.4. Market Analysis, Insights and Forecast - by Value Proposition
- 9.5. Market Analysis, Insights and Forecast - by Distribution Channel Strategies
- 9.6. Market Analysis, Insights and Forecast - by Competitive Landscape
- 9.7. Market Analysis, Insights and Forecast - by Addressing Market Challenges
- 9.8. Market Analysis, Insights and Forecast - by Conclusion and Recommendations
- 9.1. Market Analysis, Insights and Forecast - by Deployment Type
- 10. Australia and New Zealand Virtual Sensing Technology Industry Analysis, Insights and Forecast, 2020-2032
- 10.1. Market Analysis, Insights and Forecast - by Deployment Type
- 10.1.1. Cloud
- 10.1.2. On-premise
- 10.2. Market Analysis, Insights and Forecast - by End-user Industry
- 10.2.1. Oil and Gas
- 10.2.2. Manufacturing
- 10.2.3. Transportation and Automotive
- 10.2.4. Metal and Mining
- 10.2.5. Aerospace and Defense
- 10.2.6. Electronics and Consumer Technologies
- 10.2.7. Other End User Industries
- 10.3. Market Analysis, Insights and Forecast - by Market Segmentation and Target Audience
- 10.4. Market Analysis, Insights and Forecast - by Value Proposition
- 10.5. Market Analysis, Insights and Forecast - by Distribution Channel Strategies
- 10.6. Market Analysis, Insights and Forecast - by Competitive Landscape
- 10.7. Market Analysis, Insights and Forecast - by Addressing Market Challenges
- 10.8. Market Analysis, Insights and Forecast - by Conclusion and Recommendations
- 10.1. Market Analysis, Insights and Forecast - by Deployment Type
- 11. Latin America Virtual Sensing Technology Industry Analysis, Insights and Forecast, 2020-2032
- 11.1. Market Analysis, Insights and Forecast - by Deployment Type
- 11.1.1. Cloud
- 11.1.2. On-premise
- 11.2. Market Analysis, Insights and Forecast - by End-user Industry
- 11.2.1. Oil and Gas
- 11.2.2. Manufacturing
- 11.2.3. Transportation and Automotive
- 11.2.4. Metal and Mining
- 11.2.5. Aerospace and Defense
- 11.2.6. Electronics and Consumer Technologies
- 11.2.7. Other End User Industries
- 11.3. Market Analysis, Insights and Forecast - by Market Segmentation and Target Audience
- 11.4. Market Analysis, Insights and Forecast - by Value Proposition
- 11.5. Market Analysis, Insights and Forecast - by Distribution Channel Strategies
- 11.6. Market Analysis, Insights and Forecast - by Competitive Landscape
- 11.7. Market Analysis, Insights and Forecast - by Addressing Market Challenges
- 11.8. Market Analysis, Insights and Forecast - by Conclusion and Recommendations
- 11.1. Market Analysis, Insights and Forecast - by Deployment Type
- 12. Middle East and Africa Virtual Sensing Technology Industry Analysis, Insights and Forecast, 2020-2032
- 12.1. Market Analysis, Insights and Forecast - by Deployment Type
- 12.1.1. Cloud
- 12.1.2. On-premise
- 12.2. Market Analysis, Insights and Forecast - by End-user Industry
- 12.2.1. Oil and Gas
- 12.2.2. Manufacturing
- 12.2.3. Transportation and Automotive
- 12.2.4. Metal and Mining
- 12.2.5. Aerospace and Defense
- 12.2.6. Electronics and Consumer Technologies
- 12.2.7. Other End User Industries
- 12.3. Market Analysis, Insights and Forecast - by Market Segmentation and Target Audience
- 12.4. Market Analysis, Insights and Forecast - by Value Proposition
- 12.5. Market Analysis, Insights and Forecast - by Distribution Channel Strategies
- 12.6. Market Analysis, Insights and Forecast - by Competitive Landscape
- 12.7. Market Analysis, Insights and Forecast - by Addressing Market Challenges
- 12.8. Market Analysis, Insights and Forecast - by Conclusion and Recommendations
- 12.1. Market Analysis, Insights and Forecast - by Deployment Type
- 13. Competitive Analysis
- 13.1. Company Profiles
- 13.1.1 Körber AG
- 13.1.1.1. Company Overview
- 13.1.1.2. Products
- 13.1.1.3. Company Financials
- 13.1.1.4. SWOT Analysis
- 13.1.2 Modelway SRL
- 13.1.2.1. Company Overview
- 13.1.2.2. Products
- 13.1.2.3. Company Financials
- 13.1.2.4. SWOT Analysis
- 13.1.3 Elliptic Labs ASA
- 13.1.3.1. Company Overview
- 13.1.3.2. Products
- 13.1.3.3. Company Financials
- 13.1.3.4. SWOT Analysis
- 13.1.4 Cisco Systems Inc
- 13.1.4.1. Company Overview
- 13.1.4.2. Products
- 13.1.4.3. Company Financials
- 13.1.4.4. SWOT Analysis
- 13.1.5 Siemens AG
- 13.1.5.1. Company Overview
- 13.1.5.2. Products
- 13.1.5.3. Company Financials
- 13.1.5.4. SWOT Analysis
- 13.1.6 Schneider Electric SE
- 13.1.6.1. Company Overview
- 13.1.6.2. Products
- 13.1.6.3. Company Financials
- 13.1.6.4. SWOT Analysis
- 13.1.7 Andata Lt
- 13.1.7.1. Company Overview
- 13.1.7.2. Products
- 13.1.7.3. Company Financials
- 13.1.7.4. SWOT Analysis
- 13.1.8 Intelli Dynamics (Biocomp Systems Inc )
- 13.1.8.1. Company Overview
- 13.1.8.2. Products
- 13.1.8.3. Company Financials
- 13.1.8.4. SWOT Analysis
- 13.1.9 General Electric Company
- 13.1.9.1. Company Overview
- 13.1.9.2. Products
- 13.1.9.3. Company Financials
- 13.1.9.4. SWOT Analysis
- 13.1.1 Körber AG
- 13.2. Market Entropy
- 13.2.1 Company's Key Areas Served
- 13.2.2 Recent Developments
- 13.3. Company Market Share Analysis 2025
- 13.3.1 Top 5 Companies Market Share Analysis
- 13.3.2 Top 3 Companies Market Share Analysis
- 13.4. List of Potential Customers
- 14. Research Methodology
List of Figures
- Figure 1: Global Virtual Sensing Technology Industry Revenue Breakdown (Million, %) by Region 2025 & 2033
- Figure 2: North America Virtual Sensing Technology Industry Revenue (Million), by Deployment Type 2025 & 2033
- Figure 3: North America Virtual Sensing Technology Industry Revenue Share (%), by Deployment Type 2025 & 2033
- Figure 4: North America Virtual Sensing Technology Industry Revenue (Million), by End-user Industry 2025 & 2033
- Figure 5: North America Virtual Sensing Technology Industry Revenue Share (%), by End-user Industry 2025 & 2033
- Figure 6: North America Virtual Sensing Technology Industry Revenue (Million), by Market Segmentation and Target Audience 2025 & 2033
- Figure 7: North America Virtual Sensing Technology Industry Revenue Share (%), by Market Segmentation and Target Audience 2025 & 2033
- Figure 8: North America Virtual Sensing Technology Industry Revenue (Million), by Value Proposition 2025 & 2033
- Figure 9: North America Virtual Sensing Technology Industry Revenue Share (%), by Value Proposition 2025 & 2033
- Figure 10: North America Virtual Sensing Technology Industry Revenue (Million), by Distribution Channel Strategies 2025 & 2033
- Figure 11: North America Virtual Sensing Technology Industry Revenue Share (%), by Distribution Channel Strategies 2025 & 2033
- Figure 12: North America Virtual Sensing Technology Industry Revenue (Million), by Competitive Landscape 2025 & 2033
- Figure 13: North America Virtual Sensing Technology Industry Revenue Share (%), by Competitive Landscape 2025 & 2033
- Figure 14: North America Virtual Sensing Technology Industry Revenue (Million), by Addressing Market Challenges 2025 & 2033
- Figure 15: North America Virtual Sensing Technology Industry Revenue Share (%), by Addressing Market Challenges 2025 & 2033
- Figure 16: North America Virtual Sensing Technology Industry Revenue (Million), by Conclusion and Recommendations 2025 & 2033
- Figure 17: North America Virtual Sensing Technology Industry Revenue Share (%), by Conclusion and Recommendations 2025 & 2033
- Figure 18: North America Virtual Sensing Technology Industry Revenue (Million), by Country 2025 & 2033
- Figure 19: North America Virtual Sensing Technology Industry Revenue Share (%), by Country 2025 & 2033
- Figure 20: Europe Virtual Sensing Technology Industry Revenue (Million), by Deployment Type 2025 & 2033
- Figure 21: Europe Virtual Sensing Technology Industry Revenue Share (%), by Deployment Type 2025 & 2033
- Figure 22: Europe Virtual Sensing Technology Industry Revenue (Million), by End-user Industry 2025 & 2033
- Figure 23: Europe Virtual Sensing Technology Industry Revenue Share (%), by End-user Industry 2025 & 2033
- Figure 24: Europe Virtual Sensing Technology Industry Revenue (Million), by Market Segmentation and Target Audience 2025 & 2033
- Figure 25: Europe Virtual Sensing Technology Industry Revenue Share (%), by Market Segmentation and Target Audience 2025 & 2033
- Figure 26: Europe Virtual Sensing Technology Industry Revenue (Million), by Value Proposition 2025 & 2033
- Figure 27: Europe Virtual Sensing Technology Industry Revenue Share (%), by Value Proposition 2025 & 2033
- Figure 28: Europe Virtual Sensing Technology Industry Revenue (Million), by Distribution Channel Strategies 2025 & 2033
- Figure 29: Europe Virtual Sensing Technology Industry Revenue Share (%), by Distribution Channel Strategies 2025 & 2033
- Figure 30: Europe Virtual Sensing Technology Industry Revenue (Million), by Competitive Landscape 2025 & 2033
- Figure 31: Europe Virtual Sensing Technology Industry Revenue Share (%), by Competitive Landscape 2025 & 2033
- Figure 32: Europe Virtual Sensing Technology Industry Revenue (Million), by Addressing Market Challenges 2025 & 2033
- Figure 33: Europe Virtual Sensing Technology Industry Revenue Share (%), by Addressing Market Challenges 2025 & 2033
- Figure 34: Europe Virtual Sensing Technology Industry Revenue (Million), by Conclusion and Recommendations 2025 & 2033
- Figure 35: Europe Virtual Sensing Technology Industry Revenue Share (%), by Conclusion and Recommendations 2025 & 2033
- Figure 36: Europe Virtual Sensing Technology Industry Revenue (Million), by Country 2025 & 2033
- Figure 37: Europe Virtual Sensing Technology Industry Revenue Share (%), by Country 2025 & 2033
- Figure 38: Asia Virtual Sensing Technology Industry Revenue (Million), by Deployment Type 2025 & 2033
- Figure 39: Asia Virtual Sensing Technology Industry Revenue Share (%), by Deployment Type 2025 & 2033
- Figure 40: Asia Virtual Sensing Technology Industry Revenue (Million), by End-user Industry 2025 & 2033
- Figure 41: Asia Virtual Sensing Technology Industry Revenue Share (%), by End-user Industry 2025 & 2033
- Figure 42: Asia Virtual Sensing Technology Industry Revenue (Million), by Market Segmentation and Target Audience 2025 & 2033
- Figure 43: Asia Virtual Sensing Technology Industry Revenue Share (%), by Market Segmentation and Target Audience 2025 & 2033
- Figure 44: Asia Virtual Sensing Technology Industry Revenue (Million), by Value Proposition 2025 & 2033
- Figure 45: Asia Virtual Sensing Technology Industry Revenue Share (%), by Value Proposition 2025 & 2033
- Figure 46: Asia Virtual Sensing Technology Industry Revenue (Million), by Distribution Channel Strategies 2025 & 2033
- Figure 47: Asia Virtual Sensing Technology Industry Revenue Share (%), by Distribution Channel Strategies 2025 & 2033
- Figure 48: Asia Virtual Sensing Technology Industry Revenue (Million), by Competitive Landscape 2025 & 2033
- Figure 49: Asia Virtual Sensing Technology Industry Revenue Share (%), by Competitive Landscape 2025 & 2033
- Figure 50: Asia Virtual Sensing Technology Industry Revenue (Million), by Addressing Market Challenges 2025 & 2033
- Figure 51: Asia Virtual Sensing Technology Industry Revenue Share (%), by Addressing Market Challenges 2025 & 2033
- Figure 52: Asia Virtual Sensing Technology Industry Revenue (Million), by Conclusion and Recommendations 2025 & 2033
- Figure 53: Asia Virtual Sensing Technology Industry Revenue Share (%), by Conclusion and Recommendations 2025 & 2033
- Figure 54: Asia Virtual Sensing Technology Industry Revenue (Million), by Country 2025 & 2033
- Figure 55: Asia Virtual Sensing Technology Industry Revenue Share (%), by Country 2025 & 2033
- Figure 56: Australia and New Zealand Virtual Sensing Technology Industry Revenue (Million), by Deployment Type 2025 & 2033
- Figure 57: Australia and New Zealand Virtual Sensing Technology Industry Revenue Share (%), by Deployment Type 2025 & 2033
- Figure 58: Australia and New Zealand Virtual Sensing Technology Industry Revenue (Million), by End-user Industry 2025 & 2033
- Figure 59: Australia and New Zealand Virtual Sensing Technology Industry Revenue Share (%), by End-user Industry 2025 & 2033
- Figure 60: Australia and New Zealand Virtual Sensing Technology Industry Revenue (Million), by Market Segmentation and Target Audience 2025 & 2033
- Figure 61: Australia and New Zealand Virtual Sensing Technology Industry Revenue Share (%), by Market Segmentation and Target Audience 2025 & 2033
- Figure 62: Australia and New Zealand Virtual Sensing Technology Industry Revenue (Million), by Value Proposition 2025 & 2033
- Figure 63: Australia and New Zealand Virtual Sensing Technology Industry Revenue Share (%), by Value Proposition 2025 & 2033
- Figure 64: Australia and New Zealand Virtual Sensing Technology Industry Revenue (Million), by Distribution Channel Strategies 2025 & 2033
- Figure 65: Australia and New Zealand Virtual Sensing Technology Industry Revenue Share (%), by Distribution Channel Strategies 2025 & 2033
- Figure 66: Australia and New Zealand Virtual Sensing Technology Industry Revenue (Million), by Competitive Landscape 2025 & 2033
- Figure 67: Australia and New Zealand Virtual Sensing Technology Industry Revenue Share (%), by Competitive Landscape 2025 & 2033
- Figure 68: Australia and New Zealand Virtual Sensing Technology Industry Revenue (Million), by Addressing Market Challenges 2025 & 2033
- Figure 69: Australia and New Zealand Virtual Sensing Technology Industry Revenue Share (%), by Addressing Market Challenges 2025 & 2033
- Figure 70: Australia and New Zealand Virtual Sensing Technology Industry Revenue (Million), by Conclusion and Recommendations 2025 & 2033
- Figure 71: Australia and New Zealand Virtual Sensing Technology Industry Revenue Share (%), by Conclusion and Recommendations 2025 & 2033
- Figure 72: Australia and New Zealand Virtual Sensing Technology Industry Revenue (Million), by Country 2025 & 2033
- Figure 73: Australia and New Zealand Virtual Sensing Technology Industry Revenue Share (%), by Country 2025 & 2033
- Figure 74: Latin America Virtual Sensing Technology Industry Revenue (Million), by Deployment Type 2025 & 2033
- Figure 75: Latin America Virtual Sensing Technology Industry Revenue Share (%), by Deployment Type 2025 & 2033
- Figure 76: Latin America Virtual Sensing Technology Industry Revenue (Million), by End-user Industry 2025 & 2033
- Figure 77: Latin America Virtual Sensing Technology Industry Revenue Share (%), by End-user Industry 2025 & 2033
- Figure 78: Latin America Virtual Sensing Technology Industry Revenue (Million), by Market Segmentation and Target Audience 2025 & 2033
- Figure 79: Latin America Virtual Sensing Technology Industry Revenue Share (%), by Market Segmentation and Target Audience 2025 & 2033
- Figure 80: Latin America Virtual Sensing Technology Industry Revenue (Million), by Value Proposition 2025 & 2033
- Figure 81: Latin America Virtual Sensing Technology Industry Revenue Share (%), by Value Proposition 2025 & 2033
- Figure 82: Latin America Virtual Sensing Technology Industry Revenue (Million), by Distribution Channel Strategies 2025 & 2033
- Figure 83: Latin America Virtual Sensing Technology Industry Revenue Share (%), by Distribution Channel Strategies 2025 & 2033
- Figure 84: Latin America Virtual Sensing Technology Industry Revenue (Million), by Competitive Landscape 2025 & 2033
- Figure 85: Latin America Virtual Sensing Technology Industry Revenue Share (%), by Competitive Landscape 2025 & 2033
- Figure 86: Latin America Virtual Sensing Technology Industry Revenue (Million), by Addressing Market Challenges 2025 & 2033
- Figure 87: Latin America Virtual Sensing Technology Industry Revenue Share (%), by Addressing Market Challenges 2025 & 2033
- Figure 88: Latin America Virtual Sensing Technology Industry Revenue (Million), by Conclusion and Recommendations 2025 & 2033
- Figure 89: Latin America Virtual Sensing Technology Industry Revenue Share (%), by Conclusion and Recommendations 2025 & 2033
- Figure 90: Latin America Virtual Sensing Technology Industry Revenue (Million), by Country 2025 & 2033
- Figure 91: Latin America Virtual Sensing Technology Industry Revenue Share (%), by Country 2025 & 2033
- Figure 92: Middle East and Africa Virtual Sensing Technology Industry Revenue (Million), by Deployment Type 2025 & 2033
- Figure 93: Middle East and Africa Virtual Sensing Technology Industry Revenue Share (%), by Deployment Type 2025 & 2033
- Figure 94: Middle East and Africa Virtual Sensing Technology Industry Revenue (Million), by End-user Industry 2025 & 2033
- Figure 95: Middle East and Africa Virtual Sensing Technology Industry Revenue Share (%), by End-user Industry 2025 & 2033
- Figure 96: Middle East and Africa Virtual Sensing Technology Industry Revenue (Million), by Market Segmentation and Target Audience 2025 & 2033
- Figure 97: Middle East and Africa Virtual Sensing Technology Industry Revenue Share (%), by Market Segmentation and Target Audience 2025 & 2033
- Figure 98: Middle East and Africa Virtual Sensing Technology Industry Revenue (Million), by Value Proposition 2025 & 2033
- Figure 99: Middle East and Africa Virtual Sensing Technology Industry Revenue Share (%), by Value Proposition 2025 & 2033
- Figure 100: Middle East and Africa Virtual Sensing Technology Industry Revenue (Million), by Distribution Channel Strategies 2025 & 2033
- Figure 101: Middle East and Africa Virtual Sensing Technology Industry Revenue Share (%), by Distribution Channel Strategies 2025 & 2033
- Figure 102: Middle East and Africa Virtual Sensing Technology Industry Revenue (Million), by Competitive Landscape 2025 & 2033
- Figure 103: Middle East and Africa Virtual Sensing Technology Industry Revenue Share (%), by Competitive Landscape 2025 & 2033
- Figure 104: Middle East and Africa Virtual Sensing Technology Industry Revenue (Million), by Addressing Market Challenges 2025 & 2033
- Figure 105: Middle East and Africa Virtual Sensing Technology Industry Revenue Share (%), by Addressing Market Challenges 2025 & 2033
- Figure 106: Middle East and Africa Virtual Sensing Technology Industry Revenue (Million), by Conclusion and Recommendations 2025 & 2033
- Figure 107: Middle East and Africa Virtual Sensing Technology Industry Revenue Share (%), by Conclusion and Recommendations 2025 & 2033
- Figure 108: Middle East and Africa Virtual Sensing Technology Industry Revenue (Million), by Country 2025 & 2033
- Figure 109: Middle East and Africa Virtual Sensing Technology Industry Revenue Share (%), by Country 2025 & 2033
List of Tables
- Table 1: Global Virtual Sensing Technology Industry Revenue Million Forecast, by Deployment Type 2020 & 2033
- Table 2: Global Virtual Sensing Technology Industry Revenue Million Forecast, by End-user Industry 2020 & 2033
- Table 3: Global Virtual Sensing Technology Industry Revenue Million Forecast, by Market Segmentation and Target Audience 2020 & 2033
- Table 4: Global Virtual Sensing Technology Industry Revenue Million Forecast, by Value Proposition 2020 & 2033
- Table 5: Global Virtual Sensing Technology Industry Revenue Million Forecast, by Distribution Channel Strategies 2020 & 2033
- Table 6: Global Virtual Sensing Technology Industry Revenue Million Forecast, by Competitive Landscape 2020 & 2033
- Table 7: Global Virtual Sensing Technology Industry Revenue Million Forecast, by Addressing Market Challenges 2020 & 2033
- Table 8: Global Virtual Sensing Technology Industry Revenue Million Forecast, by Conclusion and Recommendations 2020 & 2033
- Table 9: Global Virtual Sensing Technology Industry Revenue Million Forecast, by Region 2020 & 2033
- Table 10: Global Virtual Sensing Technology Industry Revenue Million Forecast, by Deployment Type 2020 & 2033
- Table 11: Global Virtual Sensing Technology Industry Revenue Million Forecast, by End-user Industry 2020 & 2033
- Table 12: Global Virtual Sensing Technology Industry Revenue Million Forecast, by Market Segmentation and Target Audience 2020 & 2033
- Table 13: Global Virtual Sensing Technology Industry Revenue Million Forecast, by Value Proposition 2020 & 2033
- Table 14: Global Virtual Sensing Technology Industry Revenue Million Forecast, by Distribution Channel Strategies 2020 & 2033
- Table 15: Global Virtual Sensing Technology Industry Revenue Million Forecast, by Competitive Landscape 2020 & 2033
- Table 16: Global Virtual Sensing Technology Industry Revenue Million Forecast, by Addressing Market Challenges 2020 & 2033
- Table 17: Global Virtual Sensing Technology Industry Revenue Million Forecast, by Conclusion and Recommendations 2020 & 2033
- Table 18: Global Virtual Sensing Technology Industry Revenue Million Forecast, by Country 2020 & 2033
- Table 19: United States Virtual Sensing Technology Industry Revenue (Million) Forecast, by Application 2020 & 2033
- Table 20: Canada Virtual Sensing Technology Industry Revenue (Million) Forecast, by Application 2020 & 2033
- Table 21: Global Virtual Sensing Technology Industry Revenue Million Forecast, by Deployment Type 2020 & 2033
- Table 22: Global Virtual Sensing Technology Industry Revenue Million Forecast, by End-user Industry 2020 & 2033
- Table 23: Global Virtual Sensing Technology Industry Revenue Million Forecast, by Market Segmentation and Target Audience 2020 & 2033
- Table 24: Global Virtual Sensing Technology Industry Revenue Million Forecast, by Value Proposition 2020 & 2033
- Table 25: Global Virtual Sensing Technology Industry Revenue Million Forecast, by Distribution Channel Strategies 2020 & 2033
- Table 26: Global Virtual Sensing Technology Industry Revenue Million Forecast, by Competitive Landscape 2020 & 2033
- Table 27: Global Virtual Sensing Technology Industry Revenue Million Forecast, by Addressing Market Challenges 2020 & 2033
- Table 28: Global Virtual Sensing Technology Industry Revenue Million Forecast, by Conclusion and Recommendations 2020 & 2033
- Table 29: Global Virtual Sensing Technology Industry Revenue Million Forecast, by Country 2020 & 2033
- Table 30: United Kingdom Virtual Sensing Technology Industry Revenue (Million) Forecast, by Application 2020 & 2033
- Table 31: Germany Virtual Sensing Technology Industry Revenue (Million) Forecast, by Application 2020 & 2033
- Table 32: France Virtual Sensing Technology Industry Revenue (Million) Forecast, by Application 2020 & 2033
- Table 33: Italy Virtual Sensing Technology Industry Revenue (Million) Forecast, by Application 2020 & 2033
- Table 34: Global Virtual Sensing Technology Industry Revenue Million Forecast, by Deployment Type 2020 & 2033
- Table 35: Global Virtual Sensing Technology Industry Revenue Million Forecast, by End-user Industry 2020 & 2033
- Table 36: Global Virtual Sensing Technology Industry Revenue Million Forecast, by Market Segmentation and Target Audience 2020 & 2033
- Table 37: Global Virtual Sensing Technology Industry Revenue Million Forecast, by Value Proposition 2020 & 2033
- Table 38: Global Virtual Sensing Technology Industry Revenue Million Forecast, by Distribution Channel Strategies 2020 & 2033
- Table 39: Global Virtual Sensing Technology Industry Revenue Million Forecast, by Competitive Landscape 2020 & 2033
- Table 40: Global Virtual Sensing Technology Industry Revenue Million Forecast, by Addressing Market Challenges 2020 & 2033
- Table 41: Global Virtual Sensing Technology Industry Revenue Million Forecast, by Conclusion and Recommendations 2020 & 2033
- Table 42: Global Virtual Sensing Technology Industry Revenue Million Forecast, by Country 2020 & 2033
- Table 43: China Virtual Sensing Technology Industry Revenue (Million) Forecast, by Application 2020 & 2033
- Table 44: Japan Virtual Sensing Technology Industry Revenue (Million) Forecast, by Application 2020 & 2033
- Table 45: India Virtual Sensing Technology Industry Revenue (Million) Forecast, by Application 2020 & 2033
- Table 46: Global Virtual Sensing Technology Industry Revenue Million Forecast, by Deployment Type 2020 & 2033
- Table 47: Global Virtual Sensing Technology Industry Revenue Million Forecast, by End-user Industry 2020 & 2033
- Table 48: Global Virtual Sensing Technology Industry Revenue Million Forecast, by Market Segmentation and Target Audience 2020 & 2033
- Table 49: Global Virtual Sensing Technology Industry Revenue Million Forecast, by Value Proposition 2020 & 2033
- Table 50: Global Virtual Sensing Technology Industry Revenue Million Forecast, by Distribution Channel Strategies 2020 & 2033
- Table 51: Global Virtual Sensing Technology Industry Revenue Million Forecast, by Competitive Landscape 2020 & 2033
- Table 52: Global Virtual Sensing Technology Industry Revenue Million Forecast, by Addressing Market Challenges 2020 & 2033
- Table 53: Global Virtual Sensing Technology Industry Revenue Million Forecast, by Conclusion and Recommendations 2020 & 2033
- Table 54: Global Virtual Sensing Technology Industry Revenue Million Forecast, by Country 2020 & 2033
- Table 55: Global Virtual Sensing Technology Industry Revenue Million Forecast, by Deployment Type 2020 & 2033
- Table 56: Global Virtual Sensing Technology Industry Revenue Million Forecast, by End-user Industry 2020 & 2033
- Table 57: Global Virtual Sensing Technology Industry Revenue Million Forecast, by Market Segmentation and Target Audience 2020 & 2033
- Table 58: Global Virtual Sensing Technology Industry Revenue Million Forecast, by Value Proposition 2020 & 2033
- Table 59: Global Virtual Sensing Technology Industry Revenue Million Forecast, by Distribution Channel Strategies 2020 & 2033
- Table 60: Global Virtual Sensing Technology Industry Revenue Million Forecast, by Competitive Landscape 2020 & 2033
- Table 61: Global Virtual Sensing Technology Industry Revenue Million Forecast, by Addressing Market Challenges 2020 & 2033
- Table 62: Global Virtual Sensing Technology Industry Revenue Million Forecast, by Conclusion and Recommendations 2020 & 2033
- Table 63: Global Virtual Sensing Technology Industry Revenue Million Forecast, by Country 2020 & 2033
- Table 64: Global Virtual Sensing Technology Industry Revenue Million Forecast, by Deployment Type 2020 & 2033
- Table 65: Global Virtual Sensing Technology Industry Revenue Million Forecast, by End-user Industry 2020 & 2033
- Table 66: Global Virtual Sensing Technology Industry Revenue Million Forecast, by Market Segmentation and Target Audience 2020 & 2033
- Table 67: Global Virtual Sensing Technology Industry Revenue Million Forecast, by Value Proposition 2020 & 2033
- Table 68: Global Virtual Sensing Technology Industry Revenue Million Forecast, by Distribution Channel Strategies 2020 & 2033
- Table 69: Global Virtual Sensing Technology Industry Revenue Million Forecast, by Competitive Landscape 2020 & 2033
- Table 70: Global Virtual Sensing Technology Industry Revenue Million Forecast, by Addressing Market Challenges 2020 & 2033
- Table 71: Global Virtual Sensing Technology Industry Revenue Million Forecast, by Conclusion and Recommendations 2020 & 2033
- Table 72: Global Virtual Sensing Technology Industry Revenue Million Forecast, by Country 2020 & 2033
Frequently Asked Questions
1. What is the projected Compound Annual Growth Rate (CAGR) of the Virtual Sensing Technology Industry?
The projected CAGR is approximately 31.38%.
2. Which companies are prominent players in the Virtual Sensing Technology Industry?
Key companies in the market include Körber AG, Modelway SRL, Elliptic Labs ASA, Cisco Systems Inc, Siemens AG, Schneider Electric SE, Andata Lt, Intelli Dynamics (Biocomp Systems Inc ), General Electric Company.
3. What are the main segments of the Virtual Sensing Technology Industry?
The market segments include Deployment Type, End-user Industry, Market Segmentation and Target Audience, Value Proposition, Distribution Channel Strategies, Competitive Landscape, Addressing Market Challenges, Conclusion and Recommendations.
4. Can you provide details about the market size?
The market size is estimated to be USD 1.04 Million as of 2022.
5. What are some drivers contributing to market growth?
Increasing Adoption of IoT and Cloud Platform Is Expected to Drive the Market; Growing Need For Enhanced Cost-effectiveness and Operational Efficiency in Manufacturing.
6. What are the notable trends driving market growth?
Transportation and Automotive Industry to be the Fastest Growing End User.
7. Are there any restraints impacting market growth?
High Deployment and Maintenance Cost.
8. Can you provide examples of recent developments in the market?
March 2024 - Elliptic Labs announced that it has deployed over 500 million devices and is shipping its AI Virtual Proximity Sensor INNER BEAUTY on the Lava Blaze Curve smartphone. Elliptic Labs' newest smartphone customer, Lava International, has released the Lava Blaze Curve smartphone for the international market. Lava has collaborated with Elliptic Labs' partner MediaTek and chosen MediaTek's Dimensity 7050 chipset to drive the Blaze Curve smartphone. Elliptic Labs previously announced the contract for this launch.
9. What pricing options are available for accessing the report?
Pricing options include single-user, multi-user, and enterprise licenses priced at USD 4750, USD 5250, and USD 8750 respectively.
10. Is the market size provided in terms of value or volume?
The market size is provided in terms of value, measured in Million.
11. Are there any specific market keywords associated with the report?
Yes, the market keyword associated with the report is "Virtual Sensing Technology Industry," which aids in identifying and referencing the specific market segment covered.
12. How do I determine which pricing option suits my needs best?
The pricing options vary based on user requirements and access needs. Individual users may opt for single-user licenses, while businesses requiring broader access may choose multi-user or enterprise licenses for cost-effective access to the report.
13. Are there any additional resources or data provided in the Virtual Sensing Technology Industry report?
While the report offers comprehensive insights, it's advisable to review the specific contents or supplementary materials provided to ascertain if additional resources or data are available.
14. How can I stay updated on further developments or reports in the Virtual Sensing Technology Industry?
To stay informed about further developments, trends, and reports in the Virtual Sensing Technology Industry, consider subscribing to industry newsletters, following relevant companies and organizations, or regularly checking reputable industry news sources and publications.
Methodology
Step 1 - Identification of Relevant Samples Size from Population Database


Step 2 - Approaches for Defining Global Market Size (Value, Volume* & Price*)

Note*: In applicable scenarios
Step 3 - Data Sources
Primary Research
- Web Analytics
- Survey Reports
- Research Institute
- Latest Research Reports
- Opinion Leaders
Secondary Research
- Annual Reports
- White Paper
- Latest Press Release
- Industry Association
- Paid Database
- Investor Presentations

Step 4 - Data Triangulation
Involves using different sources of information in order to increase the validity of a study
These sources are likely to be stakeholders in a program - participants, other researchers, program staff, other community members, and so on.
Then we put all data in single framework & apply various statistical tools to find out the dynamic on the market.
During the analysis stage, feedback from the stakeholder groups would be compared to determine areas of agreement as well as areas of divergence