

Key Insights
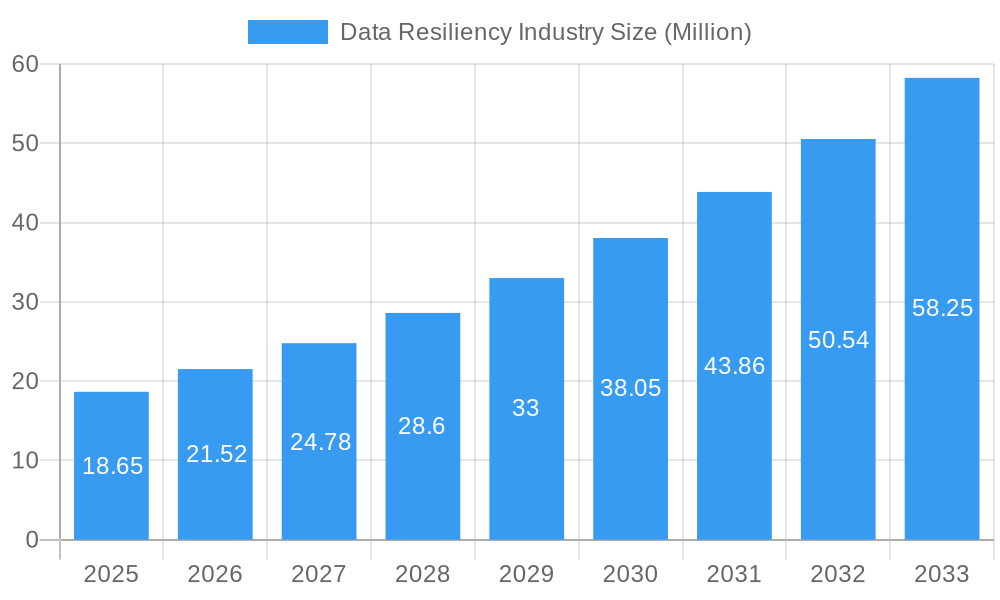
The Data Resiliency industry is poised for remarkable expansion, projected to reach a substantial market size of $18.65 million by 2025, driven by a robust Compound Annual Growth Rate (CAGR) of 15.38%. This dynamic growth is fueled by escalating data volumes across all sectors, the increasing complexity of IT infrastructures, and the imperative for businesses to safeguard against disruptive events like cyberattacks, natural disasters, and system failures. Organizations are recognizing that comprehensive data resiliency is no longer a luxury but a critical component of business continuity and operational integrity. The adoption of cloud-based solutions is particularly accelerating this trend, offering scalability, flexibility, and cost-effectiveness compared to traditional on-premise deployments. Key drivers include stringent regulatory compliance demands that necessitate robust data protection and recovery strategies, as well as the growing awareness of the significant financial and reputational damage that data loss can inflict.
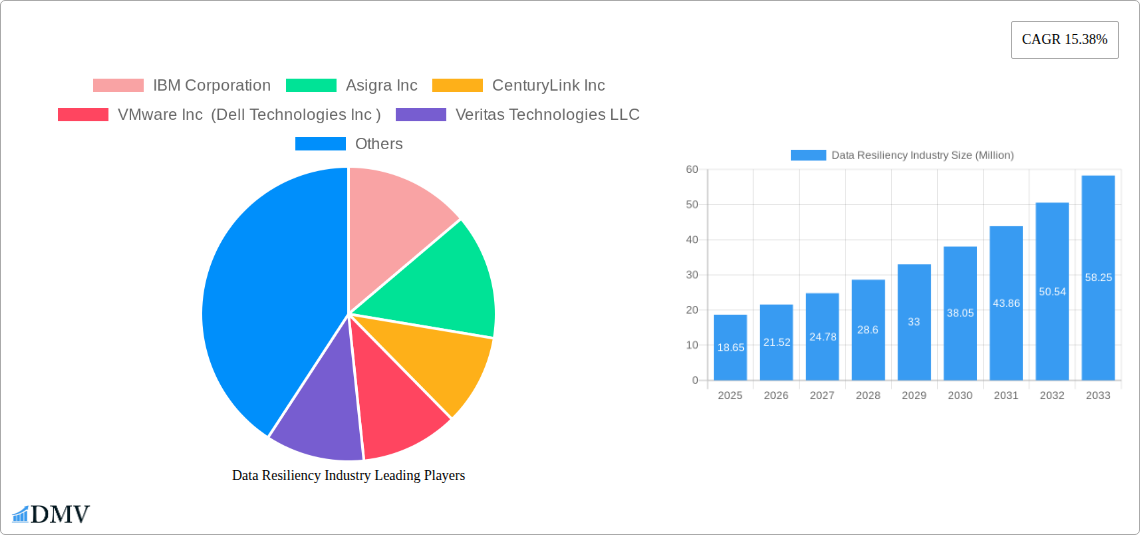
Data Resiliency Industry Market Size (In Million)
The market segmentation reveals a strong preference for cloud deployment models, aligning with the broader digital transformation initiatives seen across industries. The BFSI, IT & Telecommunication, and Government sectors are leading the charge in adopting advanced data resiliency solutions due to the sensitive nature of their data and the high stakes associated with downtime. While the market is characterized by fierce competition among established players like IBM Corporation, VMware, and Microsoft, and innovative emerging companies, the continuous evolution of cyber threats and the increasing sophistication of data recovery technologies present ongoing opportunities. Restraints, such as the initial cost of implementation for some advanced solutions and the potential skills gap in managing complex resiliency platforms, are being addressed through managed services and the development of more user-friendly interfaces. Emerging trends include the integration of AI and machine learning for proactive threat detection and automated recovery processes, further solidifying the importance of data resiliency in the modern business landscape.
Data Resiliency Industry Company Market Share
Data Resiliency Industry Market Composition & Trends
The Data Resiliency industry is characterized by a dynamic market structure, with a moderate to high level of concentration driven by significant investments in data protection strategies, disaster recovery solutions, and business continuity planning. Innovation is a key catalyst, fueled by the escalating threat landscape of cyberattacks, ransomware, and natural disasters. Regulatory landscapes, particularly in sectors like BFSI and Healthcare, are increasingly mandating stringent data governance and data backup compliance, further shaping market entry and competitive strategies. Substitute products and services exist, primarily in the form of manual data recovery processes or less robust backup solutions, but these are rapidly being outpaced by the sophisticated offerings in the cloud data backup and enterprise data protection space. End-user profiles are diverse, spanning small businesses to large enterprises across verticals like IT & Telecommunication, Manufacturing, and Government. Mergers and acquisitions (M&A) are a significant trend, with recent deal values in the data resiliency market estimated at over 2,000 Million. These consolidations aim to expand service portfolios, acquire new technologies, and gain market share in the global data resiliency solutions landscape. The market share distribution indicates a strong presence of established players, but emerging innovators are also carving out significant niches.
- Market Concentration: Moderate to High, driven by key players investing in data loss prevention and data redundancy.
- Innovation Catalysts: Rising cyber threats, ransomware attacks, compliance mandates.
- Regulatory Landscapes: Increasing focus on data sovereignty, privacy (e.g., GDPR, CCPA), and enterprise data backup requirements.
- Substitute Products: Manual recovery, less robust backup solutions.
- End-User Profiles: SMBs to Enterprises, across BFSI, IT & Telecom, Government, Manufacturing, Healthcare.
- M&A Activities: Significant, with deal values projected to exceed 2,000 Million in the coming years.
Data Resiliency Industry Industry Evolution
The Data Resiliency industry has witnessed a remarkable evolutionary trajectory, transforming from basic data backup to comprehensive business continuity and disaster recovery (BCDR) solutions. Over the Study Period (2019–2033), the market has experienced a compound annual growth rate (CAGR) of approximately 12%. This robust expansion is a direct consequence of the escalating digital transformation across all sectors, leading to unprecedented data volumes and an increased reliance on the continuous availability of information. The Base Year (2025) marks a critical juncture where adoption of cloud-native data resilience services has surged, projected to account for over 60% of new deployments. Technological advancements have been instrumental, with the integration of AI and machine learning into data recovery platforms enabling predictive analytics for potential failures and automating recovery processes. This has significantly reduced Recovery Time Objectives (RTO) and Recovery Point Objectives (RPO), making zero downtime solutions a tangible reality for many organizations.
Shifting consumer demands, driven by the expectation of uninterrupted service and the increasing impact of data breaches, have pushed organizations to prioritize robust data protection. The Forecast Period (2025–2033) anticipates continued strong growth, with the market size projected to reach over 250,000 Million by 2033. Adoption metrics for advanced data archiving and data replication technologies are expected to climb, with over 75% of enterprises adopting multi-cloud or hybrid cloud strategies for their data resiliency needs. The historical performance during 2019–2024 laid the groundwork for this accelerated growth, with a CAGR of around 10% observed. The increasing awareness of data security threats and the financial and reputational damage associated with data loss have cemented data resiliency as a mission-critical IT function, no longer an optional add-on. This evolution underscores a fundamental shift towards proactive data management and an unwavering commitment to operational continuity in the face of unforeseen disruptions. The market is moving beyond simple backup to holistic resilience-as-a-service (RaaS) models, offering enhanced flexibility and scalability.
Leading Regions, Countries, or Segments in Data Resiliency Industry
The Cloud segment is definitively leading the Data Resiliency Industry, demonstrating an exceptional growth trajectory and dominance. This ascendancy is propelled by several key drivers including unparalleled scalability, cost-effectiveness, and the agility to adapt to fluctuating data demands. Investment trends within the cloud segment are soaring, with a significant portion of IT budgets allocated to cloud-based disaster recovery and SaaS backup solutions. Regulatory support, while global in its scope, often favors cloud solutions due to their inherent ability to meet stringent compliance requirements more efficiently than traditional on-premise infrastructures.
The dominance of the cloud segment is further amplified by its strong penetration across all major end-user verticals, particularly in the IT & Telecommunication and BFSI sectors. These industries, handling vast amounts of sensitive data, are at the forefront of adopting cloud-native data protection strategies to ensure continuous service availability and compliance. Government entities are also increasingly migrating to cloud-based data archiving and data resilience platforms to enhance national data security and accessibility. While On-premise deployments still hold a significant share, particularly for highly regulated industries or those with specific data sovereignty concerns, the growth rate of cloud solutions is substantially higher. The ability of cloud providers to offer geographically dispersed data centers also plays a crucial role in mitigating regional disasters.
The BFSI vertical, specifically, exhibits a pronounced preference for robust data resiliency solutions due to the critical nature of financial transactions and regulatory mandates around data integrity and availability. Similarly, the IT & Telecommunication sector relies heavily on uninterrupted services, making cloud disaster recovery and business continuity planning paramount. Manufacturing and Healthcare, while historically more inclined towards on-premise, are rapidly embracing cloud solutions for their flexibility and advanced data backup capabilities. The "Other End-user Vertical" also represents a growing segment, indicating the universal need for data resiliency across diverse business landscapes. The market size for the cloud segment in data resiliency is projected to exceed 180,000 Million by 2033, far surpassing other deployment models.
- Dominant Segment: Cloud
- Key Drivers for Cloud Dominance:
- Unparalleled Scalability and Agility
- Cost-Effectiveness and Reduced CAPEX
- Enhanced Disaster Recovery Capabilities (Geo-redundancy)
- Simplified Management and Maintenance
- Alignment with Digital Transformation Initiatives
- Leading End-User Verticals in Cloud Adoption:
- IT & Telecommunication
- BFSI
- Government
- Emerging Trends in Cloud Data Resiliency:
- Rise of Resilience-as-a-Service (RaaS)
- AI/ML integration for proactive threat detection and automated recovery
- Increased adoption of hybrid and multi-cloud data resiliency strategies
Data Resiliency Industry Product Innovations
Product innovations in the Data Resiliency industry are rapidly advancing, focusing on enhanced efficiency, automation, and comprehensive data protection. Key developments include the integration of artificial intelligence and machine learning for predictive analytics, enabling early detection of potential data corruption or system failures. Furthermore, advancements in immutable backups are providing superior protection against ransomware attacks by ensuring that backup data cannot be altered or deleted. The emergence of SaaS-based data backup solutions offers seamless protection for cloud applications, while hyperconverged infrastructure (HCI) solutions are simplifying the deployment and management of data resiliency capabilities for enterprises. Performance metrics are seeing significant improvements, with RTOs and RPOs shrinking to near-zero in many advanced solutions.
Propelling Factors for Data Resiliency Industry Growth
The Data Resiliency industry is experiencing robust growth driven by several critical factors. The escalating frequency and sophistication of cyber threats, particularly ransomware, necessitate advanced data protection and disaster recovery solutions. Increasing regulatory compliance demands across industries like BFSI and Healthcare mandate robust data governance and data backup strategies, compelling organizations to invest. The ongoing digital transformation and proliferation of data volumes across cloud, on-premise, and hybrid environments create a constant need for scalable and reliable data resiliency. Economic factors, such as the high cost of data loss and downtime, further incentivize investments in resilient infrastructure.
Obstacles in the Data Resiliency Industry Market
Despite strong growth, the Data Resiliency industry faces several obstacles. The complexity of managing diverse data environments, including multi-cloud and hybrid architectures, can pose significant challenges for implementation and maintenance. High upfront costs associated with advanced disaster recovery solutions can be a barrier for some small and medium-sized businesses. Evolving regulatory landscapes, while a driver, also present challenges in staying compliant across different jurisdictions and data types. Furthermore, a shortage of skilled IT professionals with expertise in data resiliency management can hinder adoption and effective deployment.
Future Opportunities in Data Resiliency Industry
The Data Resiliency industry is poised for significant future opportunities. The increasing adoption of edge computing and the Internet of Things (IoT) will generate vast amounts of data requiring resilient storage and recovery solutions. The expansion of Resilience-as-a-Service (RaaS) models offers new avenues for service providers to offer flexible, subscription-based data protection. Emerging markets in developing economies represent a substantial untapped potential for data backup and disaster recovery solutions. Furthermore, advancements in AI and machine learning are opening up opportunities for more proactive and automated data resiliency capabilities.
Major Players in the Data Resiliency Industry Ecosystem
- IBM Corporation
- Asigra Inc
- CenturyLink Inc
- VMware Inc (Dell Technologies Inc)
- Veritas Technologies LLC
- Microsoft Corporation
- NetApp Inc
- Carbonite Inc (OpenText Corporation)
- Acronis International GmbH
- Micro Focus International plc
- Commvault Systems Inc
Key Developments in Data Resiliency Industry Industry
- 2024 January: Acronis launches advanced ransomware protection features for its Cyber Protect Cloud platform.
- 2024 February: IBM announces enhanced cloud-based disaster recovery capabilities for its Spectrum Protect offerings.
- 2024 March: VMware introduces new data resiliency tools integrated with its vSphere platform.
- 2024 April: Microsoft expands its Azure Backup service with new features for enterprise-level data protection.
- 2024 May: Veritas Technologies acquires a company specializing in cloud-native data protection solutions.
- 2024 June: Commvault Systems announces strategic partnerships to bolster its data resiliency solutions in the BFSI sector.
- 2024 July: NetApp enhances its ONTAP data management software with improved data replication and recovery features.
- 2024 August: Carbonite (OpenText) expands its SaaS backup solutions to cover a wider range of cloud applications.
- 2024 September: Asigra introduces new automated disaster recovery orchestration for hybrid cloud environments.
- 2024 October: Micro Focus International plc unveils next-generation enterprise data backup and recovery strategies.
Strategic Data Resiliency Industry Market Forecast
The strategic forecast for the Data Resiliency industry is exceptionally promising, driven by an unyielding demand for robust data protection in an increasingly threat-prone digital world. The continued migration to cloud environments, coupled with the imperative for business continuity, will fuel significant market expansion. Emerging technologies such as AI-powered predictive analytics and immutable backups will become standard offerings, enhancing the effectiveness of disaster recovery solutions. Furthermore, the growing emphasis on data sovereignty and compliance will create new opportunities for specialized data resiliency services. The market is expected to witness sustained growth, exceeding 250,000 Million by 2033, driven by innovation and the critical need to safeguard against data loss.
Data Resiliency Industry Segmentation
-
1. Deployment
- 1.1. On-premise
- 1.2. Cloud
-
2. End-user Vertical
- 2.1. BFSI
- 2.2. IT & Telecommunication
- 2.3. Government
- 2.4. Manufacturing
- 2.5. Healthcare
- 2.6. Other End-user Vertical
Data Resiliency Industry Segmentation By Geography
- 1. North America
- 2. Europe
- 3. Asia Pacific
- 4. Latin America
- 5. Middle East
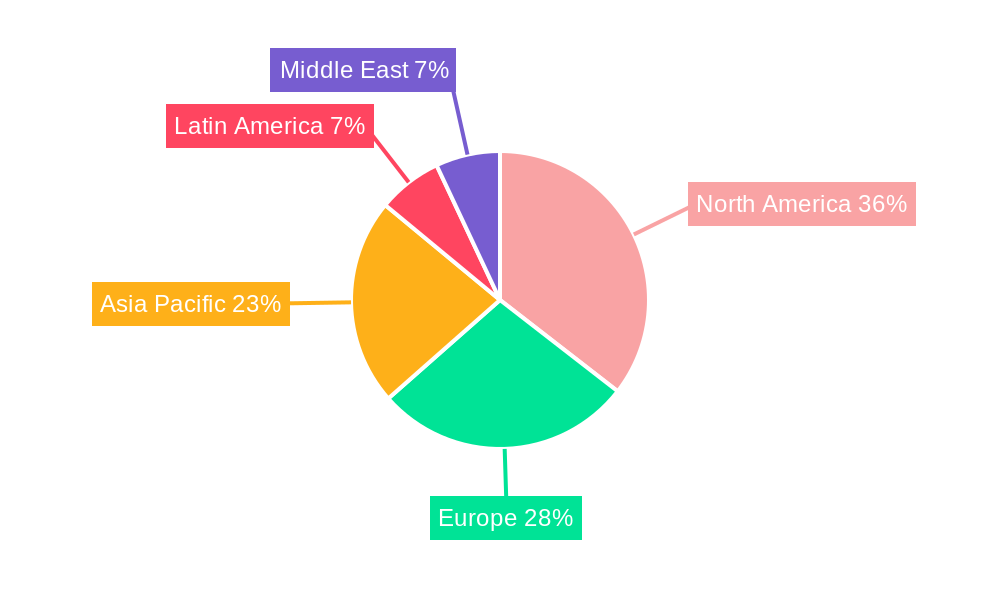
Data Resiliency Industry Regional Market Share
Geographic Coverage of Data Resiliency Industry
Data Resiliency Industry REPORT HIGHLIGHTS
| Aspects | Details |
|---|---|
| Study Period | 2020-2034 |
| Base Year | 2025 |
| Estimated Year | 2026 |
| Forecast Period | 2026-2034 |
| Historical Period | 2020-2025 |
| Growth Rate | CAGR of 15.38% from 2020-2034 |
| Segmentation |
|
Table of Contents
- 1. Introduction
- 1.1. Research Scope
- 1.2. Market Segmentation
- 1.3. Research Methodology
- 1.4. Definitions and Assumptions
- 2. Executive Summary
- 2.1. Introduction
- 3. Market Dynamics
- 3.1. Introduction
- 3.2. Market Drivers
- 3.2.1. ; Rapid Growth in Data being Generated from Multiple Sources; Increasing Privacy Concerns and Rising Need for Data Security
- 3.3. Market Restrains
- 3.3.1. ; Availability of open-source alternatives
- 3.4. Market Trends
- 3.4.1. BFSI Segment is Expected to Witness Significant Growth
- 4. Market Factor Analysis
- 4.1. Porters Five Forces
- 4.2. Supply/Value Chain
- 4.3. PESTEL analysis
- 4.4. Market Entropy
- 4.5. Patent/Trademark Analysis
- 5. Global Data Resiliency Industry Analysis, Insights and Forecast, 2020-2032
- 5.1. Market Analysis, Insights and Forecast - by Deployment
- 5.1.1. On-premise
- 5.1.2. Cloud
- 5.2. Market Analysis, Insights and Forecast - by End-user Vertical
- 5.2.1. BFSI
- 5.2.2. IT & Telecommunication
- 5.2.3. Government
- 5.2.4. Manufacturing
- 5.2.5. Healthcare
- 5.2.6. Other End-user Vertical
- 5.3. Market Analysis, Insights and Forecast - by Region
- 5.3.1. North America
- 5.3.2. Europe
- 5.3.3. Asia Pacific
- 5.3.4. Latin America
- 5.3.5. Middle East
- 5.1. Market Analysis, Insights and Forecast - by Deployment
- 6. North America Data Resiliency Industry Analysis, Insights and Forecast, 2020-2032
- 6.1. Market Analysis, Insights and Forecast - by Deployment
- 6.1.1. On-premise
- 6.1.2. Cloud
- 6.2. Market Analysis, Insights and Forecast - by End-user Vertical
- 6.2.1. BFSI
- 6.2.2. IT & Telecommunication
- 6.2.3. Government
- 6.2.4. Manufacturing
- 6.2.5. Healthcare
- 6.2.6. Other End-user Vertical
- 6.1. Market Analysis, Insights and Forecast - by Deployment
- 7. Europe Data Resiliency Industry Analysis, Insights and Forecast, 2020-2032
- 7.1. Market Analysis, Insights and Forecast - by Deployment
- 7.1.1. On-premise
- 7.1.2. Cloud
- 7.2. Market Analysis, Insights and Forecast - by End-user Vertical
- 7.2.1. BFSI
- 7.2.2. IT & Telecommunication
- 7.2.3. Government
- 7.2.4. Manufacturing
- 7.2.5. Healthcare
- 7.2.6. Other End-user Vertical
- 7.1. Market Analysis, Insights and Forecast - by Deployment
- 8. Asia Pacific Data Resiliency Industry Analysis, Insights and Forecast, 2020-2032
- 8.1. Market Analysis, Insights and Forecast - by Deployment
- 8.1.1. On-premise
- 8.1.2. Cloud
- 8.2. Market Analysis, Insights and Forecast - by End-user Vertical
- 8.2.1. BFSI
- 8.2.2. IT & Telecommunication
- 8.2.3. Government
- 8.2.4. Manufacturing
- 8.2.5. Healthcare
- 8.2.6. Other End-user Vertical
- 8.1. Market Analysis, Insights and Forecast - by Deployment
- 9. Latin America Data Resiliency Industry Analysis, Insights and Forecast, 2020-2032
- 9.1. Market Analysis, Insights and Forecast - by Deployment
- 9.1.1. On-premise
- 9.1.2. Cloud
- 9.2. Market Analysis, Insights and Forecast - by End-user Vertical
- 9.2.1. BFSI
- 9.2.2. IT & Telecommunication
- 9.2.3. Government
- 9.2.4. Manufacturing
- 9.2.5. Healthcare
- 9.2.6. Other End-user Vertical
- 9.1. Market Analysis, Insights and Forecast - by Deployment
- 10. Middle East Data Resiliency Industry Analysis, Insights and Forecast, 2020-2032
- 10.1. Market Analysis, Insights and Forecast - by Deployment
- 10.1.1. On-premise
- 10.1.2. Cloud
- 10.2. Market Analysis, Insights and Forecast - by End-user Vertical
- 10.2.1. BFSI
- 10.2.2. IT & Telecommunication
- 10.2.3. Government
- 10.2.4. Manufacturing
- 10.2.5. Healthcare
- 10.2.6. Other End-user Vertical
- 10.1. Market Analysis, Insights and Forecast - by Deployment
- 11. Competitive Analysis
- 11.1. Global Market Share Analysis 2025
- 11.2. Company Profiles
- 11.2.1 IBM Corporation
- 11.2.1.1. Overview
- 11.2.1.2. Products
- 11.2.1.3. SWOT Analysis
- 11.2.1.4. Recent Developments
- 11.2.1.5. Financials (Based on Availability)
- 11.2.2 Asigra Inc
- 11.2.2.1. Overview
- 11.2.2.2. Products
- 11.2.2.3. SWOT Analysis
- 11.2.2.4. Recent Developments
- 11.2.2.5. Financials (Based on Availability)
- 11.2.3 CenturyLink Inc
- 11.2.3.1. Overview
- 11.2.3.2. Products
- 11.2.3.3. SWOT Analysis
- 11.2.3.4. Recent Developments
- 11.2.3.5. Financials (Based on Availability)
- 11.2.4 VMware Inc (Dell Technologies Inc )
- 11.2.4.1. Overview
- 11.2.4.2. Products
- 11.2.4.3. SWOT Analysis
- 11.2.4.4. Recent Developments
- 11.2.4.5. Financials (Based on Availability)
- 11.2.5 Veritas Technologies LLC
- 11.2.5.1. Overview
- 11.2.5.2. Products
- 11.2.5.3. SWOT Analysis
- 11.2.5.4. Recent Developments
- 11.2.5.5. Financials (Based on Availability)
- 11.2.6 Microsoft Corporation
- 11.2.6.1. Overview
- 11.2.6.2. Products
- 11.2.6.3. SWOT Analysis
- 11.2.6.4. Recent Developments
- 11.2.6.5. Financials (Based on Availability)
- 11.2.7 NetApp Inc
- 11.2.7.1. Overview
- 11.2.7.2. Products
- 11.2.7.3. SWOT Analysis
- 11.2.7.4. Recent Developments
- 11.2.7.5. Financials (Based on Availability)
- 11.2.8 Carbonite Inc (OpenText Corporation)
- 11.2.8.1. Overview
- 11.2.8.2. Products
- 11.2.8.3. SWOT Analysis
- 11.2.8.4. Recent Developments
- 11.2.8.5. Financials (Based on Availability)
- 11.2.9 Acronis International GmbH
- 11.2.9.1. Overview
- 11.2.9.2. Products
- 11.2.9.3. SWOT Analysis
- 11.2.9.4. Recent Developments
- 11.2.9.5. Financials (Based on Availability)
- 11.2.10 Micro Focus International plc
- 11.2.10.1. Overview
- 11.2.10.2. Products
- 11.2.10.3. SWOT Analysis
- 11.2.10.4. Recent Developments
- 11.2.10.5. Financials (Based on Availability)
- 11.2.11 Commvault Systems Inc
- 11.2.11.1. Overview
- 11.2.11.2. Products
- 11.2.11.3. SWOT Analysis
- 11.2.11.4. Recent Developments
- 11.2.11.5. Financials (Based on Availability)
- 11.2.1 IBM Corporation
List of Figures
- Figure 1: Global Data Resiliency Industry Revenue Breakdown (Million, %) by Region 2025 & 2033
- Figure 2: Global Data Resiliency Industry Volume Breakdown (K Unit, %) by Region 2025 & 2033
- Figure 3: North America Data Resiliency Industry Revenue (Million), by Deployment 2025 & 2033
- Figure 4: North America Data Resiliency Industry Volume (K Unit), by Deployment 2025 & 2033
- Figure 5: North America Data Resiliency Industry Revenue Share (%), by Deployment 2025 & 2033
- Figure 6: North America Data Resiliency Industry Volume Share (%), by Deployment 2025 & 2033
- Figure 7: North America Data Resiliency Industry Revenue (Million), by End-user Vertical 2025 & 2033
- Figure 8: North America Data Resiliency Industry Volume (K Unit), by End-user Vertical 2025 & 2033
- Figure 9: North America Data Resiliency Industry Revenue Share (%), by End-user Vertical 2025 & 2033
- Figure 10: North America Data Resiliency Industry Volume Share (%), by End-user Vertical 2025 & 2033
- Figure 11: North America Data Resiliency Industry Revenue (Million), by Country 2025 & 2033
- Figure 12: North America Data Resiliency Industry Volume (K Unit), by Country 2025 & 2033
- Figure 13: North America Data Resiliency Industry Revenue Share (%), by Country 2025 & 2033
- Figure 14: North America Data Resiliency Industry Volume Share (%), by Country 2025 & 2033
- Figure 15: Europe Data Resiliency Industry Revenue (Million), by Deployment 2025 & 2033
- Figure 16: Europe Data Resiliency Industry Volume (K Unit), by Deployment 2025 & 2033
- Figure 17: Europe Data Resiliency Industry Revenue Share (%), by Deployment 2025 & 2033
- Figure 18: Europe Data Resiliency Industry Volume Share (%), by Deployment 2025 & 2033
- Figure 19: Europe Data Resiliency Industry Revenue (Million), by End-user Vertical 2025 & 2033
- Figure 20: Europe Data Resiliency Industry Volume (K Unit), by End-user Vertical 2025 & 2033
- Figure 21: Europe Data Resiliency Industry Revenue Share (%), by End-user Vertical 2025 & 2033
- Figure 22: Europe Data Resiliency Industry Volume Share (%), by End-user Vertical 2025 & 2033
- Figure 23: Europe Data Resiliency Industry Revenue (Million), by Country 2025 & 2033
- Figure 24: Europe Data Resiliency Industry Volume (K Unit), by Country 2025 & 2033
- Figure 25: Europe Data Resiliency Industry Revenue Share (%), by Country 2025 & 2033
- Figure 26: Europe Data Resiliency Industry Volume Share (%), by Country 2025 & 2033
- Figure 27: Asia Pacific Data Resiliency Industry Revenue (Million), by Deployment 2025 & 2033
- Figure 28: Asia Pacific Data Resiliency Industry Volume (K Unit), by Deployment 2025 & 2033
- Figure 29: Asia Pacific Data Resiliency Industry Revenue Share (%), by Deployment 2025 & 2033
- Figure 30: Asia Pacific Data Resiliency Industry Volume Share (%), by Deployment 2025 & 2033
- Figure 31: Asia Pacific Data Resiliency Industry Revenue (Million), by End-user Vertical 2025 & 2033
- Figure 32: Asia Pacific Data Resiliency Industry Volume (K Unit), by End-user Vertical 2025 & 2033
- Figure 33: Asia Pacific Data Resiliency Industry Revenue Share (%), by End-user Vertical 2025 & 2033
- Figure 34: Asia Pacific Data Resiliency Industry Volume Share (%), by End-user Vertical 2025 & 2033
- Figure 35: Asia Pacific Data Resiliency Industry Revenue (Million), by Country 2025 & 2033
- Figure 36: Asia Pacific Data Resiliency Industry Volume (K Unit), by Country 2025 & 2033
- Figure 37: Asia Pacific Data Resiliency Industry Revenue Share (%), by Country 2025 & 2033
- Figure 38: Asia Pacific Data Resiliency Industry Volume Share (%), by Country 2025 & 2033
- Figure 39: Latin America Data Resiliency Industry Revenue (Million), by Deployment 2025 & 2033
- Figure 40: Latin America Data Resiliency Industry Volume (K Unit), by Deployment 2025 & 2033
- Figure 41: Latin America Data Resiliency Industry Revenue Share (%), by Deployment 2025 & 2033
- Figure 42: Latin America Data Resiliency Industry Volume Share (%), by Deployment 2025 & 2033
- Figure 43: Latin America Data Resiliency Industry Revenue (Million), by End-user Vertical 2025 & 2033
- Figure 44: Latin America Data Resiliency Industry Volume (K Unit), by End-user Vertical 2025 & 2033
- Figure 45: Latin America Data Resiliency Industry Revenue Share (%), by End-user Vertical 2025 & 2033
- Figure 46: Latin America Data Resiliency Industry Volume Share (%), by End-user Vertical 2025 & 2033
- Figure 47: Latin America Data Resiliency Industry Revenue (Million), by Country 2025 & 2033
- Figure 48: Latin America Data Resiliency Industry Volume (K Unit), by Country 2025 & 2033
- Figure 49: Latin America Data Resiliency Industry Revenue Share (%), by Country 2025 & 2033
- Figure 50: Latin America Data Resiliency Industry Volume Share (%), by Country 2025 & 2033
- Figure 51: Middle East Data Resiliency Industry Revenue (Million), by Deployment 2025 & 2033
- Figure 52: Middle East Data Resiliency Industry Volume (K Unit), by Deployment 2025 & 2033
- Figure 53: Middle East Data Resiliency Industry Revenue Share (%), by Deployment 2025 & 2033
- Figure 54: Middle East Data Resiliency Industry Volume Share (%), by Deployment 2025 & 2033
- Figure 55: Middle East Data Resiliency Industry Revenue (Million), by End-user Vertical 2025 & 2033
- Figure 56: Middle East Data Resiliency Industry Volume (K Unit), by End-user Vertical 2025 & 2033
- Figure 57: Middle East Data Resiliency Industry Revenue Share (%), by End-user Vertical 2025 & 2033
- Figure 58: Middle East Data Resiliency Industry Volume Share (%), by End-user Vertical 2025 & 2033
- Figure 59: Middle East Data Resiliency Industry Revenue (Million), by Country 2025 & 2033
- Figure 60: Middle East Data Resiliency Industry Volume (K Unit), by Country 2025 & 2033
- Figure 61: Middle East Data Resiliency Industry Revenue Share (%), by Country 2025 & 2033
- Figure 62: Middle East Data Resiliency Industry Volume Share (%), by Country 2025 & 2033
List of Tables
- Table 1: Global Data Resiliency Industry Revenue Million Forecast, by Deployment 2020 & 2033
- Table 2: Global Data Resiliency Industry Volume K Unit Forecast, by Deployment 2020 & 2033
- Table 3: Global Data Resiliency Industry Revenue Million Forecast, by End-user Vertical 2020 & 2033
- Table 4: Global Data Resiliency Industry Volume K Unit Forecast, by End-user Vertical 2020 & 2033
- Table 5: Global Data Resiliency Industry Revenue Million Forecast, by Region 2020 & 2033
- Table 6: Global Data Resiliency Industry Volume K Unit Forecast, by Region 2020 & 2033
- Table 7: Global Data Resiliency Industry Revenue Million Forecast, by Deployment 2020 & 2033
- Table 8: Global Data Resiliency Industry Volume K Unit Forecast, by Deployment 2020 & 2033
- Table 9: Global Data Resiliency Industry Revenue Million Forecast, by End-user Vertical 2020 & 2033
- Table 10: Global Data Resiliency Industry Volume K Unit Forecast, by End-user Vertical 2020 & 2033
- Table 11: Global Data Resiliency Industry Revenue Million Forecast, by Country 2020 & 2033
- Table 12: Global Data Resiliency Industry Volume K Unit Forecast, by Country 2020 & 2033
- Table 13: Global Data Resiliency Industry Revenue Million Forecast, by Deployment 2020 & 2033
- Table 14: Global Data Resiliency Industry Volume K Unit Forecast, by Deployment 2020 & 2033
- Table 15: Global Data Resiliency Industry Revenue Million Forecast, by End-user Vertical 2020 & 2033
- Table 16: Global Data Resiliency Industry Volume K Unit Forecast, by End-user Vertical 2020 & 2033
- Table 17: Global Data Resiliency Industry Revenue Million Forecast, by Country 2020 & 2033
- Table 18: Global Data Resiliency Industry Volume K Unit Forecast, by Country 2020 & 2033
- Table 19: Global Data Resiliency Industry Revenue Million Forecast, by Deployment 2020 & 2033
- Table 20: Global Data Resiliency Industry Volume K Unit Forecast, by Deployment 2020 & 2033
- Table 21: Global Data Resiliency Industry Revenue Million Forecast, by End-user Vertical 2020 & 2033
- Table 22: Global Data Resiliency Industry Volume K Unit Forecast, by End-user Vertical 2020 & 2033
- Table 23: Global Data Resiliency Industry Revenue Million Forecast, by Country 2020 & 2033
- Table 24: Global Data Resiliency Industry Volume K Unit Forecast, by Country 2020 & 2033
- Table 25: Global Data Resiliency Industry Revenue Million Forecast, by Deployment 2020 & 2033
- Table 26: Global Data Resiliency Industry Volume K Unit Forecast, by Deployment 2020 & 2033
- Table 27: Global Data Resiliency Industry Revenue Million Forecast, by End-user Vertical 2020 & 2033
- Table 28: Global Data Resiliency Industry Volume K Unit Forecast, by End-user Vertical 2020 & 2033
- Table 29: Global Data Resiliency Industry Revenue Million Forecast, by Country 2020 & 2033
- Table 30: Global Data Resiliency Industry Volume K Unit Forecast, by Country 2020 & 2033
- Table 31: Global Data Resiliency Industry Revenue Million Forecast, by Deployment 2020 & 2033
- Table 32: Global Data Resiliency Industry Volume K Unit Forecast, by Deployment 2020 & 2033
- Table 33: Global Data Resiliency Industry Revenue Million Forecast, by End-user Vertical 2020 & 2033
- Table 34: Global Data Resiliency Industry Volume K Unit Forecast, by End-user Vertical 2020 & 2033
- Table 35: Global Data Resiliency Industry Revenue Million Forecast, by Country 2020 & 2033
- Table 36: Global Data Resiliency Industry Volume K Unit Forecast, by Country 2020 & 2033
Frequently Asked Questions
1. What is the projected Compound Annual Growth Rate (CAGR) of the Data Resiliency Industry?
The projected CAGR is approximately 15.38%.
2. Which companies are prominent players in the Data Resiliency Industry?
Key companies in the market include IBM Corporation, Asigra Inc, CenturyLink Inc, VMware Inc (Dell Technologies Inc ), Veritas Technologies LLC, Microsoft Corporation, NetApp Inc, Carbonite Inc (OpenText Corporation), Acronis International GmbH, Micro Focus International plc, Commvault Systems Inc.
3. What are the main segments of the Data Resiliency Industry?
The market segments include Deployment, End-user Vertical.
4. Can you provide details about the market size?
The market size is estimated to be USD 18.65 Million as of 2022.
5. What are some drivers contributing to market growth?
; Rapid Growth in Data being Generated from Multiple Sources; Increasing Privacy Concerns and Rising Need for Data Security.
6. What are the notable trends driving market growth?
BFSI Segment is Expected to Witness Significant Growth.
7. Are there any restraints impacting market growth?
; Availability of open-source alternatives.
8. Can you provide examples of recent developments in the market?
N/A
9. What pricing options are available for accessing the report?
Pricing options include single-user, multi-user, and enterprise licenses priced at USD 4750, USD 5250, and USD 8750 respectively.
10. Is the market size provided in terms of value or volume?
The market size is provided in terms of value, measured in Million and volume, measured in K Unit.
11. Are there any specific market keywords associated with the report?
Yes, the market keyword associated with the report is "Data Resiliency Industry," which aids in identifying and referencing the specific market segment covered.
12. How do I determine which pricing option suits my needs best?
The pricing options vary based on user requirements and access needs. Individual users may opt for single-user licenses, while businesses requiring broader access may choose multi-user or enterprise licenses for cost-effective access to the report.
13. Are there any additional resources or data provided in the Data Resiliency Industry report?
While the report offers comprehensive insights, it's advisable to review the specific contents or supplementary materials provided to ascertain if additional resources or data are available.
14. How can I stay updated on further developments or reports in the Data Resiliency Industry?
To stay informed about further developments, trends, and reports in the Data Resiliency Industry, consider subscribing to industry newsletters, following relevant companies and organizations, or regularly checking reputable industry news sources and publications.
Methodology
Step 1 - Identification of Relevant Samples Size from Population Database


Step 2 - Approaches for Defining Global Market Size (Value, Volume* & Price*)

Note*: In applicable scenarios
Step 3 - Data Sources
Primary Research
- Web Analytics
- Survey Reports
- Research Institute
- Latest Research Reports
- Opinion Leaders
Secondary Research
- Annual Reports
- White Paper
- Latest Press Release
- Industry Association
- Paid Database
- Investor Presentations

Step 4 - Data Triangulation
Involves using different sources of information in order to increase the validity of a study
These sources are likely to be stakeholders in a program - participants, other researchers, program staff, other community members, and so on.
Then we put all data in single framework & apply various statistical tools to find out the dynamic on the market.
During the analysis stage, feedback from the stakeholder groups would be compared to determine areas of agreement as well as areas of divergence