

Key Insights
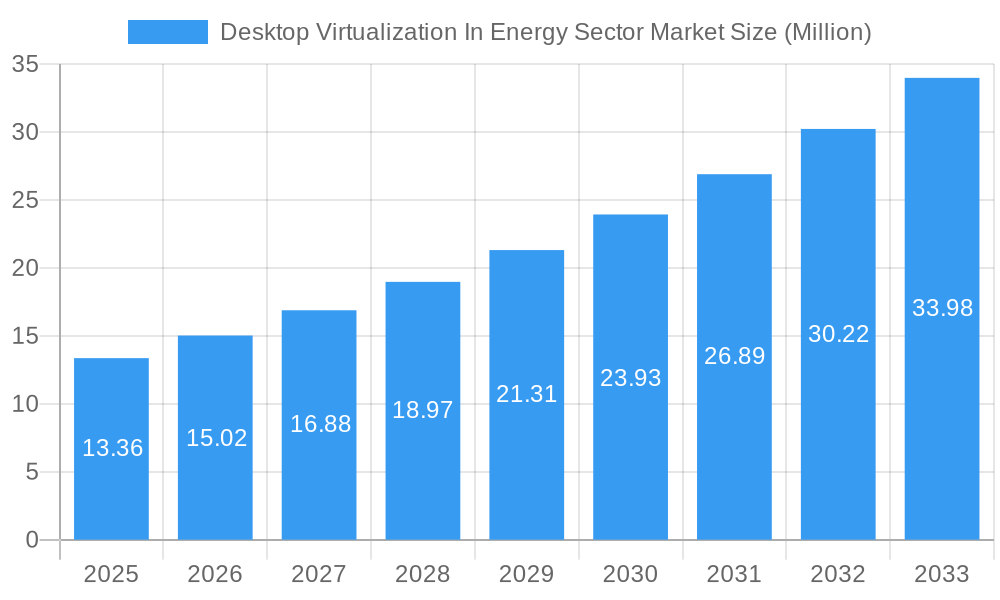
The Desktop Virtualization in the Energy Sector Market is poised for significant expansion, projected to reach $13.36 Million by 2025, demonstrating a robust Compound Annual Growth Rate (CAGR) of 12.43% over the forecast period of 2025-2033. This substantial growth is fueled by critical drivers such as the increasing need for enhanced cybersecurity and data protection within the energy industry, coupled with the imperative for operational efficiency and cost reduction. Energy companies are increasingly adopting desktop virtualization solutions to secure sensitive operational technology (OT) and information technology (IT) environments, safeguarding against cyber threats and ensuring business continuity. Furthermore, the push towards remote work capabilities and the desire to streamline IT infrastructure management are compelling energy firms to invest in scalable and flexible virtual desktop solutions.
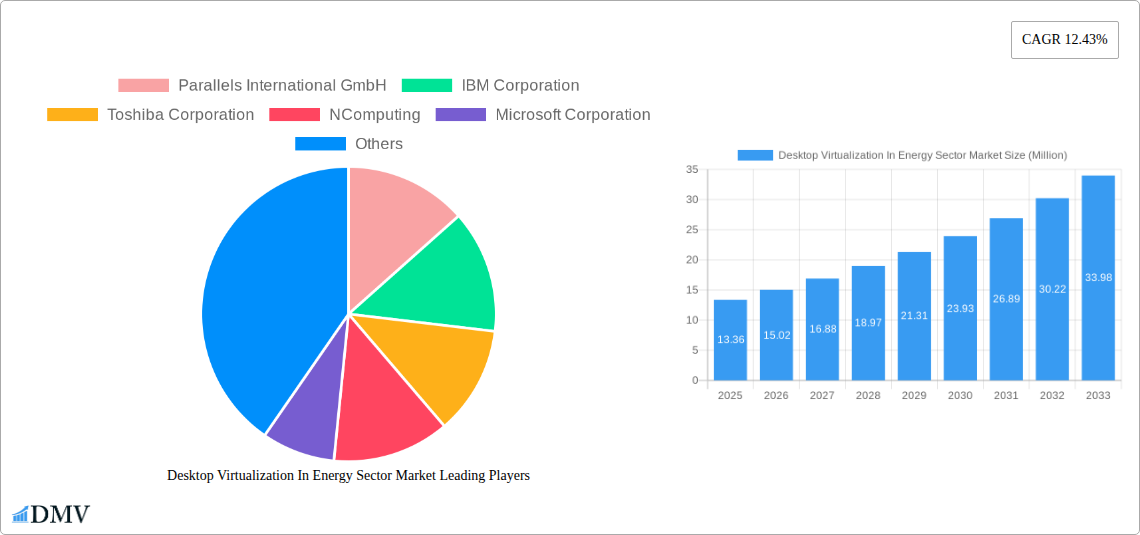
Desktop Virtualization In Energy Sector Market Market Size (In Million)
The market landscape is characterized by key trends including the growing adoption of cloud-based desktop virtualization, offering greater scalability and accessibility for geographically dispersed energy operations. Hosted Virtual Desktops (HVD) are gaining prominence due to their ability to provide dedicated virtual environments, enhancing security and performance for critical applications. Conversely, restraints such as the initial high implementation costs and the complexity of integrating virtual desktop infrastructure with legacy energy systems present challenges. However, the strategic advantages of improved disaster recovery, centralized management, and enhanced collaboration are expected to outweigh these limitations, driving widespread adoption across various energy segments, including oil and gas, utilities, and renewable energy. Key players like Microsoft, Citrix Systems, and VMware are actively innovating to address these market demands.
Desktop Virtualization In Energy Sector Market Company Market Share
This comprehensive report delves deep into the dynamic Desktop Virtualization in Energy Sector Market, offering critical insights and a robust forecast for the period 2019–2033. Fueled by the escalating need for secure, flexible, and efficient IT infrastructure, the energy sector is increasingly adopting desktop virtualization solutions. This report analyzes market composition, industry evolution, leading regions, product innovations, growth drivers, obstacles, future opportunities, major players, key developments, and strategic forecasts, providing stakeholders with actionable intelligence to navigate this evolving landscape. The energy sector IT market is witnessing significant transformation, with virtual desktop infrastructure (VDI) emerging as a cornerstone for operational resilience and enhanced productivity.
Desktop Virtualization In Energy Sector Market Market Composition & Trends
The Desktop Virtualization in Energy Sector Market is characterized by a moderately concentrated landscape, driven by key players investing heavily in innovation and strategic partnerships. Innovation catalysts include the demand for enhanced cybersecurity in critical infrastructure, the need for remote work enablement, and the increasing adoption of cloud-based solutions. The regulatory landscape plays a crucial role, with stringent data protection and operational security mandates influencing technology adoption. Substitute products, such as traditional physical desktops and basic remote access solutions, are facing pressure from the comprehensive benefits offered by VDI. End-user profiles within the energy sector range from exploration and production companies to utilities and renewable energy providers, each with unique IT requirements. Merger and acquisition (M&A) activities are a significant trend, with companies seeking to expand their market reach and technological capabilities. M&A deal values in the past year are estimated to be in the range of $500 Million to $1 Billion. The market share distribution is closely tied to the adoption rates of different desktop delivery platforms, with Hosted Virtual Desktop (HVD) and Hosted Shared Desktop (HSD) solutions seeing varied uptake based on specific energy sub-sectors and their infrastructure needs.
Desktop Virtualization In Energy Sector Market Industry Evolution
The evolution of the Desktop Virtualization in Energy Sector Market is a testament to the sector's digital transformation journey. Over the historical period (2019–2024), the market has witnessed a steady upward trajectory, driven by the inherent benefits of desktop virtualization, including centralized management, enhanced security, and improved disaster recovery capabilities. The base year, 2025, marks a pivotal point, with the market poised for accelerated growth. Virtual Desktop Infrastructure (VDI) adoption has been significantly propelled by the need for secure remote access for field engineers and operational staff, particularly in the wake of global events that necessitated flexible work arrangements. Technological advancements, such as the development of more efficient hypervisors, improved graphics virtualization, and the increasing integration of AI for predictive maintenance and operational optimization, have further enhanced the appeal of VDI. Shifting consumer demands, interpreted here as the evolving expectations of energy sector employees for seamless and secure access to their work environments regardless of location, have also been a major catalyst. Growth rates in the historical period averaged around 8-10% annually, with adoption metrics indicating a rise from approximately 25% of the total IT infrastructure in 2019 to an estimated 40% by the end of 2024. The forecast period (2025–2033) is expected to see continued robust expansion, with projected Compound Annual Growth Rates (CAGR) of 12-15%, driven by further technological maturation and increasing awareness of VDI's strategic advantages in securing critical energy infrastructure. The transition from on-premise deployments to cloud-based VDI solutions is also a significant trend shaping the industry's evolution, offering scalability and cost-efficiency.
Leading Regions, Countries, or Segments in Desktop Virtualization In Energy Sector Market
North America currently dominates the Desktop Virtualization in Energy Sector Market, driven by substantial investments in oil and gas, significant advancements in renewable energy, and a strong regulatory push for cybersecurity in critical infrastructure. The United States, in particular, represents a major market due to the presence of large energy corporations and a mature IT service provider ecosystem.
Key Drivers of Dominance in North America:
- Robust Investment in Renewable Energy: Countries like the United States and Canada are heavily investing in renewable energy projects, which require sophisticated IT solutions for monitoring, control, and data management. Desktop virtualization offers the necessary flexibility and security for these distributed operations.
- Advanced Oil and Gas Infrastructure: The mature oil and gas sector in North America has long embraced technological solutions to enhance operational efficiency and safety. VDI facilitates remote access to specialized applications and real-time data for engineers and geoscientists, even in remote or hazardous locations.
- Strict Regulatory Frameworks: Stringent cybersecurity regulations and mandates for critical infrastructure protection in the US and Canada necessitate highly secure IT environments. Desktop virtualization provides a centralized and controlled approach to data security, reducing the attack surface.
- Technological Adoption and Innovation: North America is at the forefront of technological innovation, with a high adoption rate of cloud computing, AI, and IoT solutions that integrate seamlessly with VDI.
Within the Desktop Delivery Platform segment, Hosted Virtual Desktop (HVD) solutions are experiencing significant traction due to their superior security and management capabilities, particularly for sensitive operational data. Hosted Shared Desktop (HSD) also holds a considerable share, offering a cost-effective solution for general office productivity. In terms of Deployment Mode, the shift towards Cloud-based VDI is a prominent trend, offering scalability, reduced upfront capital expenditure, and faster deployment. However, On-Premise solutions remain relevant for organizations with specific data sovereignty requirements or existing significant on-premise infrastructure investments. The interplay between these segments and deployment modes dictates regional adoption patterns, with North America excelling in hybrid and cloud-first strategies for VDI.
Desktop Virtualization In Energy Sector Market Product Innovations
Product innovations in desktop virtualization for the energy sector are focused on enhancing security, performance, and user experience. Leading providers are developing specialized solutions that cater to the unique demands of energy operations, such as high-performance graphics for CAD/CAM applications used in engineering and design, and robust security features for protecting sensitive operational technology (OT) data. Advancements in AI and machine learning are being integrated to optimize resource allocation, predict system failures, and automate routine IT tasks, thereby improving overall operational efficiency. The development of secure, lightweight clients for remote access and the seamless integration with IoT devices for real-time data monitoring are also key areas of innovation, ensuring energy professionals have secure and reliable access to critical information from any location.
Propelling Factors for Desktop Virtualization In Energy Sector Market Growth
The Desktop Virtualization in Energy Sector Market is propelled by several key factors. Firstly, the escalating demand for enhanced cybersecurity to protect critical energy infrastructure from sophisticated threats is a primary driver. Secondly, the growing need for remote work enablement and flexible access to applications and data for a distributed workforce, including field engineers and remote operators, is crucial. Thirdly, the digital transformation initiatives across the energy value chain, aiming to improve operational efficiency and data-driven decision-making, are strongly supported by VDI. Finally, the cost-effectiveness and scalability offered by cloud-based VDI solutions, coupled with the increasing adoption of IoT and AI in the sector, further stimulate market growth.
Obstacles in the Desktop Virtualization In Energy Sector Market Market
Despite the growth, the Desktop Virtualization in Energy Sector Market faces several obstacles. High initial implementation costs and the complexity of integrating VDI with legacy operational technology (OT) systems can be a significant barrier for some energy companies. Concerns regarding performance for graphics-intensive applications and latency issues in remote or low-bandwidth environments continue to be a challenge. Furthermore, regulatory compliance complexities related to data residency and security standards in different regions require careful navigation. A shortage of skilled IT professionals with expertise in VDI deployment and management within the energy sector can also hinder adoption rates.
Future Opportunities in Desktop Virtualization In Energy Sector Market
Emerging opportunities in the Desktop Virtualization in Energy Sector Market lie in the increasing adoption of edge computing solutions, enabling localized data processing and reducing reliance on centralized cloud infrastructure for real-time operations. The growing emphasis on sustainability and renewable energy will create new demand for secure, scalable VDI solutions to manage distributed renewable assets. Furthermore, the development of more advanced AI-powered VDI management tools will streamline operations and enhance predictive capabilities. The expansion of VDI into specialized areas like predictive maintenance for grid infrastructure and the integration with augmented reality (AR) for remote assistance present significant growth avenues.
Major Players in the Desktop Virtualization In Energy Sector Market Ecosystem
- Parallels International GmbH
- IBM Corporation
- Toshiba Corporation
- NComputing
- Microsoft Corporation
- Dell Inc
- Huawei Technologies Co Ltd
- Ericom Software Inc
- Citrix Systems Inc
- Vmware Inc
Key Developments in Desktop Virtualization In Energy Sector Market Industry
- September 2022: Amazon Web Services Inc. updated Amazon Workspaces, a desktop virtualization suite, with new features that enable customers to use Workspaces Core along with an upgrade that would make it feasible to host virtual desktops powered by the Ubuntu operating system on its cloud platform.
- May 2022: Citrix Systems, Inc. announced that it is working with Microsoft on an upcoming offering that combines Citrix's market-leading high-definition user experience (HDX) technology, ecosystem flexibility with Windows 365, robust IT policy control, the global first Cloud PC, providing IT administrators streamlined Citrix employees, a seamless switch to Citrix users through Microsoft Endpoint Manager and windows365.microsoft.com.
Strategic Desktop Virtualization In Energy Sector Market Market Forecast
The strategic forecast for the Desktop Virtualization in Energy Sector Market indicates robust growth driven by escalating cybersecurity imperatives and the ongoing digital transformation within the energy industry. The increasing adoption of cloud-based solutions, coupled with advancements in AI and edge computing, will unlock new operational efficiencies and enhance resilience. The market's potential is further amplified by the global transition towards renewable energy sources, demanding sophisticated IT infrastructure for managing distributed assets. Stakeholders can anticipate continued innovation in specialized VDI solutions tailored for the unique challenges of energy operations, leading to significant market expansion over the forecast period, with an estimated market size of $XX Billion by 2033.
Desktop Virtualization In Energy Sector Market Segmentation
-
1. Desktop Delivery Platform
- 1.1. Hosted Virtual Desktop (HVD)
- 1.2. Hosted Shared Desktop (HSD)
-
2. Deployment Mode
- 2.1. On-Premise
- 2.2. Cloud
Desktop Virtualization In Energy Sector Market Segmentation By Geography
- 1. North America
- 2. Europe
- 3. Asia
- 4. Australia and New Zealand
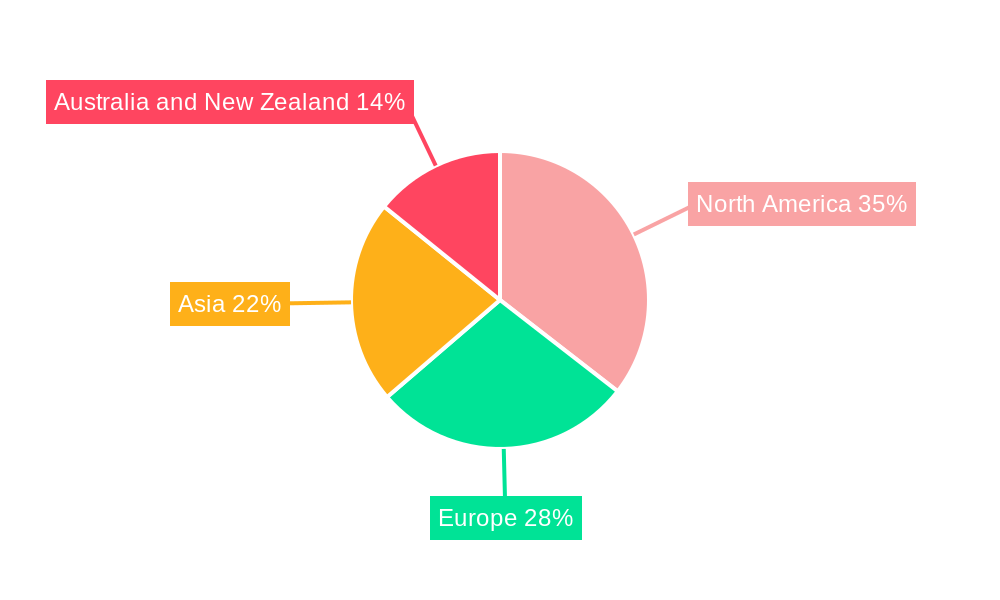
Desktop Virtualization In Energy Sector Market Regional Market Share
Geographic Coverage of Desktop Virtualization In Energy Sector Market
Desktop Virtualization In Energy Sector Market REPORT HIGHLIGHTS
| Aspects | Details |
|---|---|
| Study Period | 2020-2034 |
| Base Year | 2025 |
| Estimated Year | 2026 |
| Forecast Period | 2026-2034 |
| Historical Period | 2020-2025 |
| Growth Rate | CAGR of 12.43% from 2020-2034 |
| Segmentation |
|
Table of Contents
- 1. Introduction
- 1.1. Research Scope
- 1.2. Market Segmentation
- 1.3. Research Methodology
- 1.4. Definitions and Assumptions
- 2. Executive Summary
- 2.1. Introduction
- 3. Market Dynamics
- 3.1. Introduction
- 3.2. Market Drivers
- 3.2.1. Growing Adoption of Cloud and Need for Remote Accessibility is Driving the Market Growth
- 3.3. Market Restrains
- 3.3.1. Infrastructural Constraints is Discouraging the Market Expansion
- 3.4. Market Trends
- 3.4.1. Cloud Deployment Mode Segment is Expected to Hold Significant Market Share
- 4. Market Factor Analysis
- 4.1. Porters Five Forces
- 4.2. Supply/Value Chain
- 4.3. PESTEL analysis
- 4.4. Market Entropy
- 4.5. Patent/Trademark Analysis
- 5. Global Desktop Virtualization In Energy Sector Market Analysis, Insights and Forecast, 2020-2032
- 5.1. Market Analysis, Insights and Forecast - by Desktop Delivery Platform
- 5.1.1. Hosted Virtual Desktop (HVD)
- 5.1.2. Hosted Shared Desktop (HSD)
- 5.2. Market Analysis, Insights and Forecast - by Deployment Mode
- 5.2.1. On-Premise
- 5.2.2. Cloud
- 5.3. Market Analysis, Insights and Forecast - by Region
- 5.3.1. North America
- 5.3.2. Europe
- 5.3.3. Asia
- 5.3.4. Australia and New Zealand
- 5.1. Market Analysis, Insights and Forecast - by Desktop Delivery Platform
- 6. North America Desktop Virtualization In Energy Sector Market Analysis, Insights and Forecast, 2020-2032
- 6.1. Market Analysis, Insights and Forecast - by Desktop Delivery Platform
- 6.1.1. Hosted Virtual Desktop (HVD)
- 6.1.2. Hosted Shared Desktop (HSD)
- 6.2. Market Analysis, Insights and Forecast - by Deployment Mode
- 6.2.1. On-Premise
- 6.2.2. Cloud
- 6.1. Market Analysis, Insights and Forecast - by Desktop Delivery Platform
- 7. Europe Desktop Virtualization In Energy Sector Market Analysis, Insights and Forecast, 2020-2032
- 7.1. Market Analysis, Insights and Forecast - by Desktop Delivery Platform
- 7.1.1. Hosted Virtual Desktop (HVD)
- 7.1.2. Hosted Shared Desktop (HSD)
- 7.2. Market Analysis, Insights and Forecast - by Deployment Mode
- 7.2.1. On-Premise
- 7.2.2. Cloud
- 7.1. Market Analysis, Insights and Forecast - by Desktop Delivery Platform
- 8. Asia Desktop Virtualization In Energy Sector Market Analysis, Insights and Forecast, 2020-2032
- 8.1. Market Analysis, Insights and Forecast - by Desktop Delivery Platform
- 8.1.1. Hosted Virtual Desktop (HVD)
- 8.1.2. Hosted Shared Desktop (HSD)
- 8.2. Market Analysis, Insights and Forecast - by Deployment Mode
- 8.2.1. On-Premise
- 8.2.2. Cloud
- 8.1. Market Analysis, Insights and Forecast - by Desktop Delivery Platform
- 9. Australia and New Zealand Desktop Virtualization In Energy Sector Market Analysis, Insights and Forecast, 2020-2032
- 9.1. Market Analysis, Insights and Forecast - by Desktop Delivery Platform
- 9.1.1. Hosted Virtual Desktop (HVD)
- 9.1.2. Hosted Shared Desktop (HSD)
- 9.2. Market Analysis, Insights and Forecast - by Deployment Mode
- 9.2.1. On-Premise
- 9.2.2. Cloud
- 9.1. Market Analysis, Insights and Forecast - by Desktop Delivery Platform
- 10. Competitive Analysis
- 10.1. Global Market Share Analysis 2025
- 10.2. Company Profiles
- 10.2.1 Parallels International GmbH
- 10.2.1.1. Overview
- 10.2.1.2. Products
- 10.2.1.3. SWOT Analysis
- 10.2.1.4. Recent Developments
- 10.2.1.5. Financials (Based on Availability)
- 10.2.2 IBM Corporation
- 10.2.2.1. Overview
- 10.2.2.2. Products
- 10.2.2.3. SWOT Analysis
- 10.2.2.4. Recent Developments
- 10.2.2.5. Financials (Based on Availability)
- 10.2.3 Toshiba Corporation
- 10.2.3.1. Overview
- 10.2.3.2. Products
- 10.2.3.3. SWOT Analysis
- 10.2.3.4. Recent Developments
- 10.2.3.5. Financials (Based on Availability)
- 10.2.4 NComputing
- 10.2.4.1. Overview
- 10.2.4.2. Products
- 10.2.4.3. SWOT Analysis
- 10.2.4.4. Recent Developments
- 10.2.4.5. Financials (Based on Availability)
- 10.2.5 Microsoft Corporation
- 10.2.5.1. Overview
- 10.2.5.2. Products
- 10.2.5.3. SWOT Analysis
- 10.2.5.4. Recent Developments
- 10.2.5.5. Financials (Based on Availability)
- 10.2.6 Dell Inc
- 10.2.6.1. Overview
- 10.2.6.2. Products
- 10.2.6.3. SWOT Analysis
- 10.2.6.4. Recent Developments
- 10.2.6.5. Financials (Based on Availability)
- 10.2.7 Huawei Technologies Co Ltd
- 10.2.7.1. Overview
- 10.2.7.2. Products
- 10.2.7.3. SWOT Analysis
- 10.2.7.4. Recent Developments
- 10.2.7.5. Financials (Based on Availability)
- 10.2.8 Ericom Software Inc
- 10.2.8.1. Overview
- 10.2.8.2. Products
- 10.2.8.3. SWOT Analysis
- 10.2.8.4. Recent Developments
- 10.2.8.5. Financials (Based on Availability)
- 10.2.9 Citrix Systems Inc
- 10.2.9.1. Overview
- 10.2.9.2. Products
- 10.2.9.3. SWOT Analysis
- 10.2.9.4. Recent Developments
- 10.2.9.5. Financials (Based on Availability)
- 10.2.10 Vmware Inc
- 10.2.10.1. Overview
- 10.2.10.2. Products
- 10.2.10.3. SWOT Analysis
- 10.2.10.4. Recent Developments
- 10.2.10.5. Financials (Based on Availability)
- 10.2.1 Parallels International GmbH
List of Figures
- Figure 1: Global Desktop Virtualization In Energy Sector Market Revenue Breakdown (Million, %) by Region 2025 & 2033
- Figure 2: North America Desktop Virtualization In Energy Sector Market Revenue (Million), by Desktop Delivery Platform 2025 & 2033
- Figure 3: North America Desktop Virtualization In Energy Sector Market Revenue Share (%), by Desktop Delivery Platform 2025 & 2033
- Figure 4: North America Desktop Virtualization In Energy Sector Market Revenue (Million), by Deployment Mode 2025 & 2033
- Figure 5: North America Desktop Virtualization In Energy Sector Market Revenue Share (%), by Deployment Mode 2025 & 2033
- Figure 6: North America Desktop Virtualization In Energy Sector Market Revenue (Million), by Country 2025 & 2033
- Figure 7: North America Desktop Virtualization In Energy Sector Market Revenue Share (%), by Country 2025 & 2033
- Figure 8: Europe Desktop Virtualization In Energy Sector Market Revenue (Million), by Desktop Delivery Platform 2025 & 2033
- Figure 9: Europe Desktop Virtualization In Energy Sector Market Revenue Share (%), by Desktop Delivery Platform 2025 & 2033
- Figure 10: Europe Desktop Virtualization In Energy Sector Market Revenue (Million), by Deployment Mode 2025 & 2033
- Figure 11: Europe Desktop Virtualization In Energy Sector Market Revenue Share (%), by Deployment Mode 2025 & 2033
- Figure 12: Europe Desktop Virtualization In Energy Sector Market Revenue (Million), by Country 2025 & 2033
- Figure 13: Europe Desktop Virtualization In Energy Sector Market Revenue Share (%), by Country 2025 & 2033
- Figure 14: Asia Desktop Virtualization In Energy Sector Market Revenue (Million), by Desktop Delivery Platform 2025 & 2033
- Figure 15: Asia Desktop Virtualization In Energy Sector Market Revenue Share (%), by Desktop Delivery Platform 2025 & 2033
- Figure 16: Asia Desktop Virtualization In Energy Sector Market Revenue (Million), by Deployment Mode 2025 & 2033
- Figure 17: Asia Desktop Virtualization In Energy Sector Market Revenue Share (%), by Deployment Mode 2025 & 2033
- Figure 18: Asia Desktop Virtualization In Energy Sector Market Revenue (Million), by Country 2025 & 2033
- Figure 19: Asia Desktop Virtualization In Energy Sector Market Revenue Share (%), by Country 2025 & 2033
- Figure 20: Australia and New Zealand Desktop Virtualization In Energy Sector Market Revenue (Million), by Desktop Delivery Platform 2025 & 2033
- Figure 21: Australia and New Zealand Desktop Virtualization In Energy Sector Market Revenue Share (%), by Desktop Delivery Platform 2025 & 2033
- Figure 22: Australia and New Zealand Desktop Virtualization In Energy Sector Market Revenue (Million), by Deployment Mode 2025 & 2033
- Figure 23: Australia and New Zealand Desktop Virtualization In Energy Sector Market Revenue Share (%), by Deployment Mode 2025 & 2033
- Figure 24: Australia and New Zealand Desktop Virtualization In Energy Sector Market Revenue (Million), by Country 2025 & 2033
- Figure 25: Australia and New Zealand Desktop Virtualization In Energy Sector Market Revenue Share (%), by Country 2025 & 2033
List of Tables
- Table 1: Global Desktop Virtualization In Energy Sector Market Revenue Million Forecast, by Desktop Delivery Platform 2020 & 2033
- Table 2: Global Desktop Virtualization In Energy Sector Market Revenue Million Forecast, by Deployment Mode 2020 & 2033
- Table 3: Global Desktop Virtualization In Energy Sector Market Revenue Million Forecast, by Region 2020 & 2033
- Table 4: Global Desktop Virtualization In Energy Sector Market Revenue Million Forecast, by Desktop Delivery Platform 2020 & 2033
- Table 5: Global Desktop Virtualization In Energy Sector Market Revenue Million Forecast, by Deployment Mode 2020 & 2033
- Table 6: Global Desktop Virtualization In Energy Sector Market Revenue Million Forecast, by Country 2020 & 2033
- Table 7: Global Desktop Virtualization In Energy Sector Market Revenue Million Forecast, by Desktop Delivery Platform 2020 & 2033
- Table 8: Global Desktop Virtualization In Energy Sector Market Revenue Million Forecast, by Deployment Mode 2020 & 2033
- Table 9: Global Desktop Virtualization In Energy Sector Market Revenue Million Forecast, by Country 2020 & 2033
- Table 10: Global Desktop Virtualization In Energy Sector Market Revenue Million Forecast, by Desktop Delivery Platform 2020 & 2033
- Table 11: Global Desktop Virtualization In Energy Sector Market Revenue Million Forecast, by Deployment Mode 2020 & 2033
- Table 12: Global Desktop Virtualization In Energy Sector Market Revenue Million Forecast, by Country 2020 & 2033
- Table 13: Global Desktop Virtualization In Energy Sector Market Revenue Million Forecast, by Desktop Delivery Platform 2020 & 2033
- Table 14: Global Desktop Virtualization In Energy Sector Market Revenue Million Forecast, by Deployment Mode 2020 & 2033
- Table 15: Global Desktop Virtualization In Energy Sector Market Revenue Million Forecast, by Country 2020 & 2033
Frequently Asked Questions
1. What is the projected Compound Annual Growth Rate (CAGR) of the Desktop Virtualization In Energy Sector Market?
The projected CAGR is approximately 12.43%.
2. Which companies are prominent players in the Desktop Virtualization In Energy Sector Market?
Key companies in the market include Parallels International GmbH, IBM Corporation, Toshiba Corporation, NComputing, Microsoft Corporation, Dell Inc, Huawei Technologies Co Ltd, Ericom Software Inc, Citrix Systems Inc, Vmware Inc .
3. What are the main segments of the Desktop Virtualization In Energy Sector Market?
The market segments include Desktop Delivery Platform, Deployment Mode.
4. Can you provide details about the market size?
The market size is estimated to be USD 13.36 Million as of 2022.
5. What are some drivers contributing to market growth?
Growing Adoption of Cloud and Need for Remote Accessibility is Driving the Market Growth.
6. What are the notable trends driving market growth?
Cloud Deployment Mode Segment is Expected to Hold Significant Market Share.
7. Are there any restraints impacting market growth?
Infrastructural Constraints is Discouraging the Market Expansion.
8. Can you provide examples of recent developments in the market?
September 2022: Amazon Web Services Inc. updated Amazon Workspaces, a desktop virtualization suite, with new features that enable customers to use Workspaces Core along with an upgrade that would make it feasible to host virtual desktops powered by the Ubuntu operating system on its cloud platform.
9. What pricing options are available for accessing the report?
Pricing options include single-user, multi-user, and enterprise licenses priced at USD 4750, USD 5250, and USD 8750 respectively.
10. Is the market size provided in terms of value or volume?
The market size is provided in terms of value, measured in Million.
11. Are there any specific market keywords associated with the report?
Yes, the market keyword associated with the report is "Desktop Virtualization In Energy Sector Market," which aids in identifying and referencing the specific market segment covered.
12. How do I determine which pricing option suits my needs best?
The pricing options vary based on user requirements and access needs. Individual users may opt for single-user licenses, while businesses requiring broader access may choose multi-user or enterprise licenses for cost-effective access to the report.
13. Are there any additional resources or data provided in the Desktop Virtualization In Energy Sector Market report?
While the report offers comprehensive insights, it's advisable to review the specific contents or supplementary materials provided to ascertain if additional resources or data are available.
14. How can I stay updated on further developments or reports in the Desktop Virtualization In Energy Sector Market?
To stay informed about further developments, trends, and reports in the Desktop Virtualization In Energy Sector Market, consider subscribing to industry newsletters, following relevant companies and organizations, or regularly checking reputable industry news sources and publications.
Methodology
Step 1 - Identification of Relevant Samples Size from Population Database


Step 2 - Approaches for Defining Global Market Size (Value, Volume* & Price*)

Note*: In applicable scenarios
Step 3 - Data Sources
Primary Research
- Web Analytics
- Survey Reports
- Research Institute
- Latest Research Reports
- Opinion Leaders
Secondary Research
- Annual Reports
- White Paper
- Latest Press Release
- Industry Association
- Paid Database
- Investor Presentations

Step 4 - Data Triangulation
Involves using different sources of information in order to increase the validity of a study
These sources are likely to be stakeholders in a program - participants, other researchers, program staff, other community members, and so on.
Then we put all data in single framework & apply various statistical tools to find out the dynamic on the market.
During the analysis stage, feedback from the stakeholder groups would be compared to determine areas of agreement as well as areas of divergence