

Key Insights
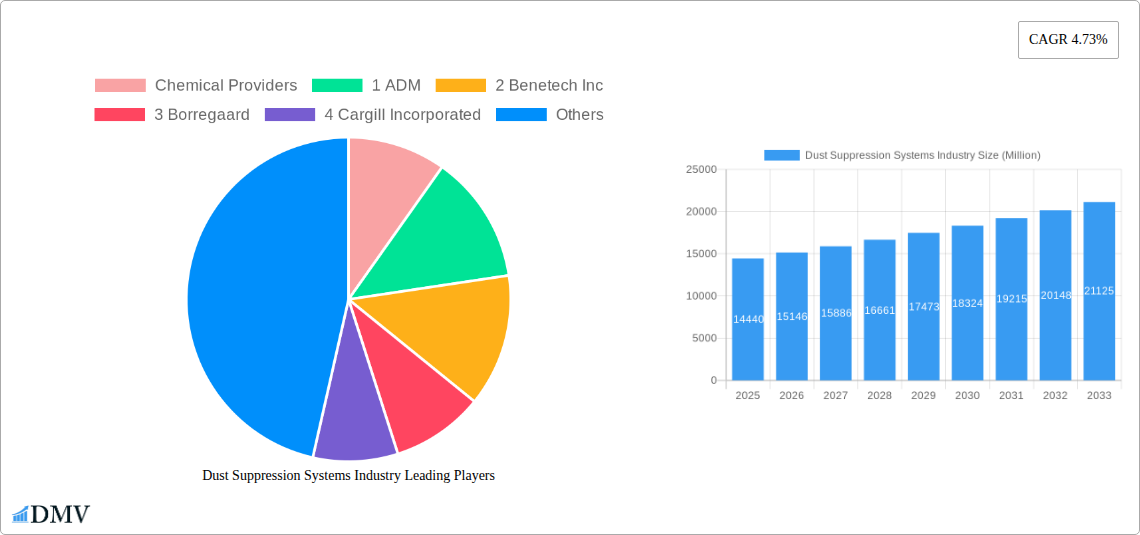
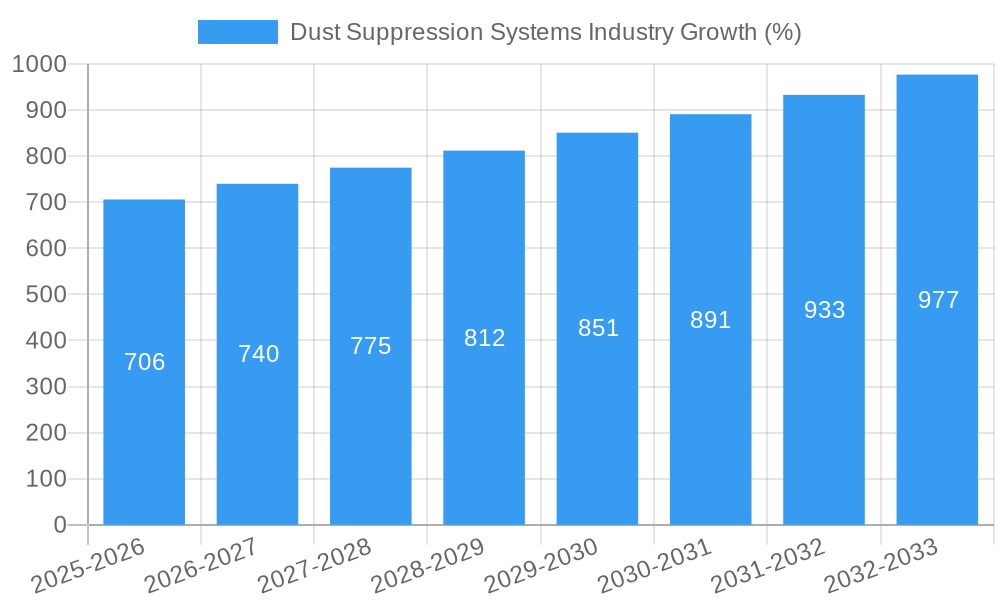
The global dust suppression systems market, valued at $14.44 billion in 2025, is projected to experience robust growth, driven by increasing industrialization, stringent environmental regulations, and a rising awareness of occupational health hazards associated with dust exposure. The Compound Annual Growth Rate (CAGR) of 4.73% from 2025 to 2033 indicates a steady expansion, fueled by the adoption of advanced dust suppression technologies across various sectors, including mining, construction, manufacturing, and agriculture. Key growth drivers include the increasing demand for efficient and environmentally friendly dust control solutions, coupled with technological advancements leading to more effective and cost-efficient systems. The market is segmented into chemical providers and system providers, with prominent players like ADM, Cargill, Evonik, and Ecolab (chemicals) and Donaldson, Nederman, and Camfil (systems) competing for market share. While challenges like high initial investment costs and maintenance requirements for certain systems exist, the long-term benefits of improved worker safety and environmental compliance are expected to outweigh these limitations, fostering continued market growth.
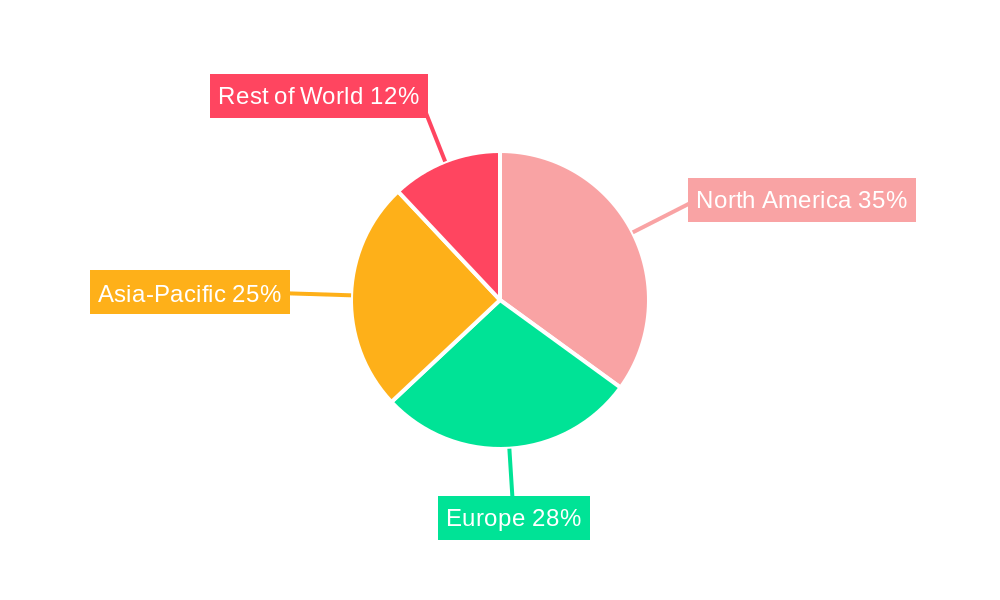
The market's growth is further influenced by regional variations in industrial activity and regulatory landscapes. While precise regional data is unavailable, it's reasonable to expect that regions with significant industrial activity and strict environmental standards, such as North America, Europe, and Asia-Pacific, will exhibit higher market penetration. Furthermore, the increasing adoption of smart technologies and data analytics for optimized dust suppression, along with the development of sustainable and eco-friendly solutions, is expected to shape future market trends. The forecast period of 2025-2033 presents a significant opportunity for market expansion as businesses and governments prioritize dust control measures to enhance productivity, protect worker health, and comply with environmental regulations. Innovation in areas like waterless dust suppression techniques and AI-driven monitoring systems will continue to propel market growth in the coming years.
Dust Suppression Systems Industry Market Report: 2019-2033
This comprehensive report provides an in-depth analysis of the Dust Suppression Systems industry, offering valuable insights for stakeholders seeking to understand market dynamics, growth opportunities, and competitive landscapes. The study period covers 2019-2033, with a base year of 2025 and a forecast period of 2025-2033. The market is projected to reach xx Million by 2033, representing a significant growth opportunity for investors and industry players.
Dust Suppression Systems Industry Market Composition & Trends
The Dust Suppression Systems market is characterized by a moderately concentrated landscape, with a few major players holding significant market share. However, the market exhibits considerable dynamism, driven by continuous innovation, stringent environmental regulations, and the increasing demand for efficient dust control solutions across diverse industries. Market share distribution amongst the leading players is currently estimated at xx%, with the top 5 players collectively holding xx% of the overall market value. The industry witnesses frequent M&A activities; in the past 5 years, the total value of deals closed is estimated at approximately xx Million. This activity reflects ongoing consolidation and the pursuit of technological advancements and expanded market reach.
- Market Concentration: Moderately concentrated, with xx% market share held by top 5 players.
- Innovation Catalysts: Stringent environmental regulations, technological advancements in dust suppression techniques, and increasing demand from various end-use sectors.
- Regulatory Landscape: Government regulations focusing on air quality and worker safety are major drivers.
- Substitute Products: Limited effective substitutes exist, making dust suppression systems essential for many industries.
- End-User Profiles: Mining, construction, manufacturing, agriculture, and food processing are key end-use sectors.
- M&A Activities: Significant M&A activity totaling approximately xx Million in the last five years.
Dust Suppression Systems Industry Industry Evolution
The Dust Suppression Systems industry has experienced substantial growth over the past five years (2019-2024), with a CAGR of xx%. This growth is primarily attributed to rising environmental concerns, increasing industrialization, and the adoption of advanced dust suppression technologies. Technological advancements, such as the introduction of more efficient and sustainable solutions (e.g., the DustBoss DB-45 Surge and Camfil’s Gold Series Timer), have significantly improved performance and reduced operational costs. Shifting consumer demands towards environmentally friendly and technologically advanced solutions are also shaping industry trends. The market is expected to maintain robust growth in the coming years, driven by ongoing investments in infrastructure projects and a continued focus on improving workplace safety and environmental sustainability. Adoption of advanced systems is estimated to increase by xx% annually over the forecast period.
Leading Regions, Countries, or Segments in Dust Suppression Systems Industry
North America currently holds the largest market share in the Dust Suppression Systems industry, primarily driven by robust infrastructure development, stringent environmental regulations, and the strong presence of major industry players. However, the Asia-Pacific region is projected to experience the fastest growth during the forecast period due to rapid industrialization, rising construction activities, and increasing awareness of environmental protection.
- Key Drivers for North America Dominance: Stringent environmental regulations, high adoption rates of advanced technologies, and significant investments in infrastructure development.
- Key Drivers for Asia-Pacific Growth: Rapid industrialization, significant investments in construction and infrastructure projects, and growing environmental awareness.
- Europe: Mature market with strong environmental regulations and a focus on sustainable solutions.
Dust Suppression Systems Industry Product Innovations
Recent product innovations focus on enhancing efficiency, reducing environmental impact, and improving ease of use. The introduction of smart controllers, such as Camfil's Gold Series Timer, streamlines operation and maintenance. Portable dust suppression systems, like the DustBoss DB-45 Surge, offer greater flexibility for various applications. These advancements demonstrate a clear trend towards technologically superior systems offering improved performance metrics such as higher dust suppression efficiency and reduced water consumption.
Propelling Factors for Dust Suppression Systems Industry Growth
Several factors are driving the growth of the dust suppression systems market. Stringent environmental regulations globally are mandating the adoption of dust control technologies across various industries. Simultaneously, increasing urbanization and industrialization are contributing to higher dust levels, necessitating effective dust suppression solutions. The development of innovative technologies like smart dust suppression systems with remote monitoring capabilities and improved efficiency further boosts market growth.
Obstacles in the Dust Suppression Systems Industry Market
High initial investment costs for advanced dust suppression systems can be a barrier to entry for smaller businesses. Supply chain disruptions, particularly concerning raw materials used in the manufacturing process, can impact production and lead to price increases. Furthermore, intense competition among established and emerging players can create price pressure and limit profitability. These obstacles can affect the market's overall growth trajectory if not appropriately addressed.
Future Opportunities in Dust Suppression Systems Industry
The market presents significant opportunities for growth in emerging economies like India and Southeast Asia, where industrialization is rapid. The development and adoption of sustainable and environmentally friendly dust suppression technologies are poised to drive market expansion. The integration of IoT and AI for remote monitoring and predictive maintenance will open new avenues for innovation and market differentiation.
Major Players in the Dust Suppression Systems Industry Ecosystem
- Chemical Providers:
- ADM
- Benetech Inc
- Borregaard
- Cargill Incorporated
- Chemtex Speciality Limited
- Evonik Industries AG
- GelTech Solutions
- Hexion
- Quaker Houghton (Quaker Chemical Corporation)
- Shaw Almex Industries Ltd
- SUEZ
- Ecolab
- System Providers:
- BossTek
- Camfil
- CW Machine Worx
- Donaldson Company Inc
- DSH Systems Ltd
- Duztech AB
- Nederman Holding AB
- SLY Inc
- The ACT Group
Key Developments in Dust Suppression Systems Industry Industry
- March 2024: Camfil Air Pollution Control (APC) launched the Gold Series Timer (GST), a new dust collection controller enhancing pulse-jet cleaning efficiency in various industrial dust collection systems.
- February 2023: BOSSTEK introduced the DustBoss DB-45 Surge, a portable dust suppression system with a pressurized center nozzle improving dust management in varied weather conditions.
Strategic Dust Suppression Systems Industry Market Forecast
The Dust Suppression Systems industry is poised for continued growth, driven by increasing environmental awareness, stringent regulations, and ongoing technological advancements. The market's future potential is substantial, with opportunities for expansion in diverse sectors and emerging markets. The focus on sustainable and technologically advanced solutions will further shape the industry's trajectory, leading to increased adoption and market penetration.
Dust Suppression Systems Industry Segmentation
-
1. Chemical Type
- 1.1. Lignin Sulfonate
- 1.2. Calcium Chloride
- 1.3. Magnesium Chloride
- 1.4. Asphalt Emulsions
- 1.5. Oil Emulsions
- 1.6. Polymeric Emulsions
- 1.7. Other Chemical Types
-
2. System Type
- 2.1. Dry Collection
- 2.2. Wet Suppression
-
3. End-user Industry
- 3.1. Mining
- 3.2. Construction
- 3.3. Food and Beverage
- 3.4. Oil and Gas and Petrochemical
- 3.5. Pharmaceutical
- 3.6. Other End-user Industries
Dust Suppression Systems Industry Segmentation By Geography
-
1. Asia Pacific
- 1.1. China
- 1.2. India
- 1.3. Japan
- 1.4. South Korea
- 1.5. Malaysia
- 1.6. Thailand
- 1.7. Indonesia
- 1.8. Vietnam
- 1.9. Rest of Asia Pacific
-
2. North America
- 2.1. United States
- 2.2. Canada
- 2.3. Mexico
-
3. Europe
- 3.1. Germany
- 3.2. United Kingdom
- 3.3. Italy
- 3.4. France
- 3.5. Italy
- 3.6. Spain
- 3.7. Nordic Countries
- 3.8. Turkey
- 3.9. Russia
- 3.10. Rest of Europe
-
4. South America
- 4.1. Brazil
- 4.2. Argentina
- 4.3. Colombia
- 4.4. Rest of South America
-
5. Middle East and Africa
- 5.1. Saudi Arabia
- 5.2. Qatar
- 5.3. United Arab Emirates
- 5.4. Nigeria
- 5.5. Egypt
- 5.6. South Africa
- 5.7. Rest of Middle East and Africa
Dust Suppression Systems Industry REPORT HIGHLIGHTS
| Aspects | Details |
|---|---|
| Study Period | 2019-2033 |
| Base Year | 2024 |
| Estimated Year | 2025 |
| Forecast Period | 2025-2033 |
| Historical Period | 2019-2024 |
| Growth Rate | CAGR of 4.73% from 2019-2033 |
| Segmentation |
|
Table of Contents
- 1. Introduction
- 1.1. Research Scope
- 1.2. Market Segmentation
- 1.3. Research Methodology
- 1.4. Definitions and Assumptions
- 2. Executive Summary
- 2.1. Introduction
- 3. Market Dynamics
- 3.1. Introduction
- 3.2. Market Drivers
- 3.2.1. Growth in Construction and Infrastructure in Asia-Pacific; Increase in Regulatory Compliances; Other Drivers
- 3.3. Market Restrains
- 3.3.1. Growth in Construction and Infrastructure in Asia-Pacific; Increase in Regulatory Compliances; Other Drivers
- 3.4. Market Trends
- 3.4.1. Construction Industry to Dominate the Market
- 4. Market Factor Analysis
- 4.1. Porters Five Forces
- 4.2. Supply/Value Chain
- 4.3. PESTEL analysis
- 4.4. Market Entropy
- 4.5. Patent/Trademark Analysis
- 5. Global Dust Suppression Systems Industry Analysis, Insights and Forecast, 2019-2031
- 5.1. Market Analysis, Insights and Forecast - by Chemical Type
- 5.1.1. Lignin Sulfonate
- 5.1.2. Calcium Chloride
- 5.1.3. Magnesium Chloride
- 5.1.4. Asphalt Emulsions
- 5.1.5. Oil Emulsions
- 5.1.6. Polymeric Emulsions
- 5.1.7. Other Chemical Types
- 5.2. Market Analysis, Insights and Forecast - by System Type
- 5.2.1. Dry Collection
- 5.2.2. Wet Suppression
- 5.3. Market Analysis, Insights and Forecast - by End-user Industry
- 5.3.1. Mining
- 5.3.2. Construction
- 5.3.3. Food and Beverage
- 5.3.4. Oil and Gas and Petrochemical
- 5.3.5. Pharmaceutical
- 5.3.6. Other End-user Industries
- 5.4. Market Analysis, Insights and Forecast - by Region
- 5.4.1. Asia Pacific
- 5.4.2. North America
- 5.4.3. Europe
- 5.4.4. South America
- 5.4.5. Middle East and Africa
- 5.1. Market Analysis, Insights and Forecast - by Chemical Type
- 6. Asia Pacific Dust Suppression Systems Industry Analysis, Insights and Forecast, 2019-2031
- 6.1. Market Analysis, Insights and Forecast - by Chemical Type
- 6.1.1. Lignin Sulfonate
- 6.1.2. Calcium Chloride
- 6.1.3. Magnesium Chloride
- 6.1.4. Asphalt Emulsions
- 6.1.5. Oil Emulsions
- 6.1.6. Polymeric Emulsions
- 6.1.7. Other Chemical Types
- 6.2. Market Analysis, Insights and Forecast - by System Type
- 6.2.1. Dry Collection
- 6.2.2. Wet Suppression
- 6.3. Market Analysis, Insights and Forecast - by End-user Industry
- 6.3.1. Mining
- 6.3.2. Construction
- 6.3.3. Food and Beverage
- 6.3.4. Oil and Gas and Petrochemical
- 6.3.5. Pharmaceutical
- 6.3.6. Other End-user Industries
- 6.1. Market Analysis, Insights and Forecast - by Chemical Type
- 7. North America Dust Suppression Systems Industry Analysis, Insights and Forecast, 2019-2031
- 7.1. Market Analysis, Insights and Forecast - by Chemical Type
- 7.1.1. Lignin Sulfonate
- 7.1.2. Calcium Chloride
- 7.1.3. Magnesium Chloride
- 7.1.4. Asphalt Emulsions
- 7.1.5. Oil Emulsions
- 7.1.6. Polymeric Emulsions
- 7.1.7. Other Chemical Types
- 7.2. Market Analysis, Insights and Forecast - by System Type
- 7.2.1. Dry Collection
- 7.2.2. Wet Suppression
- 7.3. Market Analysis, Insights and Forecast - by End-user Industry
- 7.3.1. Mining
- 7.3.2. Construction
- 7.3.3. Food and Beverage
- 7.3.4. Oil and Gas and Petrochemical
- 7.3.5. Pharmaceutical
- 7.3.6. Other End-user Industries
- 7.1. Market Analysis, Insights and Forecast - by Chemical Type
- 8. Europe Dust Suppression Systems Industry Analysis, Insights and Forecast, 2019-2031
- 8.1. Market Analysis, Insights and Forecast - by Chemical Type
- 8.1.1. Lignin Sulfonate
- 8.1.2. Calcium Chloride
- 8.1.3. Magnesium Chloride
- 8.1.4. Asphalt Emulsions
- 8.1.5. Oil Emulsions
- 8.1.6. Polymeric Emulsions
- 8.1.7. Other Chemical Types
- 8.2. Market Analysis, Insights and Forecast - by System Type
- 8.2.1. Dry Collection
- 8.2.2. Wet Suppression
- 8.3. Market Analysis, Insights and Forecast - by End-user Industry
- 8.3.1. Mining
- 8.3.2. Construction
- 8.3.3. Food and Beverage
- 8.3.4. Oil and Gas and Petrochemical
- 8.3.5. Pharmaceutical
- 8.3.6. Other End-user Industries
- 8.1. Market Analysis, Insights and Forecast - by Chemical Type
- 9. South America Dust Suppression Systems Industry Analysis, Insights and Forecast, 2019-2031
- 9.1. Market Analysis, Insights and Forecast - by Chemical Type
- 9.1.1. Lignin Sulfonate
- 9.1.2. Calcium Chloride
- 9.1.3. Magnesium Chloride
- 9.1.4. Asphalt Emulsions
- 9.1.5. Oil Emulsions
- 9.1.6. Polymeric Emulsions
- 9.1.7. Other Chemical Types
- 9.2. Market Analysis, Insights and Forecast - by System Type
- 9.2.1. Dry Collection
- 9.2.2. Wet Suppression
- 9.3. Market Analysis, Insights and Forecast - by End-user Industry
- 9.3.1. Mining
- 9.3.2. Construction
- 9.3.3. Food and Beverage
- 9.3.4. Oil and Gas and Petrochemical
- 9.3.5. Pharmaceutical
- 9.3.6. Other End-user Industries
- 9.1. Market Analysis, Insights and Forecast - by Chemical Type
- 10. Middle East and Africa Dust Suppression Systems Industry Analysis, Insights and Forecast, 2019-2031
- 10.1. Market Analysis, Insights and Forecast - by Chemical Type
- 10.1.1. Lignin Sulfonate
- 10.1.2. Calcium Chloride
- 10.1.3. Magnesium Chloride
- 10.1.4. Asphalt Emulsions
- 10.1.5. Oil Emulsions
- 10.1.6. Polymeric Emulsions
- 10.1.7. Other Chemical Types
- 10.2. Market Analysis, Insights and Forecast - by System Type
- 10.2.1. Dry Collection
- 10.2.2. Wet Suppression
- 10.3. Market Analysis, Insights and Forecast - by End-user Industry
- 10.3.1. Mining
- 10.3.2. Construction
- 10.3.3. Food and Beverage
- 10.3.4. Oil and Gas and Petrochemical
- 10.3.5. Pharmaceutical
- 10.3.6. Other End-user Industries
- 10.1. Market Analysis, Insights and Forecast - by Chemical Type
- 11. Competitive Analysis
- 11.1. Global Market Share Analysis 2024
- 11.2. Company Profiles
- 11.2.1 Chemical Providers
- 11.2.1.1. Overview
- 11.2.1.2. Products
- 11.2.1.3. SWOT Analysis
- 11.2.1.4. Recent Developments
- 11.2.1.5. Financials (Based on Availability)
- 11.2.2 1 ADM
- 11.2.2.1. Overview
- 11.2.2.2. Products
- 11.2.2.3. SWOT Analysis
- 11.2.2.4. Recent Developments
- 11.2.2.5. Financials (Based on Availability)
- 11.2.3 2 Benetech Inc
- 11.2.3.1. Overview
- 11.2.3.2. Products
- 11.2.3.3. SWOT Analysis
- 11.2.3.4. Recent Developments
- 11.2.3.5. Financials (Based on Availability)
- 11.2.4 3 Borregaard
- 11.2.4.1. Overview
- 11.2.4.2. Products
- 11.2.4.3. SWOT Analysis
- 11.2.4.4. Recent Developments
- 11.2.4.5. Financials (Based on Availability)
- 11.2.5 4 Cargill Incorporated
- 11.2.5.1. Overview
- 11.2.5.2. Products
- 11.2.5.3. SWOT Analysis
- 11.2.5.4. Recent Developments
- 11.2.5.5. Financials (Based on Availability)
- 11.2.6 5 Chemtex Speciality Limited
- 11.2.6.1. Overview
- 11.2.6.2. Products
- 11.2.6.3. SWOT Analysis
- 11.2.6.4. Recent Developments
- 11.2.6.5. Financials (Based on Availability)
- 11.2.7 6 Evonik Industries AG
- 11.2.7.1. Overview
- 11.2.7.2. Products
- 11.2.7.3. SWOT Analysis
- 11.2.7.4. Recent Developments
- 11.2.7.5. Financials (Based on Availability)
- 11.2.8 7 GelTech Solutions
- 11.2.8.1. Overview
- 11.2.8.2. Products
- 11.2.8.3. SWOT Analysis
- 11.2.8.4. Recent Developments
- 11.2.8.5. Financials (Based on Availability)
- 11.2.9 8 Hexion
- 11.2.9.1. Overview
- 11.2.9.2. Products
- 11.2.9.3. SWOT Analysis
- 11.2.9.4. Recent Developments
- 11.2.9.5. Financials (Based on Availability)
- 11.2.10 9 Quaker Houghton (Quaker Chemical Corporation)
- 11.2.10.1. Overview
- 11.2.10.2. Products
- 11.2.10.3. SWOT Analysis
- 11.2.10.4. Recent Developments
- 11.2.10.5. Financials (Based on Availability)
- 11.2.11 10 Shaw Almex Industries Ltd
- 11.2.11.1. Overview
- 11.2.11.2. Products
- 11.2.11.3. SWOT Analysis
- 11.2.11.4. Recent Developments
- 11.2.11.5. Financials (Based on Availability)
- 11.2.12 11 SUEZ
- 11.2.12.1. Overview
- 11.2.12.2. Products
- 11.2.12.3. SWOT Analysis
- 11.2.12.4. Recent Developments
- 11.2.12.5. Financials (Based on Availability)
- 11.2.13 12 Ecolab
- 11.2.13.1. Overview
- 11.2.13.2. Products
- 11.2.13.3. SWOT Analysis
- 11.2.13.4. Recent Developments
- 11.2.13.5. Financials (Based on Availability)
- 11.2.14 System Providers
- 11.2.14.1. Overview
- 11.2.14.2. Products
- 11.2.14.3. SWOT Analysis
- 11.2.14.4. Recent Developments
- 11.2.14.5. Financials (Based on Availability)
- 11.2.15 1 BossTek
- 11.2.15.1. Overview
- 11.2.15.2. Products
- 11.2.15.3. SWOT Analysis
- 11.2.15.4. Recent Developments
- 11.2.15.5. Financials (Based on Availability)
- 11.2.16 2 Camfil
- 11.2.16.1. Overview
- 11.2.16.2. Products
- 11.2.16.3. SWOT Analysis
- 11.2.16.4. Recent Developments
- 11.2.16.5. Financials (Based on Availability)
- 11.2.17 3 CW Machine Worx
- 11.2.17.1. Overview
- 11.2.17.2. Products
- 11.2.17.3. SWOT Analysis
- 11.2.17.4. Recent Developments
- 11.2.17.5. Financials (Based on Availability)
- 11.2.18 4 Donaldson Company Inc
- 11.2.18.1. Overview
- 11.2.18.2. Products
- 11.2.18.3. SWOT Analysis
- 11.2.18.4. Recent Developments
- 11.2.18.5. Financials (Based on Availability)
- 11.2.19 5 DSH Systems Ltd
- 11.2.19.1. Overview
- 11.2.19.2. Products
- 11.2.19.3. SWOT Analysis
- 11.2.19.4. Recent Developments
- 11.2.19.5. Financials (Based on Availability)
- 11.2.20 6 Duztech AB
- 11.2.20.1. Overview
- 11.2.20.2. Products
- 11.2.20.3. SWOT Analysis
- 11.2.20.4. Recent Developments
- 11.2.20.5. Financials (Based on Availability)
- 11.2.21 7 Nederman Holding AB
- 11.2.21.1. Overview
- 11.2.21.2. Products
- 11.2.21.3. SWOT Analysis
- 11.2.21.4. Recent Developments
- 11.2.21.5. Financials (Based on Availability)
- 11.2.22 8 SLY Inc
- 11.2.22.1. Overview
- 11.2.22.2. Products
- 11.2.22.3. SWOT Analysis
- 11.2.22.4. Recent Developments
- 11.2.22.5. Financials (Based on Availability)
- 11.2.23 9 The ACT Group*List Not Exhaustive
- 11.2.23.1. Overview
- 11.2.23.2. Products
- 11.2.23.3. SWOT Analysis
- 11.2.23.4. Recent Developments
- 11.2.23.5. Financials (Based on Availability)
- 11.2.1 Chemical Providers
List of Figures
- Figure 1: Global Dust Suppression Systems Industry Revenue Breakdown (Million, %) by Region 2024 & 2032
- Figure 2: Global Dust Suppression Systems Industry Volume Breakdown (Billion, %) by Region 2024 & 2032
- Figure 3: Asia Pacific Dust Suppression Systems Industry Revenue (Million), by Chemical Type 2024 & 2032
- Figure 4: Asia Pacific Dust Suppression Systems Industry Volume (Billion), by Chemical Type 2024 & 2032
- Figure 5: Asia Pacific Dust Suppression Systems Industry Revenue Share (%), by Chemical Type 2024 & 2032
- Figure 6: Asia Pacific Dust Suppression Systems Industry Volume Share (%), by Chemical Type 2024 & 2032
- Figure 7: Asia Pacific Dust Suppression Systems Industry Revenue (Million), by System Type 2024 & 2032
- Figure 8: Asia Pacific Dust Suppression Systems Industry Volume (Billion), by System Type 2024 & 2032
- Figure 9: Asia Pacific Dust Suppression Systems Industry Revenue Share (%), by System Type 2024 & 2032
- Figure 10: Asia Pacific Dust Suppression Systems Industry Volume Share (%), by System Type 2024 & 2032
- Figure 11: Asia Pacific Dust Suppression Systems Industry Revenue (Million), by End-user Industry 2024 & 2032
- Figure 12: Asia Pacific Dust Suppression Systems Industry Volume (Billion), by End-user Industry 2024 & 2032
- Figure 13: Asia Pacific Dust Suppression Systems Industry Revenue Share (%), by End-user Industry 2024 & 2032
- Figure 14: Asia Pacific Dust Suppression Systems Industry Volume Share (%), by End-user Industry 2024 & 2032
- Figure 15: Asia Pacific Dust Suppression Systems Industry Revenue (Million), by Country 2024 & 2032
- Figure 16: Asia Pacific Dust Suppression Systems Industry Volume (Billion), by Country 2024 & 2032
- Figure 17: Asia Pacific Dust Suppression Systems Industry Revenue Share (%), by Country 2024 & 2032
- Figure 18: Asia Pacific Dust Suppression Systems Industry Volume Share (%), by Country 2024 & 2032
- Figure 19: North America Dust Suppression Systems Industry Revenue (Million), by Chemical Type 2024 & 2032
- Figure 20: North America Dust Suppression Systems Industry Volume (Billion), by Chemical Type 2024 & 2032
- Figure 21: North America Dust Suppression Systems Industry Revenue Share (%), by Chemical Type 2024 & 2032
- Figure 22: North America Dust Suppression Systems Industry Volume Share (%), by Chemical Type 2024 & 2032
- Figure 23: North America Dust Suppression Systems Industry Revenue (Million), by System Type 2024 & 2032
- Figure 24: North America Dust Suppression Systems Industry Volume (Billion), by System Type 2024 & 2032
- Figure 25: North America Dust Suppression Systems Industry Revenue Share (%), by System Type 2024 & 2032
- Figure 26: North America Dust Suppression Systems Industry Volume Share (%), by System Type 2024 & 2032
- Figure 27: North America Dust Suppression Systems Industry Revenue (Million), by End-user Industry 2024 & 2032
- Figure 28: North America Dust Suppression Systems Industry Volume (Billion), by End-user Industry 2024 & 2032
- Figure 29: North America Dust Suppression Systems Industry Revenue Share (%), by End-user Industry 2024 & 2032
- Figure 30: North America Dust Suppression Systems Industry Volume Share (%), by End-user Industry 2024 & 2032
- Figure 31: North America Dust Suppression Systems Industry Revenue (Million), by Country 2024 & 2032
- Figure 32: North America Dust Suppression Systems Industry Volume (Billion), by Country 2024 & 2032
- Figure 33: North America Dust Suppression Systems Industry Revenue Share (%), by Country 2024 & 2032
- Figure 34: North America Dust Suppression Systems Industry Volume Share (%), by Country 2024 & 2032
- Figure 35: Europe Dust Suppression Systems Industry Revenue (Million), by Chemical Type 2024 & 2032
- Figure 36: Europe Dust Suppression Systems Industry Volume (Billion), by Chemical Type 2024 & 2032
- Figure 37: Europe Dust Suppression Systems Industry Revenue Share (%), by Chemical Type 2024 & 2032
- Figure 38: Europe Dust Suppression Systems Industry Volume Share (%), by Chemical Type 2024 & 2032
- Figure 39: Europe Dust Suppression Systems Industry Revenue (Million), by System Type 2024 & 2032
- Figure 40: Europe Dust Suppression Systems Industry Volume (Billion), by System Type 2024 & 2032
- Figure 41: Europe Dust Suppression Systems Industry Revenue Share (%), by System Type 2024 & 2032
- Figure 42: Europe Dust Suppression Systems Industry Volume Share (%), by System Type 2024 & 2032
- Figure 43: Europe Dust Suppression Systems Industry Revenue (Million), by End-user Industry 2024 & 2032
- Figure 44: Europe Dust Suppression Systems Industry Volume (Billion), by End-user Industry 2024 & 2032
- Figure 45: Europe Dust Suppression Systems Industry Revenue Share (%), by End-user Industry 2024 & 2032
- Figure 46: Europe Dust Suppression Systems Industry Volume Share (%), by End-user Industry 2024 & 2032
- Figure 47: Europe Dust Suppression Systems Industry Revenue (Million), by Country 2024 & 2032
- Figure 48: Europe Dust Suppression Systems Industry Volume (Billion), by Country 2024 & 2032
- Figure 49: Europe Dust Suppression Systems Industry Revenue Share (%), by Country 2024 & 2032
- Figure 50: Europe Dust Suppression Systems Industry Volume Share (%), by Country 2024 & 2032
- Figure 51: South America Dust Suppression Systems Industry Revenue (Million), by Chemical Type 2024 & 2032
- Figure 52: South America Dust Suppression Systems Industry Volume (Billion), by Chemical Type 2024 & 2032
- Figure 53: South America Dust Suppression Systems Industry Revenue Share (%), by Chemical Type 2024 & 2032
- Figure 54: South America Dust Suppression Systems Industry Volume Share (%), by Chemical Type 2024 & 2032
- Figure 55: South America Dust Suppression Systems Industry Revenue (Million), by System Type 2024 & 2032
- Figure 56: South America Dust Suppression Systems Industry Volume (Billion), by System Type 2024 & 2032
- Figure 57: South America Dust Suppression Systems Industry Revenue Share (%), by System Type 2024 & 2032
- Figure 58: South America Dust Suppression Systems Industry Volume Share (%), by System Type 2024 & 2032
- Figure 59: South America Dust Suppression Systems Industry Revenue (Million), by End-user Industry 2024 & 2032
- Figure 60: South America Dust Suppression Systems Industry Volume (Billion), by End-user Industry 2024 & 2032
- Figure 61: South America Dust Suppression Systems Industry Revenue Share (%), by End-user Industry 2024 & 2032
- Figure 62: South America Dust Suppression Systems Industry Volume Share (%), by End-user Industry 2024 & 2032
- Figure 63: South America Dust Suppression Systems Industry Revenue (Million), by Country 2024 & 2032
- Figure 64: South America Dust Suppression Systems Industry Volume (Billion), by Country 2024 & 2032
- Figure 65: South America Dust Suppression Systems Industry Revenue Share (%), by Country 2024 & 2032
- Figure 66: South America Dust Suppression Systems Industry Volume Share (%), by Country 2024 & 2032
- Figure 67: Middle East and Africa Dust Suppression Systems Industry Revenue (Million), by Chemical Type 2024 & 2032
- Figure 68: Middle East and Africa Dust Suppression Systems Industry Volume (Billion), by Chemical Type 2024 & 2032
- Figure 69: Middle East and Africa Dust Suppression Systems Industry Revenue Share (%), by Chemical Type 2024 & 2032
- Figure 70: Middle East and Africa Dust Suppression Systems Industry Volume Share (%), by Chemical Type 2024 & 2032
- Figure 71: Middle East and Africa Dust Suppression Systems Industry Revenue (Million), by System Type 2024 & 2032
- Figure 72: Middle East and Africa Dust Suppression Systems Industry Volume (Billion), by System Type 2024 & 2032
- Figure 73: Middle East and Africa Dust Suppression Systems Industry Revenue Share (%), by System Type 2024 & 2032
- Figure 74: Middle East and Africa Dust Suppression Systems Industry Volume Share (%), by System Type 2024 & 2032
- Figure 75: Middle East and Africa Dust Suppression Systems Industry Revenue (Million), by End-user Industry 2024 & 2032
- Figure 76: Middle East and Africa Dust Suppression Systems Industry Volume (Billion), by End-user Industry 2024 & 2032
- Figure 77: Middle East and Africa Dust Suppression Systems Industry Revenue Share (%), by End-user Industry 2024 & 2032
- Figure 78: Middle East and Africa Dust Suppression Systems Industry Volume Share (%), by End-user Industry 2024 & 2032
- Figure 79: Middle East and Africa Dust Suppression Systems Industry Revenue (Million), by Country 2024 & 2032
- Figure 80: Middle East and Africa Dust Suppression Systems Industry Volume (Billion), by Country 2024 & 2032
- Figure 81: Middle East and Africa Dust Suppression Systems Industry Revenue Share (%), by Country 2024 & 2032
- Figure 82: Middle East and Africa Dust Suppression Systems Industry Volume Share (%), by Country 2024 & 2032
List of Tables
- Table 1: Global Dust Suppression Systems Industry Revenue Million Forecast, by Region 2019 & 2032
- Table 2: Global Dust Suppression Systems Industry Volume Billion Forecast, by Region 2019 & 2032
- Table 3: Global Dust Suppression Systems Industry Revenue Million Forecast, by Chemical Type 2019 & 2032
- Table 4: Global Dust Suppression Systems Industry Volume Billion Forecast, by Chemical Type 2019 & 2032
- Table 5: Global Dust Suppression Systems Industry Revenue Million Forecast, by System Type 2019 & 2032
- Table 6: Global Dust Suppression Systems Industry Volume Billion Forecast, by System Type 2019 & 2032
- Table 7: Global Dust Suppression Systems Industry Revenue Million Forecast, by End-user Industry 2019 & 2032
- Table 8: Global Dust Suppression Systems Industry Volume Billion Forecast, by End-user Industry 2019 & 2032
- Table 9: Global Dust Suppression Systems Industry Revenue Million Forecast, by Region 2019 & 2032
- Table 10: Global Dust Suppression Systems Industry Volume Billion Forecast, by Region 2019 & 2032
- Table 11: Global Dust Suppression Systems Industry Revenue Million Forecast, by Chemical Type 2019 & 2032
- Table 12: Global Dust Suppression Systems Industry Volume Billion Forecast, by Chemical Type 2019 & 2032
- Table 13: Global Dust Suppression Systems Industry Revenue Million Forecast, by System Type 2019 & 2032
- Table 14: Global Dust Suppression Systems Industry Volume Billion Forecast, by System Type 2019 & 2032
- Table 15: Global Dust Suppression Systems Industry Revenue Million Forecast, by End-user Industry 2019 & 2032
- Table 16: Global Dust Suppression Systems Industry Volume Billion Forecast, by End-user Industry 2019 & 2032
- Table 17: Global Dust Suppression Systems Industry Revenue Million Forecast, by Country 2019 & 2032
- Table 18: Global Dust Suppression Systems Industry Volume Billion Forecast, by Country 2019 & 2032
- Table 19: China Dust Suppression Systems Industry Revenue (Million) Forecast, by Application 2019 & 2032
- Table 20: China Dust Suppression Systems Industry Volume (Billion) Forecast, by Application 2019 & 2032
- Table 21: India Dust Suppression Systems Industry Revenue (Million) Forecast, by Application 2019 & 2032
- Table 22: India Dust Suppression Systems Industry Volume (Billion) Forecast, by Application 2019 & 2032
- Table 23: Japan Dust Suppression Systems Industry Revenue (Million) Forecast, by Application 2019 & 2032
- Table 24: Japan Dust Suppression Systems Industry Volume (Billion) Forecast, by Application 2019 & 2032
- Table 25: South Korea Dust Suppression Systems Industry Revenue (Million) Forecast, by Application 2019 & 2032
- Table 26: South Korea Dust Suppression Systems Industry Volume (Billion) Forecast, by Application 2019 & 2032
- Table 27: Malaysia Dust Suppression Systems Industry Revenue (Million) Forecast, by Application 2019 & 2032
- Table 28: Malaysia Dust Suppression Systems Industry Volume (Billion) Forecast, by Application 2019 & 2032
- Table 29: Thailand Dust Suppression Systems Industry Revenue (Million) Forecast, by Application 2019 & 2032
- Table 30: Thailand Dust Suppression Systems Industry Volume (Billion) Forecast, by Application 2019 & 2032
- Table 31: Indonesia Dust Suppression Systems Industry Revenue (Million) Forecast, by Application 2019 & 2032
- Table 32: Indonesia Dust Suppression Systems Industry Volume (Billion) Forecast, by Application 2019 & 2032
- Table 33: Vietnam Dust Suppression Systems Industry Revenue (Million) Forecast, by Application 2019 & 2032
- Table 34: Vietnam Dust Suppression Systems Industry Volume (Billion) Forecast, by Application 2019 & 2032
- Table 35: Rest of Asia Pacific Dust Suppression Systems Industry Revenue (Million) Forecast, by Application 2019 & 2032
- Table 36: Rest of Asia Pacific Dust Suppression Systems Industry Volume (Billion) Forecast, by Application 2019 & 2032
- Table 37: Global Dust Suppression Systems Industry Revenue Million Forecast, by Chemical Type 2019 & 2032
- Table 38: Global Dust Suppression Systems Industry Volume Billion Forecast, by Chemical Type 2019 & 2032
- Table 39: Global Dust Suppression Systems Industry Revenue Million Forecast, by System Type 2019 & 2032
- Table 40: Global Dust Suppression Systems Industry Volume Billion Forecast, by System Type 2019 & 2032
- Table 41: Global Dust Suppression Systems Industry Revenue Million Forecast, by End-user Industry 2019 & 2032
- Table 42: Global Dust Suppression Systems Industry Volume Billion Forecast, by End-user Industry 2019 & 2032
- Table 43: Global Dust Suppression Systems Industry Revenue Million Forecast, by Country 2019 & 2032
- Table 44: Global Dust Suppression Systems Industry Volume Billion Forecast, by Country 2019 & 2032
- Table 45: United States Dust Suppression Systems Industry Revenue (Million) Forecast, by Application 2019 & 2032
- Table 46: United States Dust Suppression Systems Industry Volume (Billion) Forecast, by Application 2019 & 2032
- Table 47: Canada Dust Suppression Systems Industry Revenue (Million) Forecast, by Application 2019 & 2032
- Table 48: Canada Dust Suppression Systems Industry Volume (Billion) Forecast, by Application 2019 & 2032
- Table 49: Mexico Dust Suppression Systems Industry Revenue (Million) Forecast, by Application 2019 & 2032
- Table 50: Mexico Dust Suppression Systems Industry Volume (Billion) Forecast, by Application 2019 & 2032
- Table 51: Global Dust Suppression Systems Industry Revenue Million Forecast, by Chemical Type 2019 & 2032
- Table 52: Global Dust Suppression Systems Industry Volume Billion Forecast, by Chemical Type 2019 & 2032
- Table 53: Global Dust Suppression Systems Industry Revenue Million Forecast, by System Type 2019 & 2032
- Table 54: Global Dust Suppression Systems Industry Volume Billion Forecast, by System Type 2019 & 2032
- Table 55: Global Dust Suppression Systems Industry Revenue Million Forecast, by End-user Industry 2019 & 2032
- Table 56: Global Dust Suppression Systems Industry Volume Billion Forecast, by End-user Industry 2019 & 2032
- Table 57: Global Dust Suppression Systems Industry Revenue Million Forecast, by Country 2019 & 2032
- Table 58: Global Dust Suppression Systems Industry Volume Billion Forecast, by Country 2019 & 2032
- Table 59: Germany Dust Suppression Systems Industry Revenue (Million) Forecast, by Application 2019 & 2032
- Table 60: Germany Dust Suppression Systems Industry Volume (Billion) Forecast, by Application 2019 & 2032
- Table 61: United Kingdom Dust Suppression Systems Industry Revenue (Million) Forecast, by Application 2019 & 2032
- Table 62: United Kingdom Dust Suppression Systems Industry Volume (Billion) Forecast, by Application 2019 & 2032
- Table 63: Italy Dust Suppression Systems Industry Revenue (Million) Forecast, by Application 2019 & 2032
- Table 64: Italy Dust Suppression Systems Industry Volume (Billion) Forecast, by Application 2019 & 2032
- Table 65: France Dust Suppression Systems Industry Revenue (Million) Forecast, by Application 2019 & 2032
- Table 66: France Dust Suppression Systems Industry Volume (Billion) Forecast, by Application 2019 & 2032
- Table 67: Italy Dust Suppression Systems Industry Revenue (Million) Forecast, by Application 2019 & 2032
- Table 68: Italy Dust Suppression Systems Industry Volume (Billion) Forecast, by Application 2019 & 2032
- Table 69: Spain Dust Suppression Systems Industry Revenue (Million) Forecast, by Application 2019 & 2032
- Table 70: Spain Dust Suppression Systems Industry Volume (Billion) Forecast, by Application 2019 & 2032
- Table 71: Nordic Countries Dust Suppression Systems Industry Revenue (Million) Forecast, by Application 2019 & 2032
- Table 72: Nordic Countries Dust Suppression Systems Industry Volume (Billion) Forecast, by Application 2019 & 2032
- Table 73: Turkey Dust Suppression Systems Industry Revenue (Million) Forecast, by Application 2019 & 2032
- Table 74: Turkey Dust Suppression Systems Industry Volume (Billion) Forecast, by Application 2019 & 2032
- Table 75: Russia Dust Suppression Systems Industry Revenue (Million) Forecast, by Application 2019 & 2032
- Table 76: Russia Dust Suppression Systems Industry Volume (Billion) Forecast, by Application 2019 & 2032
- Table 77: Rest of Europe Dust Suppression Systems Industry Revenue (Million) Forecast, by Application 2019 & 2032
- Table 78: Rest of Europe Dust Suppression Systems Industry Volume (Billion) Forecast, by Application 2019 & 2032
- Table 79: Global Dust Suppression Systems Industry Revenue Million Forecast, by Chemical Type 2019 & 2032
- Table 80: Global Dust Suppression Systems Industry Volume Billion Forecast, by Chemical Type 2019 & 2032
- Table 81: Global Dust Suppression Systems Industry Revenue Million Forecast, by System Type 2019 & 2032
- Table 82: Global Dust Suppression Systems Industry Volume Billion Forecast, by System Type 2019 & 2032
- Table 83: Global Dust Suppression Systems Industry Revenue Million Forecast, by End-user Industry 2019 & 2032
- Table 84: Global Dust Suppression Systems Industry Volume Billion Forecast, by End-user Industry 2019 & 2032
- Table 85: Global Dust Suppression Systems Industry Revenue Million Forecast, by Country 2019 & 2032
- Table 86: Global Dust Suppression Systems Industry Volume Billion Forecast, by Country 2019 & 2032
- Table 87: Brazil Dust Suppression Systems Industry Revenue (Million) Forecast, by Application 2019 & 2032
- Table 88: Brazil Dust Suppression Systems Industry Volume (Billion) Forecast, by Application 2019 & 2032
- Table 89: Argentina Dust Suppression Systems Industry Revenue (Million) Forecast, by Application 2019 & 2032
- Table 90: Argentina Dust Suppression Systems Industry Volume (Billion) Forecast, by Application 2019 & 2032
- Table 91: Colombia Dust Suppression Systems Industry Revenue (Million) Forecast, by Application 2019 & 2032
- Table 92: Colombia Dust Suppression Systems Industry Volume (Billion) Forecast, by Application 2019 & 2032
- Table 93: Rest of South America Dust Suppression Systems Industry Revenue (Million) Forecast, by Application 2019 & 2032
- Table 94: Rest of South America Dust Suppression Systems Industry Volume (Billion) Forecast, by Application 2019 & 2032
- Table 95: Global Dust Suppression Systems Industry Revenue Million Forecast, by Chemical Type 2019 & 2032
- Table 96: Global Dust Suppression Systems Industry Volume Billion Forecast, by Chemical Type 2019 & 2032
- Table 97: Global Dust Suppression Systems Industry Revenue Million Forecast, by System Type 2019 & 2032
- Table 98: Global Dust Suppression Systems Industry Volume Billion Forecast, by System Type 2019 & 2032
- Table 99: Global Dust Suppression Systems Industry Revenue Million Forecast, by End-user Industry 2019 & 2032
- Table 100: Global Dust Suppression Systems Industry Volume Billion Forecast, by End-user Industry 2019 & 2032
- Table 101: Global Dust Suppression Systems Industry Revenue Million Forecast, by Country 2019 & 2032
- Table 102: Global Dust Suppression Systems Industry Volume Billion Forecast, by Country 2019 & 2032
- Table 103: Saudi Arabia Dust Suppression Systems Industry Revenue (Million) Forecast, by Application 2019 & 2032
- Table 104: Saudi Arabia Dust Suppression Systems Industry Volume (Billion) Forecast, by Application 2019 & 2032
- Table 105: Qatar Dust Suppression Systems Industry Revenue (Million) Forecast, by Application 2019 & 2032
- Table 106: Qatar Dust Suppression Systems Industry Volume (Billion) Forecast, by Application 2019 & 2032
- Table 107: United Arab Emirates Dust Suppression Systems Industry Revenue (Million) Forecast, by Application 2019 & 2032
- Table 108: United Arab Emirates Dust Suppression Systems Industry Volume (Billion) Forecast, by Application 2019 & 2032
- Table 109: Nigeria Dust Suppression Systems Industry Revenue (Million) Forecast, by Application 2019 & 2032
- Table 110: Nigeria Dust Suppression Systems Industry Volume (Billion) Forecast, by Application 2019 & 2032
- Table 111: Egypt Dust Suppression Systems Industry Revenue (Million) Forecast, by Application 2019 & 2032
- Table 112: Egypt Dust Suppression Systems Industry Volume (Billion) Forecast, by Application 2019 & 2032
- Table 113: South Africa Dust Suppression Systems Industry Revenue (Million) Forecast, by Application 2019 & 2032
- Table 114: South Africa Dust Suppression Systems Industry Volume (Billion) Forecast, by Application 2019 & 2032
- Table 115: Rest of Middle East and Africa Dust Suppression Systems Industry Revenue (Million) Forecast, by Application 2019 & 2032
- Table 116: Rest of Middle East and Africa Dust Suppression Systems Industry Volume (Billion) Forecast, by Application 2019 & 2032
Frequently Asked Questions
1. What is the projected Compound Annual Growth Rate (CAGR) of the Dust Suppression Systems Industry?
The projected CAGR is approximately 4.73%.
2. Which companies are prominent players in the Dust Suppression Systems Industry?
Key companies in the market include Chemical Providers, 1 ADM, 2 Benetech Inc, 3 Borregaard, 4 Cargill Incorporated, 5 Chemtex Speciality Limited, 6 Evonik Industries AG, 7 GelTech Solutions, 8 Hexion, 9 Quaker Houghton (Quaker Chemical Corporation), 10 Shaw Almex Industries Ltd, 11 SUEZ, 12 Ecolab, System Providers, 1 BossTek, 2 Camfil, 3 CW Machine Worx, 4 Donaldson Company Inc, 5 DSH Systems Ltd, 6 Duztech AB, 7 Nederman Holding AB, 8 SLY Inc, 9 The ACT Group*List Not Exhaustive.
3. What are the main segments of the Dust Suppression Systems Industry?
The market segments include Chemical Type, System Type, End-user Industry.
4. Can you provide details about the market size?
The market size is estimated to be USD 14.44 Million as of 2022.
5. What are some drivers contributing to market growth?
Growth in Construction and Infrastructure in Asia-Pacific; Increase in Regulatory Compliances; Other Drivers.
6. What are the notable trends driving market growth?
Construction Industry to Dominate the Market.
7. Are there any restraints impacting market growth?
Growth in Construction and Infrastructure in Asia-Pacific; Increase in Regulatory Compliances; Other Drivers.
8. Can you provide examples of recent developments in the market?
March 2024: Camfil Air Pollution Control (APC) has unveiled its newest offering, the Gold Series Timer (GST), an innovative-edge dust collection controller. The GST serves as a straightforward yet powerful tool for managing pulse-jet cleaning in various industrial dust collection systems, such as baghouses. With its state-of-the-art design, the GST provides an intuitive and easily implementable solution for pulse-jet cleaning in industrial dust collection systems.February 2023: BOSSTEK, renowned for its portable dust-suppression equipment, has unveiled the DustBoss DB-45 Surge, the newest addition to its acclaimed Surge line. This innovative-edge technology features an innovative pressurized center nozzle, complemented by the OEM's trusted fan and misting ring system, empowering users to effectively manage dust, regardless of weather conditions.
9. What pricing options are available for accessing the report?
Pricing options include single-user, multi-user, and enterprise licenses priced at USD 4750, USD 5250, and USD 8750 respectively.
10. Is the market size provided in terms of value or volume?
The market size is provided in terms of value, measured in Million and volume, measured in Billion.
11. Are there any specific market keywords associated with the report?
Yes, the market keyword associated with the report is "Dust Suppression Systems Industry," which aids in identifying and referencing the specific market segment covered.
12. How do I determine which pricing option suits my needs best?
The pricing options vary based on user requirements and access needs. Individual users may opt for single-user licenses, while businesses requiring broader access may choose multi-user or enterprise licenses for cost-effective access to the report.
13. Are there any additional resources or data provided in the Dust Suppression Systems Industry report?
While the report offers comprehensive insights, it's advisable to review the specific contents or supplementary materials provided to ascertain if additional resources or data are available.
14. How can I stay updated on further developments or reports in the Dust Suppression Systems Industry?
To stay informed about further developments, trends, and reports in the Dust Suppression Systems Industry, consider subscribing to industry newsletters, following relevant companies and organizations, or regularly checking reputable industry news sources and publications.
Methodology
Step 1 - Identification of Relevant Samples Size from Population Database


Step 2 - Approaches for Defining Global Market Size (Value, Volume* & Price*)

Note*: In applicable scenarios
Step 3 - Data Sources
Primary Research
- Web Analytics
- Survey Reports
- Research Institute
- Latest Research Reports
- Opinion Leaders
Secondary Research
- Annual Reports
- White Paper
- Latest Press Release
- Industry Association
- Paid Database
- Investor Presentations

Step 4 - Data Triangulation
Involves using different sources of information in order to increase the validity of a study
These sources are likely to be stakeholders in a program - participants, other researchers, program staff, other community members, and so on.
Then we put all data in single framework & apply various statistical tools to find out the dynamic on the market.
During the analysis stage, feedback from the stakeholder groups would be compared to determine areas of agreement as well as areas of divergence
