

Key Insights
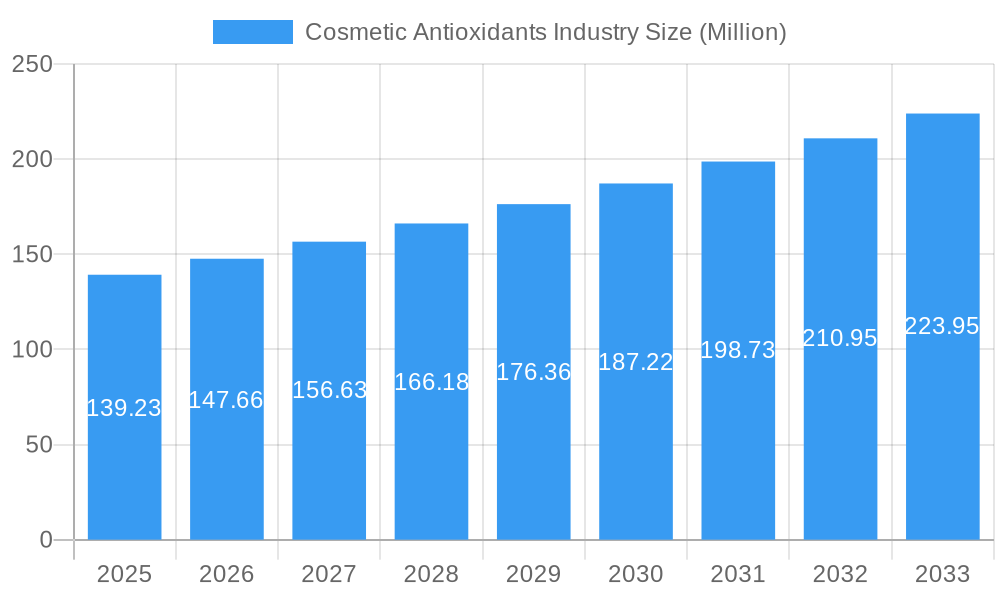
The global cosmetic antioxidants market, valued at $139.23 million in 2025, is projected to experience robust growth, driven by increasing consumer awareness of skincare benefits and the rising demand for natural and organic cosmetic products. A Compound Annual Growth Rate (CAGR) of 5.95% is anticipated from 2025 to 2033, indicating significant market expansion. Key growth drivers include the rising prevalence of skin aging and related concerns, the increasing adoption of anti-aging products, and the growing popularity of natural and sustainable beauty solutions. The market is segmented by source (natural and chemically derived), type (vitamins, polyphenols, enzymes, carotenoids, and others including flavonoids, synthetic vitamins, and terpenes), and application (skincare, haircare, injectables, and others including makeup and body care). The natural segment is expected to dominate, fueled by consumer preference for clean beauty products. Within applications, skincare currently holds the largest market share due to the wide use of antioxidants in serums, creams, and lotions to combat free radical damage. Major players, including Koninklijke DSM, Lonza Group, and Kemin Industries, are actively investing in research and development to introduce innovative antioxidant formulations and cater to evolving consumer demands. Geographical expansion is also a key market trend, with the Asia-Pacific region projected to exhibit significant growth due to increasing disposable incomes and rising beauty consciousness in countries like China and India. However, potential restraints include fluctuating raw material prices and stringent regulatory frameworks in certain regions.
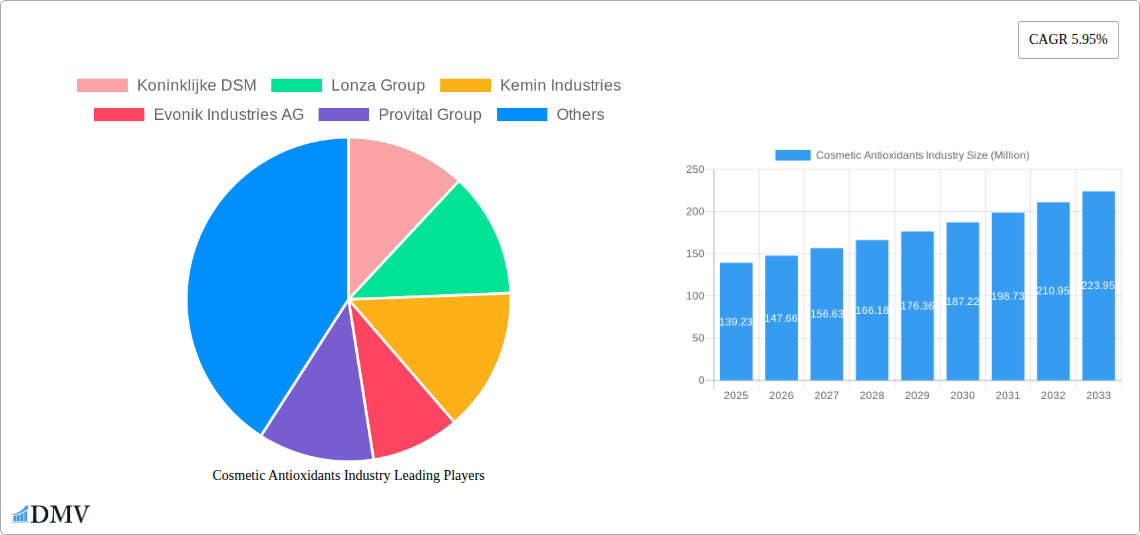
Cosmetic Antioxidants Industry Market Size (In Million)
The competitive landscape is characterized by both large multinational corporations and smaller specialized companies. Strategic partnerships, mergers, and acquisitions are common strategies employed to enhance market reach and product portfolios. Furthermore, the market is witnessing the emergence of innovative delivery systems for antioxidants, such as liposomes and nanoparticles, to improve their efficacy and stability in cosmetic formulations. The increasing focus on personalized skincare solutions presents an exciting opportunity for market players to develop targeted antioxidant products tailored to specific skin types and concerns. Continued growth is therefore anticipated, underpinned by these positive trends and the ongoing demand for effective anti-aging and skin-protective cosmetic products.
Cosmetic Antioxidants Industry Company Market Share
Cosmetic Antioxidants Industry Market Report: 2019-2033
This comprehensive report provides a detailed analysis of the global cosmetic antioxidants market, offering invaluable insights for stakeholders seeking to navigate this dynamic industry. The study period covers 2019-2033, with 2025 serving as the base and estimated year. The report forecasts market trends from 2025 to 2033, providing a robust historical overview from 2019-2024. Expect in-depth analysis of key market segments, competitive dynamics, and future growth prospects, valued in Millions.
Cosmetic Antioxidants Industry Market Composition & Trends
This section meticulously analyzes the dynamic competitive landscape, the pivotal innovation drivers, the evolving regulatory hurdles, and the multifaceted market dynamics within the global cosmetic antioxidants industry. We conduct a thorough examination of market concentration, evaluating the precise market share distribution among prominent key players, including but not limited to Koninklijke DSM, Lonza Group, Kemin Industries, Evonik Industries AG, Provital Group, Croda International Plc, BASF SE, Eastman Chemical Company, BTSA Biotecnologias Aplicadas, and Wacker Chemie AG. Our analysis quantifies the market share of the top 5 players at approximately **XX%**, thereby illuminating the current level of market concentration. Furthermore, we critically examine the influential role of mergers and acquisitions (M&A) activities, estimating the total cumulative value of M&A deals within the industry to be around **$XX Million** during the historical period analyzed.
- Market Concentration: The market exhibits a significant degree of concentration, with the top 5 key players collectively holding approximately XX% of the total market share.
- Innovation Catalysts: Key drivers of innovation include the escalating consumer demand for naturally derived and sustainably produced cosmetic ingredients, alongside continuous advancements in sophisticated delivery systems designed to maximize antioxidant efficacy and stability.
- Regulatory Landscape: The industry operates under a stringent regulatory framework, with comprehensive regulations governing ingredient safety, purity, and precise labeling requirements, which significantly influence product development strategies and overall market access.
- Substitute Products: The market faces competitive pressure from a range of alternative skincare ingredients and emerging technologies that offer similar or complementary benefits.
- End-User Profiles: The primary end-users in this market segment are established cosmetic manufacturers, burgeoning personal care brands, and specialized contract manufacturers who integrate antioxidants into their product formulations.
- M&A Activity: The cosmetic antioxidants sector has witnessed substantial M&A activity, predominantly fueled by strategic expansion initiatives and the pursuit of cutting-edge technological advancements. The total estimated value of M&A deals within the period of 2019-2024 approximates **$XX Million**.
Cosmetic Antioxidants Industry Evolution
This section explores the historical and projected growth trajectories of the cosmetic antioxidants market, analyzing technological advancements and evolving consumer preferences. The market experienced a Compound Annual Growth Rate (CAGR) of xx% during 2019-2024, and is projected to grow at a CAGR of xx% from 2025 to 2033, reaching a market size of $xx Million by 2033. This growth is fueled by increasing consumer awareness of skincare benefits, the rise of natural and organic cosmetics, and the development of innovative antioxidant formulations. The adoption of novel technologies like nanotechnology and encapsulation techniques for improved efficacy and stability has significantly impacted market growth. Shifting consumer preferences toward sustainable and ethically sourced ingredients are also driving the industry's evolution.
Leading Regions, Countries, or Segments in Cosmetic Antioxidants Industry
This section identifies the leading regions, countries, and market segments within the cosmetic antioxidants industry. The North American market currently holds a significant share, driven by high consumer spending on skincare products and robust regulatory frameworks. However, the Asia-Pacific region is projected to exhibit substantial growth in the forecast period due to rising disposable incomes and growing awareness of skincare benefits.
- Dominant Region: North America
- High-Growth Region: Asia-Pacific
- Leading Source: Natural (xx% market share in 2025)
- Leading Type: Vitamins (xx% market share in 2025)
- Leading Application: Skin Care (xx% market share in 2025)
Key Drivers:
- North America: Strong regulatory environment, high consumer spending.
- Asia-Pacific: Rising disposable incomes, increasing awareness of skincare.
- Natural Sources: Growing consumer preference for natural and organic products.
- Vitamins: Widely used and readily available, cost-effective.
- Skin Care: Largest application segment due to high demand for anti-aging and skin protection products.
Cosmetic Antioxidants Industry Product Innovations
The cosmetic antioxidants industry is a hotbed of continuous innovation, with a strong focus on developing novel delivery systems. This includes cutting-edge technologies such as liposomes and nanoparticles, meticulously engineered to substantially enhance the efficacy, stability, and bioavailability of antioxidant compounds. We are observing remarkable advancements in encapsulated antioxidants, which enable highly targeted delivery to specific skin layers and significantly improve skin penetration. Unique selling propositions (USPs) in this competitive market increasingly center on the ethical sourcing of natural ingredients, a commitment to sustainable production practices, and robust, clinically proven efficacy claims. The integration of these state-of-the-art technologies is instrumental in delivering superior antioxidant performance and effectively addressing a wide spectrum of specific skincare concerns.
Propelling Factors for Cosmetic Antioxidants Industry Growth
Several potent factors are significantly propelling the growth trajectory of the cosmetic antioxidants market. Firstly, a pronounced surge in consumer awareness regarding the detrimental effects of free radical damage on skin health is directly fueling the demand for antioxidant-rich cosmetic formulations. Secondly, rapid technological advancements, particularly in areas like nanotechnology and sophisticated encapsulation techniques, are instrumental in improving both the efficacy and the stability of antioxidants, thereby enhancing their appeal and value proposition in the market. Finally, the escalating global preference for natural and organic cosmetic products is a major catalyst, creating substantial growth opportunities for manufacturers who prioritize and effectively leverage sustainably sourced, high-quality antioxidant ingredients.
Obstacles in the Cosmetic Antioxidants Industry Market
Challenges facing the industry include the volatility of raw material prices, stringent regulatory requirements for cosmetic ingredients, and intense competition among numerous players. Supply chain disruptions can significantly impact production and pricing. Furthermore, the need to constantly innovate and launch novel products with superior performance capabilities necessitates substantial R&D investments.
Future Opportunities in Cosmetic Antioxidants Industry
The future landscape of the cosmetic antioxidants industry presents a wealth of promising opportunities. These include strategic market expansion into burgeoning emerging markets, the development of highly innovative formulations tailored for specialized applications such as advanced sun protection and potent anti-pollution skincare, and the astute leveraging of the rapidly growing personalized skincare trend. Furthermore, the pervasive and intensifying demand for sustainable and ethically produced consumer goods presents significant opportunities for manufacturers who demonstrably commit to eco-friendly packaging solutions and transparent, sustainable sourcing practices throughout their supply chain.
Major Players in the Cosmetic Antioxidants Industry Ecosystem
- Koninklijke DSM
- Lonza Group
- Kemin Industries
- Evonik Industries AG
- Provital Group
- Croda International Plc
- BASF SE
- Eastman Chemical Company
- BTSA Biotecnologias Aplicadas
- Wacker Chemie AG
*This list is not exhaustive and represents a selection of key industry participants.
Key Developments in Cosmetic Antioxidants Industry Industry
- October 2023: BASF's Care Chemicals division invests in a new plant for emollient specialties, boosting its position in skin and sun protection products. This expansion signifies significant investment in the market and strengthens BASF's competitive advantage.
- June 2023: DKSH's exclusive distribution agreement with Bitop expands Bitop's market reach in Australia, New Zealand, Malaysia, and Singapore, highlighting strategic partnerships driving market penetration.
Strategic Cosmetic Antioxidants Industry Market Forecast
The cosmetic antioxidants market is poised for sustained growth, driven by several factors including increasing consumer awareness of skincare benefits, technological advancements, and the growing demand for natural and sustainable products. The market is expected to witness a significant expansion in the forecast period, presenting lucrative opportunities for manufacturers who can successfully innovate and adapt to evolving consumer preferences. The continued development of novel antioxidants and innovative delivery systems will be crucial in maintaining market competitiveness and driving further growth in the coming years.
Cosmetic Antioxidants Industry Segmentation
-
1. Source
- 1.1. Natural
- 1.2. Chemically Derived
-
2. Type
- 2.1. Vitamins
- 2.2. Polyphenols
- 2.3. Enzymes
- 2.4. Carotenoids
- 2.5. Other Ty
-
3. Application
- 3.1. Skin Care
- 3.2. Hair Care
- 3.3. Injectables
- 3.4. Other Applications (Makeup and Body care)
Cosmetic Antioxidants Industry Segmentation By Geography
-
1. Asia Pacific
- 1.1. China
- 1.2. India
- 1.3. Japan
- 1.4. South Korea
- 1.5. Rest of Asia Pacific
-
2. North America
- 2.1. United States
- 2.2. Canada
- 2.3. Mexico
-
3. Europe
- 3.1. Germany
- 3.2. United Kingdom
- 3.3. Italy
- 3.4. France
- 3.5. Rest of Europe
-
4. South America
- 4.1. Brazil
- 4.2. Argentina
- 4.3. Rest of South America
-
5. Middle East and Africa
- 5.1. Saudi Arabia
- 5.2. South Africa
- 5.3. Rest of Middle East and Africa
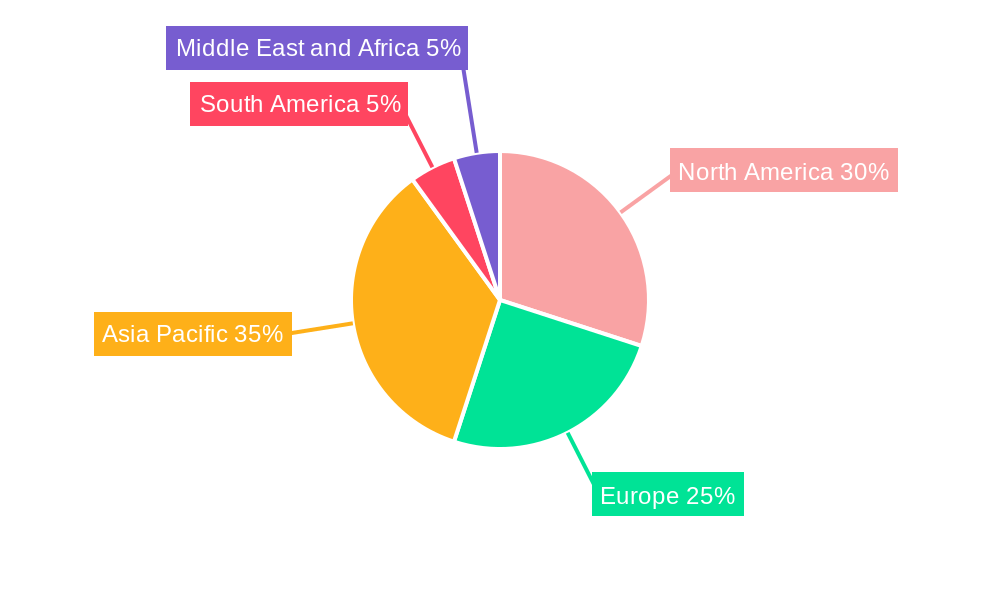
Cosmetic Antioxidants Industry Regional Market Share
Geographic Coverage of Cosmetic Antioxidants Industry
Cosmetic Antioxidants Industry REPORT HIGHLIGHTS
| Aspects | Details |
|---|---|
| Study Period | 2020-2034 |
| Base Year | 2025 |
| Estimated Year | 2026 |
| Forecast Period | 2026-2034 |
| Historical Period | 2020-2025 |
| Growth Rate | CAGR of 5.95% from 2020-2034 |
| Segmentation |
|
Table of Contents
- 1. Introduction
- 1.1. Research Scope
- 1.2. Market Segmentation
- 1.3. Research Objective
- 1.4. Definitions and Assumptions
- 2. Executive Summary
- 2.1. Market Snapshot
- 3. Market Dynamics
- 3.1. Market Drivers
- 3.2. Market Restrains
- 3.3. Market Trends
- 3.4. Market Opportunities
- 4. Market Factor Analysis
- 4.1. Porters Five Forces
- 4.1.1. Bargaining Power of Suppliers
- 4.1.2. Bargaining Power of Buyers
- 4.1.3. Threat of New Entrants
- 4.1.4. Threat of Substitutes
- 4.1.5. Competitive Rivalry
- 4.2. PESTEL analysis
- 4.3. BCG Analysis
- 4.3.1. Stars (High Growth, High Market Share)
- 4.3.2. Cash Cows (Low Growth, High Market Share)
- 4.3.3. Question Mark (High Growth, Low Market Share)
- 4.3.4. Dogs (Low Growth, Low Market Share)
- 4.4. Ansoff Matrix Analysis
- 4.5. Supply Chain Analysis
- 4.6. Regulatory Landscape
- 4.7. Current Market Potential and Opportunity Assessment (TAM–SAM–SOM Framework)
- 4.8. DMV Analyst Note
- 4.1. Porters Five Forces
- 5. Market Analysis, Insights and Forecast 2021-2033
- 5.1. Market Analysis, Insights and Forecast - by Source
- 5.1.1. Natural
- 5.1.2. Chemically Derived
- 5.2. Market Analysis, Insights and Forecast - by Type
- 5.2.1. Vitamins
- 5.2.2. Polyphenols
- 5.2.3. Enzymes
- 5.2.4. Carotenoids
- 5.2.5. Other Ty
- 5.3. Market Analysis, Insights and Forecast - by Application
- 5.3.1. Skin Care
- 5.3.2. Hair Care
- 5.3.3. Injectables
- 5.3.4. Other Applications (Makeup and Body care)
- 5.4. Market Analysis, Insights and Forecast - by Region
- 5.4.1. Asia Pacific
- 5.4.2. North America
- 5.4.3. Europe
- 5.4.4. South America
- 5.4.5. Middle East and Africa
- 5.1. Market Analysis, Insights and Forecast - by Source
- 6. Global Cosmetic Antioxidants Industry Analysis, Insights and Forecast, 2021-2033
- 6.1. Market Analysis, Insights and Forecast - by Source
- 6.1.1. Natural
- 6.1.2. Chemically Derived
- 6.2. Market Analysis, Insights and Forecast - by Type
- 6.2.1. Vitamins
- 6.2.2. Polyphenols
- 6.2.3. Enzymes
- 6.2.4. Carotenoids
- 6.2.5. Other Ty
- 6.3. Market Analysis, Insights and Forecast - by Application
- 6.3.1. Skin Care
- 6.3.2. Hair Care
- 6.3.3. Injectables
- 6.3.4. Other Applications (Makeup and Body care)
- 6.1. Market Analysis, Insights and Forecast - by Source
- 7. Asia Pacific Cosmetic Antioxidants Industry Analysis, Insights and Forecast, 2020-2032
- 7.1. Market Analysis, Insights and Forecast - by Source
- 7.1.1. Natural
- 7.1.2. Chemically Derived
- 7.2. Market Analysis, Insights and Forecast - by Type
- 7.2.1. Vitamins
- 7.2.2. Polyphenols
- 7.2.3. Enzymes
- 7.2.4. Carotenoids
- 7.2.5. Other Ty
- 7.3. Market Analysis, Insights and Forecast - by Application
- 7.3.1. Skin Care
- 7.3.2. Hair Care
- 7.3.3. Injectables
- 7.3.4. Other Applications (Makeup and Body care)
- 7.1. Market Analysis, Insights and Forecast - by Source
- 8. North America Cosmetic Antioxidants Industry Analysis, Insights and Forecast, 2020-2032
- 8.1. Market Analysis, Insights and Forecast - by Source
- 8.1.1. Natural
- 8.1.2. Chemically Derived
- 8.2. Market Analysis, Insights and Forecast - by Type
- 8.2.1. Vitamins
- 8.2.2. Polyphenols
- 8.2.3. Enzymes
- 8.2.4. Carotenoids
- 8.2.5. Other Ty
- 8.3. Market Analysis, Insights and Forecast - by Application
- 8.3.1. Skin Care
- 8.3.2. Hair Care
- 8.3.3. Injectables
- 8.3.4. Other Applications (Makeup and Body care)
- 8.1. Market Analysis, Insights and Forecast - by Source
- 9. Europe Cosmetic Antioxidants Industry Analysis, Insights and Forecast, 2020-2032
- 9.1. Market Analysis, Insights and Forecast - by Source
- 9.1.1. Natural
- 9.1.2. Chemically Derived
- 9.2. Market Analysis, Insights and Forecast - by Type
- 9.2.1. Vitamins
- 9.2.2. Polyphenols
- 9.2.3. Enzymes
- 9.2.4. Carotenoids
- 9.2.5. Other Ty
- 9.3. Market Analysis, Insights and Forecast - by Application
- 9.3.1. Skin Care
- 9.3.2. Hair Care
- 9.3.3. Injectables
- 9.3.4. Other Applications (Makeup and Body care)
- 9.1. Market Analysis, Insights and Forecast - by Source
- 10. South America Cosmetic Antioxidants Industry Analysis, Insights and Forecast, 2020-2032
- 10.1. Market Analysis, Insights and Forecast - by Source
- 10.1.1. Natural
- 10.1.2. Chemically Derived
- 10.2. Market Analysis, Insights and Forecast - by Type
- 10.2.1. Vitamins
- 10.2.2. Polyphenols
- 10.2.3. Enzymes
- 10.2.4. Carotenoids
- 10.2.5. Other Ty
- 10.3. Market Analysis, Insights and Forecast - by Application
- 10.3.1. Skin Care
- 10.3.2. Hair Care
- 10.3.3. Injectables
- 10.3.4. Other Applications (Makeup and Body care)
- 10.1. Market Analysis, Insights and Forecast - by Source
- 11. Middle East and Africa Cosmetic Antioxidants Industry Analysis, Insights and Forecast, 2020-2032
- 11.1. Market Analysis, Insights and Forecast - by Source
- 11.1.1. Natural
- 11.1.2. Chemically Derived
- 11.2. Market Analysis, Insights and Forecast - by Type
- 11.2.1. Vitamins
- 11.2.2. Polyphenols
- 11.2.3. Enzymes
- 11.2.4. Carotenoids
- 11.2.5. Other Ty
- 11.3. Market Analysis, Insights and Forecast - by Application
- 11.3.1. Skin Care
- 11.3.2. Hair Care
- 11.3.3. Injectables
- 11.3.4. Other Applications (Makeup and Body care)
- 11.1. Market Analysis, Insights and Forecast - by Source
- 12. Competitive Analysis
- 12.1. Company Profiles
- 12.1.1 Koninklijke DSM
- 12.1.1.1. Company Overview
- 12.1.1.2. Products
- 12.1.1.3. Company Financials
- 12.1.1.4. SWOT Analysis
- 12.1.2 Lonza Group
- 12.1.2.1. Company Overview
- 12.1.2.2. Products
- 12.1.2.3. Company Financials
- 12.1.2.4. SWOT Analysis
- 12.1.3 Kemin Industries
- 12.1.3.1. Company Overview
- 12.1.3.2. Products
- 12.1.3.3. Company Financials
- 12.1.3.4. SWOT Analysis
- 12.1.4 Evonik Industries AG
- 12.1.4.1. Company Overview
- 12.1.4.2. Products
- 12.1.4.3. Company Financials
- 12.1.4.4. SWOT Analysis
- 12.1.5 Provital Group
- 12.1.5.1. Company Overview
- 12.1.5.2. Products
- 12.1.5.3. Company Financials
- 12.1.5.4. SWOT Analysis
- 12.1.6 Croda International Plc
- 12.1.6.1. Company Overview
- 12.1.6.2. Products
- 12.1.6.3. Company Financials
- 12.1.6.4. SWOT Analysis
- 12.1.7 BASF SE
- 12.1.7.1. Company Overview
- 12.1.7.2. Products
- 12.1.7.3. Company Financials
- 12.1.7.4. SWOT Analysis
- 12.1.8 Eastman Chemical Company
- 12.1.8.1. Company Overview
- 12.1.8.2. Products
- 12.1.8.3. Company Financials
- 12.1.8.4. SWOT Analysis
- 12.1.9 BTSA Biotecnologias Aplicadas
- 12.1.9.1. Company Overview
- 12.1.9.2. Products
- 12.1.9.3. Company Financials
- 12.1.9.4. SWOT Analysis
- 12.1.10 Wacker Chemie AG*List Not Exhaustive
- 12.1.10.1. Company Overview
- 12.1.10.2. Products
- 12.1.10.3. Company Financials
- 12.1.10.4. SWOT Analysis
- 12.1.1 Koninklijke DSM
- 12.2. Market Entropy
- 12.2.1 Company's Key Areas Served
- 12.2.2 Recent Developments
- 12.3. Company Market Share Analysis 2025
- 12.3.1 Top 5 Companies Market Share Analysis
- 12.3.2 Top 3 Companies Market Share Analysis
- 12.4. List of Potential Customers
- 13. Research Methodology
List of Figures
- Figure 1: Global Cosmetic Antioxidants Industry Revenue Breakdown (Million, %) by Region 2025 & 2033
- Figure 2: Asia Pacific Cosmetic Antioxidants Industry Revenue (Million), by Source 2025 & 2033
- Figure 3: Asia Pacific Cosmetic Antioxidants Industry Revenue Share (%), by Source 2025 & 2033
- Figure 4: Asia Pacific Cosmetic Antioxidants Industry Revenue (Million), by Type 2025 & 2033
- Figure 5: Asia Pacific Cosmetic Antioxidants Industry Revenue Share (%), by Type 2025 & 2033
- Figure 6: Asia Pacific Cosmetic Antioxidants Industry Revenue (Million), by Application 2025 & 2033
- Figure 7: Asia Pacific Cosmetic Antioxidants Industry Revenue Share (%), by Application 2025 & 2033
- Figure 8: Asia Pacific Cosmetic Antioxidants Industry Revenue (Million), by Country 2025 & 2033
- Figure 9: Asia Pacific Cosmetic Antioxidants Industry Revenue Share (%), by Country 2025 & 2033
- Figure 10: North America Cosmetic Antioxidants Industry Revenue (Million), by Source 2025 & 2033
- Figure 11: North America Cosmetic Antioxidants Industry Revenue Share (%), by Source 2025 & 2033
- Figure 12: North America Cosmetic Antioxidants Industry Revenue (Million), by Type 2025 & 2033
- Figure 13: North America Cosmetic Antioxidants Industry Revenue Share (%), by Type 2025 & 2033
- Figure 14: North America Cosmetic Antioxidants Industry Revenue (Million), by Application 2025 & 2033
- Figure 15: North America Cosmetic Antioxidants Industry Revenue Share (%), by Application 2025 & 2033
- Figure 16: North America Cosmetic Antioxidants Industry Revenue (Million), by Country 2025 & 2033
- Figure 17: North America Cosmetic Antioxidants Industry Revenue Share (%), by Country 2025 & 2033
- Figure 18: Europe Cosmetic Antioxidants Industry Revenue (Million), by Source 2025 & 2033
- Figure 19: Europe Cosmetic Antioxidants Industry Revenue Share (%), by Source 2025 & 2033
- Figure 20: Europe Cosmetic Antioxidants Industry Revenue (Million), by Type 2025 & 2033
- Figure 21: Europe Cosmetic Antioxidants Industry Revenue Share (%), by Type 2025 & 2033
- Figure 22: Europe Cosmetic Antioxidants Industry Revenue (Million), by Application 2025 & 2033
- Figure 23: Europe Cosmetic Antioxidants Industry Revenue Share (%), by Application 2025 & 2033
- Figure 24: Europe Cosmetic Antioxidants Industry Revenue (Million), by Country 2025 & 2033
- Figure 25: Europe Cosmetic Antioxidants Industry Revenue Share (%), by Country 2025 & 2033
- Figure 26: South America Cosmetic Antioxidants Industry Revenue (Million), by Source 2025 & 2033
- Figure 27: South America Cosmetic Antioxidants Industry Revenue Share (%), by Source 2025 & 2033
- Figure 28: South America Cosmetic Antioxidants Industry Revenue (Million), by Type 2025 & 2033
- Figure 29: South America Cosmetic Antioxidants Industry Revenue Share (%), by Type 2025 & 2033
- Figure 30: South America Cosmetic Antioxidants Industry Revenue (Million), by Application 2025 & 2033
- Figure 31: South America Cosmetic Antioxidants Industry Revenue Share (%), by Application 2025 & 2033
- Figure 32: South America Cosmetic Antioxidants Industry Revenue (Million), by Country 2025 & 2033
- Figure 33: South America Cosmetic Antioxidants Industry Revenue Share (%), by Country 2025 & 2033
- Figure 34: Middle East and Africa Cosmetic Antioxidants Industry Revenue (Million), by Source 2025 & 2033
- Figure 35: Middle East and Africa Cosmetic Antioxidants Industry Revenue Share (%), by Source 2025 & 2033
- Figure 36: Middle East and Africa Cosmetic Antioxidants Industry Revenue (Million), by Type 2025 & 2033
- Figure 37: Middle East and Africa Cosmetic Antioxidants Industry Revenue Share (%), by Type 2025 & 2033
- Figure 38: Middle East and Africa Cosmetic Antioxidants Industry Revenue (Million), by Application 2025 & 2033
- Figure 39: Middle East and Africa Cosmetic Antioxidants Industry Revenue Share (%), by Application 2025 & 2033
- Figure 40: Middle East and Africa Cosmetic Antioxidants Industry Revenue (Million), by Country 2025 & 2033
- Figure 41: Middle East and Africa Cosmetic Antioxidants Industry Revenue Share (%), by Country 2025 & 2033
List of Tables
- Table 1: Global Cosmetic Antioxidants Industry Revenue Million Forecast, by Source 2020 & 2033
- Table 2: Global Cosmetic Antioxidants Industry Revenue Million Forecast, by Type 2020 & 2033
- Table 3: Global Cosmetic Antioxidants Industry Revenue Million Forecast, by Application 2020 & 2033
- Table 4: Global Cosmetic Antioxidants Industry Revenue Million Forecast, by Region 2020 & 2033
- Table 5: Global Cosmetic Antioxidants Industry Revenue Million Forecast, by Source 2020 & 2033
- Table 6: Global Cosmetic Antioxidants Industry Revenue Million Forecast, by Type 2020 & 2033
- Table 7: Global Cosmetic Antioxidants Industry Revenue Million Forecast, by Application 2020 & 2033
- Table 8: Global Cosmetic Antioxidants Industry Revenue Million Forecast, by Country 2020 & 2033
- Table 9: China Cosmetic Antioxidants Industry Revenue (Million) Forecast, by Application 2020 & 2033
- Table 10: India Cosmetic Antioxidants Industry Revenue (Million) Forecast, by Application 2020 & 2033
- Table 11: Japan Cosmetic Antioxidants Industry Revenue (Million) Forecast, by Application 2020 & 2033
- Table 12: South Korea Cosmetic Antioxidants Industry Revenue (Million) Forecast, by Application 2020 & 2033
- Table 13: Rest of Asia Pacific Cosmetic Antioxidants Industry Revenue (Million) Forecast, by Application 2020 & 2033
- Table 14: Global Cosmetic Antioxidants Industry Revenue Million Forecast, by Source 2020 & 2033
- Table 15: Global Cosmetic Antioxidants Industry Revenue Million Forecast, by Type 2020 & 2033
- Table 16: Global Cosmetic Antioxidants Industry Revenue Million Forecast, by Application 2020 & 2033
- Table 17: Global Cosmetic Antioxidants Industry Revenue Million Forecast, by Country 2020 & 2033
- Table 18: United States Cosmetic Antioxidants Industry Revenue (Million) Forecast, by Application 2020 & 2033
- Table 19: Canada Cosmetic Antioxidants Industry Revenue (Million) Forecast, by Application 2020 & 2033
- Table 20: Mexico Cosmetic Antioxidants Industry Revenue (Million) Forecast, by Application 2020 & 2033
- Table 21: Global Cosmetic Antioxidants Industry Revenue Million Forecast, by Source 2020 & 2033
- Table 22: Global Cosmetic Antioxidants Industry Revenue Million Forecast, by Type 2020 & 2033
- Table 23: Global Cosmetic Antioxidants Industry Revenue Million Forecast, by Application 2020 & 2033
- Table 24: Global Cosmetic Antioxidants Industry Revenue Million Forecast, by Country 2020 & 2033
- Table 25: Germany Cosmetic Antioxidants Industry Revenue (Million) Forecast, by Application 2020 & 2033
- Table 26: United Kingdom Cosmetic Antioxidants Industry Revenue (Million) Forecast, by Application 2020 & 2033
- Table 27: Italy Cosmetic Antioxidants Industry Revenue (Million) Forecast, by Application 2020 & 2033
- Table 28: France Cosmetic Antioxidants Industry Revenue (Million) Forecast, by Application 2020 & 2033
- Table 29: Rest of Europe Cosmetic Antioxidants Industry Revenue (Million) Forecast, by Application 2020 & 2033
- Table 30: Global Cosmetic Antioxidants Industry Revenue Million Forecast, by Source 2020 & 2033
- Table 31: Global Cosmetic Antioxidants Industry Revenue Million Forecast, by Type 2020 & 2033
- Table 32: Global Cosmetic Antioxidants Industry Revenue Million Forecast, by Application 2020 & 2033
- Table 33: Global Cosmetic Antioxidants Industry Revenue Million Forecast, by Country 2020 & 2033
- Table 34: Brazil Cosmetic Antioxidants Industry Revenue (Million) Forecast, by Application 2020 & 2033
- Table 35: Argentina Cosmetic Antioxidants Industry Revenue (Million) Forecast, by Application 2020 & 2033
- Table 36: Rest of South America Cosmetic Antioxidants Industry Revenue (Million) Forecast, by Application 2020 & 2033
- Table 37: Global Cosmetic Antioxidants Industry Revenue Million Forecast, by Source 2020 & 2033
- Table 38: Global Cosmetic Antioxidants Industry Revenue Million Forecast, by Type 2020 & 2033
- Table 39: Global Cosmetic Antioxidants Industry Revenue Million Forecast, by Application 2020 & 2033
- Table 40: Global Cosmetic Antioxidants Industry Revenue Million Forecast, by Country 2020 & 2033
- Table 41: Saudi Arabia Cosmetic Antioxidants Industry Revenue (Million) Forecast, by Application 2020 & 2033
- Table 42: South Africa Cosmetic Antioxidants Industry Revenue (Million) Forecast, by Application 2020 & 2033
- Table 43: Rest of Middle East and Africa Cosmetic Antioxidants Industry Revenue (Million) Forecast, by Application 2020 & 2033
Frequently Asked Questions
1. What is the projected Compound Annual Growth Rate (CAGR) of the Cosmetic Antioxidants Industry?
The projected CAGR is approximately 5.95%.
2. Which companies are prominent players in the Cosmetic Antioxidants Industry?
Key companies in the market include Koninklijke DSM, Lonza Group, Kemin Industries, Evonik Industries AG, Provital Group, Croda International Plc, BASF SE, Eastman Chemical Company, BTSA Biotecnologias Aplicadas, Wacker Chemie AG*List Not Exhaustive.
3. What are the main segments of the Cosmetic Antioxidants Industry?
The market segments include Source, Type, Application.
4. Can you provide details about the market size?
The market size is estimated to be USD 139.23 Million as of 2022.
5. What are some drivers contributing to market growth?
Rise in Online Purcahse of Cosmetics; Increasing Use of Beauty Products and Personal Care Products; Other Drivers.
6. What are the notable trends driving market growth?
Increasing Usage of Natural Antioxidants in Cosmetics Products.
7. Are there any restraints impacting market growth?
High Cost of Natural Antioxidants; Other Restraints.
8. Can you provide examples of recent developments in the market?
October 2023: BASF's Care Chemicals division is investing in a new plant to produce emollient specialties at its Düsseldorf site targeted for skin and sun protection products.
9. What pricing options are available for accessing the report?
Pricing options include single-user, multi-user, and enterprise licenses priced at USD 4750, USD 5250, and USD 8750 respectively.
10. Is the market size provided in terms of value or volume?
The market size is provided in terms of value, measured in Million.
11. Are there any specific market keywords associated with the report?
Yes, the market keyword associated with the report is "Cosmetic Antioxidants Industry," which aids in identifying and referencing the specific market segment covered.
12. How do I determine which pricing option suits my needs best?
The pricing options vary based on user requirements and access needs. Individual users may opt for single-user licenses, while businesses requiring broader access may choose multi-user or enterprise licenses for cost-effective access to the report.
13. Are there any additional resources or data provided in the Cosmetic Antioxidants Industry report?
While the report offers comprehensive insights, it's advisable to review the specific contents or supplementary materials provided to ascertain if additional resources or data are available.
14. How can I stay updated on further developments or reports in the Cosmetic Antioxidants Industry?
To stay informed about further developments, trends, and reports in the Cosmetic Antioxidants Industry, consider subscribing to industry newsletters, following relevant companies and organizations, or regularly checking reputable industry news sources and publications.
Methodology
Step 1 - Identification of Relevant Samples Size from Population Database


Step 2 - Approaches for Defining Global Market Size (Value, Volume* & Price*)

Note*: In applicable scenarios
Step 3 - Data Sources
Primary Research
- Web Analytics
- Survey Reports
- Research Institute
- Latest Research Reports
- Opinion Leaders
Secondary Research
- Annual Reports
- White Paper
- Latest Press Release
- Industry Association
- Paid Database
- Investor Presentations

Step 4 - Data Triangulation
Involves using different sources of information in order to increase the validity of a study
These sources are likely to be stakeholders in a program - participants, other researchers, program staff, other community members, and so on.
Then we put all data in single framework & apply various statistical tools to find out the dynamic on the market.
During the analysis stage, feedback from the stakeholder groups would be compared to determine areas of agreement as well as areas of divergence