

Key Insights
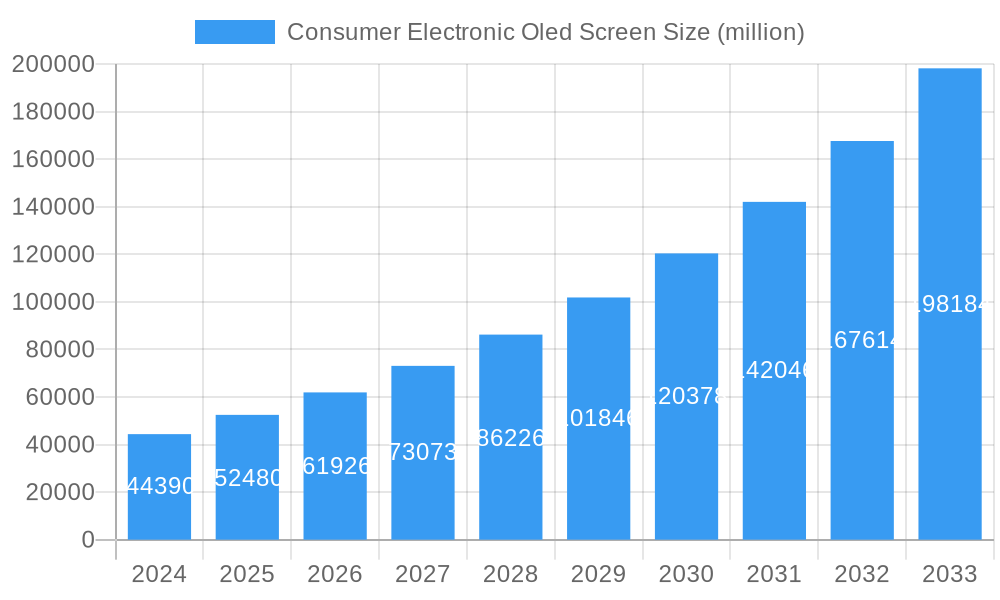
The global Consumer Electronic OLED Screen market is poised for substantial expansion, driven by the insatiable demand for superior visual experiences across a wide array of devices. With an estimated market size of $44.39 billion in 2024, the industry is set to experience a remarkable CAGR of 18% during the forecast period of 2025-2033. This robust growth is primarily fueled by the increasing adoption of OLED technology in smartphones, tablets, and televisions, where consumers increasingly prioritize vibrant colors, deep blacks, and ultra-fast response times. The superior energy efficiency and flexible form factors offered by OLED panels further accelerate their integration into next-generation consumer electronics, including wearables and potentially augmented reality devices. The ongoing technological advancements in manufacturing processes and material science are also contributing to reduced production costs, making OLED screens more accessible and driving wider market penetration.
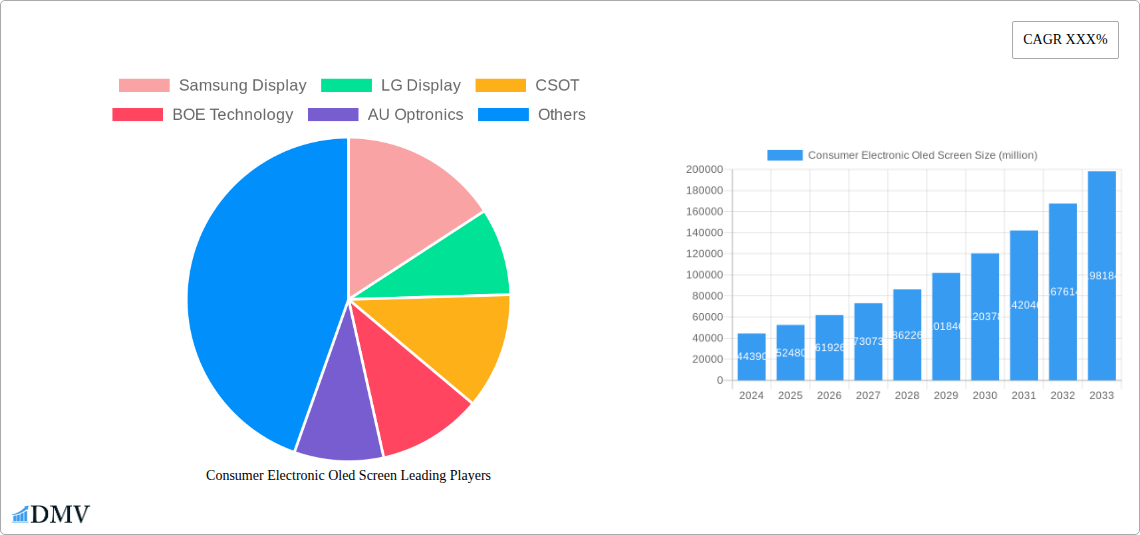
Consumer Electronic Oled Screen Market Size (In Billion)
The market's trajectory is further shaped by emerging trends such as the development of foldable and rollable OLED displays, which are revolutionizing product design and user interaction. Mini-LED and Micro-LED technologies are also gaining traction as complementary or alternative solutions, offering enhanced brightness and contrast ratios, thereby intensifying competition and driving innovation. While the widespread adoption of OLED screens is largely unhindered, potential restraints include the initial higher manufacturing costs compared to traditional LCDs, although this gap is rapidly narrowing. Supply chain complexities and the need for specialized manufacturing equipment can also present challenges. Key players like Samsung Display, LG Display, and BOE Technology are at the forefront of innovation, investing heavily in research and development to maintain their competitive edge and cater to the evolving demands of the global consumer electronics landscape. The Asia Pacific region, particularly China and South Korea, is expected to remain a dominant force in both production and consumption due to its strong presence in electronics manufacturing and a large consumer base.
Consumer Electronic Oled Screen Company Market Share
Consumer Electronic Oled Screen Market: Comprehensive Insights and Future Outlook
This in-depth market report provides an unparalleled analysis of the global Consumer Electronic OLED Screen market, offering critical intelligence for stakeholders aiming to navigate this dynamic and rapidly evolving industry. Spanning a study period from 2019 to 2033, with a base year of 2025 and an extensive forecast period of 2025–2033, this report meticulously dissects market composition, industry evolution, regional dominance, product innovations, growth drivers, obstacles, opportunities, key players, and strategic forecasts. Leverage this report to understand the billion-dollar potential and make informed strategic decisions.
Consumer Electronic Oled Screen Market Composition & Trends
The Consumer Electronic OLED Screen market is characterized by intense competition and significant innovation, with Samsung Display and LG Display currently holding substantial market share, estimated to be in the billions of dollars. The market's concentration is moderately high, driven by the substantial capital investment required for OLED manufacturing. Key innovation catalysts include advancements in material science, energy efficiency, and display resolution, pushing the boundaries of visual fidelity across Smartphone, TV, Tablet, and Laptop applications. Regulatory landscapes, while evolving, are largely focused on environmental impact and safety standards, with limited direct market intervention impacting billion-dollar sales. Substitute products, primarily advanced LCD technologies, continue to offer a price-competitive alternative, though OLED's superior contrast and color reproduction remain key differentiators. End-user profiles range from tech-savvy consumers seeking premium visual experiences to enterprise clients demanding high-performance displays for professional applications. Mergers and acquisitions (M&A) activities, while not always publicly disclosed with precise billion-dollar figures, are prevalent as companies seek to consolidate technological expertise and expand market reach. For instance, strategic partnerships and acquisitions in the OLED material supply chain are critical for securing competitive advantage, with estimated deal values potentially reaching into the hundreds of billions. The market also sees significant R&D investment from emerging players like CSOT and BOE Technology, signaling a shift towards greater diversification and potential disruption.
Consumer Electronic Oled Screen Industry Evolution
The Consumer Electronic OLED Screen industry has undergone a dramatic evolution, driven by relentless technological innovation and burgeoning consumer demand for superior display experiences. From its nascent stages, the market has witnessed exponential growth, with its valuation projected to reach staggering billions by the end of the forecast period. Early adoption was primarily concentrated in high-end Smartphone segments, where the vivid colors and deep blacks of AMOLED screens offered a significant upgrade over traditional LCD. This initial success paved the way for its expansion into other applications. Technological advancements have been the bedrock of this evolution. The transition from PMOLED (Passive-Matrix OLED) to AMOLED (Active-Matrix OLED) represented a quantum leap, enabling higher resolutions, faster refresh rates, and improved power efficiency. Furthermore, continuous research into new emissive materials and manufacturing processes has led to breakthroughs in color accuracy, brightness, and panel longevity, directly impacting the billion-dollar revenue streams. Consumer demand has consistently shifted towards thinner, lighter, and more immersive displays. The desire for foldable and flexible screens in smartphones and tablets, for example, has spurred significant R&D and manufacturing investment, creating entirely new product categories with billions in potential sales. The increasing adoption of OLED technology in TV panels has revolutionized home entertainment, offering unparalleled picture quality that drives premium pricing and substantial market growth. The expansion into Laptop and Tablet screens further broadens the market reach, catering to both professional and consumer needs for high-fidelity visuals. Industry growth rates have consistently outpaced broader consumer electronics markets, reflecting the compelling value proposition of OLED technology, with projected annual growth rates in the high billions. The sustained investment in next-generation OLED technologies, such as QD-OLED and microLED, signals a future where display performance will continue to be a key differentiator, further fueling billion-dollar market expansion.
Leading Regions, Countries, or Segments in Consumer Electronic Oled Screen
The Consumer Electronic OLED Screen market exhibits distinct regional and segmental dominance, driven by a confluence of technological prowess, robust manufacturing capabilities, and substantial market demand. Within the Application segment, Smartphone screens currently lead in market share, commanding billions in revenue due to their ubiquitous nature and the premium visual experience OLED offers. This dominance is closely followed by TV applications, where OLED's unparalleled picture quality has established it as the benchmark for high-end home entertainment, generating significant billion-dollar sales. The Type segment is overwhelmingly dominated by AMOLED Screen technology. Its superior performance characteristics, including faster response times, higher contrast ratios, and greater power efficiency compared to PMOLED, have made it the preferred choice for most advanced consumer electronics.
- Dominant Application: Smartphone Screens
- Key Drivers: Pervasive consumer ownership, demand for advanced features (foldable displays, high refresh rates), and the ability of OLED to deliver a premium visual experience justify premium pricing and billion-dollar sales.
- In-depth Analysis: Leading smartphone manufacturers heavily rely on OLED technology for their flagship models, driving massive production volumes and R&D investment. The continuous innovation in smartphone design, such as bezel-less displays and foldable form factors, is intrinsically linked to the advancements in OLED manufacturing.
- Dominant Type: AMOLED Screen
- Key Drivers: Superior picture quality (contrast, color saturation, true blacks), faster refresh rates, and greater power efficiency make AMOLED the undisputed leader for high-performance displays across all applications.
- In-depth Analysis: The technological maturity of AMOLED production processes, coupled with the benefits it brings to end-user devices, ensures its continued dominance. While PMOLED finds niche applications, AMOLED's billion-dollar market penetration is secured by its versatility and performance.
- Leading Regions: East Asia (South Korea, China, Japan)
- Key Drivers: Strong presence of key manufacturers like Samsung Display, LG Display, CSOT, and BOE Technology, coupled with significant R&D investment and large domestic consumer markets.
- In-depth Analysis: These regions are the epicenters of OLED panel manufacturing and innovation. Government support, substantial private sector investment, and a highly skilled workforce have propelled them to the forefront, driving global supply and influencing billion-dollar market trends.
Consumer Electronic Oled Screen Product Innovations
Recent product innovations in consumer electronic OLED screens are pushing the boundaries of visual technology, delivering unparalleled performance and unique user experiences. Advancements in emissive materials and panel architecture have led to significant improvements in brightness, color accuracy, and energy efficiency, impacting billion-dollar product sales. The development of ultra-thin, flexible, and even rollable OLED displays has revolutionized device design, enabling foldable smartphones and curved television screens. Furthermore, the integration of quantum dot technology with OLED (QD-OLED) is achieving even wider color gamuts and enhanced contrast, setting new benchmarks for visual fidelity. These innovations are not merely incremental but represent transformative leaps, directly contributing to the premium value and billion-dollar market potential of these displays.
Propelling Factors for Consumer Electronic Oled Screen Growth
Several key factors are propelling the growth of the Consumer Electronic OLED Screen market, driving its valuation into the billions. Firstly, technological advancements in material science, manufacturing processes, and display capabilities are continuously enhancing performance, making OLED the preferred choice for premium devices. Secondly, increasing consumer demand for immersive, high-quality visual experiences in smartphones, televisions, and other electronic gadgets fuels market expansion. The adoption of OLED in new form factors like foldable and rollable devices further amplifies this demand. Thirdly, falling manufacturing costs and economies of scale are making OLED more accessible for a wider range of applications, driving higher sales volumes. Finally, strategic investments by major players and supportive government policies in key regions are fostering innovation and production capacity, ensuring sustained growth for this billion-dollar industry.
Obstacles in the Consumer Electronic Oled Screen Market
Despite its robust growth, the Consumer Electronic OLED Screen market faces several significant obstacles that could impact its billion-dollar trajectory. High manufacturing costs remain a primary concern, particularly for smaller manufacturers, though these are gradually decreasing. Burn-in or image retention issues, while significantly improved, still pose a perceived risk for some consumers and applications, potentially limiting adoption in certain segments. Supply chain vulnerabilities, as demonstrated by global chip shortages and raw material price fluctuations, can disrupt production and impact cost projections, with potential impacts on billions in revenue. Furthermore, intense competition from advanced LCD technologies and emerging display solutions like microLED presents a constant challenge, requiring continuous innovation to maintain market share.
Future Opportunities in Consumer Electronic Oled Screen
The Consumer Electronic OLED Screen market is ripe with future opportunities, promising continued billion-dollar growth. The expansion into new application areas, such as automotive displays, augmented and virtual reality (AR/VR) headsets, and smart wearables, presents significant untapped potential. The ongoing development of next-generation OLED technologies, including QD-OLED and tandem OLED structures, will offer even superior performance, driving demand for premium devices. The increasing focus on sustainability and energy efficiency in electronic devices creates opportunities for OLED’s inherent power-saving capabilities to be further leveraged. Moreover, the growing trend towards personalized and interactive displays in smart homes and public spaces offers a fertile ground for innovative OLED applications.
Major Players in the Consumer Electronic Oled Screen Ecosystem
- Samsung Display
- LG Display
- CSOT
- BOE Technology
- AU Optronics
- EverDisplay Optronics
- RiTdisplay
- Visionox
- Tianma Micro-electronics
- Truly International
- Japan Display
- OTI Lumionics
- Sharp Corporation
Key Developments in Consumer Electronic Oled Screen Industry
- 2023/2024: Significant advancements in QD-OLED technology leading to improved color volume and brightness in high-end TV panels, contributing to billion-dollar sales.
- 2023/2024: Increased adoption of foldable OLED displays in smartphones and the emergence of new foldable form factors, driving innovation and market expansion in the billions.
- 2022/2023: Major manufacturers like LG Display and Samsung Display investing billions in expanding their OLED production capacity to meet rising demand.
- 2022/2023: Enhanced encapsulation techniques and material science improvements leading to reduced risk of burn-in for OLED displays, boosting consumer confidence and sales in the billions.
- 2021/2022: Growth in OLED adoption for laptop and tablet screens, expanding the market beyond smartphones and TVs into new billion-dollar revenue streams.
Strategic Consumer Electronic Oled Screen Market Forecast
The strategic outlook for the Consumer Electronic OLED Screen market remains exceptionally strong, with a projected trajectory towards multi-billion dollar valuations. Continued innovation in material science and manufacturing will drive down costs and improve performance, expanding OLED's reach into new applications like automotive and AR/VR. The insatiable consumer demand for superior visual experiences, coupled with the unique capabilities of foldable and flexible displays, will continue to fuel growth. Strategic partnerships and ongoing R&D investments by leading players will solidify market dominance and foster the development of next-generation display technologies, ensuring a vibrant and expansive future for this crucial sector of the consumer electronics industry.
Consumer Electronic Oled Screen Segmentation
-
1. Application
- 1.1. Tablet
- 1.2. Laptop
- 1.3. TV
- 1.4. Smartphone
- 1.5. Others
-
2. Type
- 2.1. AMOLED Screen
- 2.2. PMOLED Screen
Consumer Electronic Oled Screen Segmentation By Geography
-
1. North America
- 1.1. United States
- 1.2. Canada
- 1.3. Mexico
-
2. South America
- 2.1. Brazil
- 2.2. Argentina
- 2.3. Rest of South America
-
3. Europe
- 3.1. United Kingdom
- 3.2. Germany
- 3.3. France
- 3.4. Italy
- 3.5. Spain
- 3.6. Russia
- 3.7. Benelux
- 3.8. Nordics
- 3.9. Rest of Europe
-
4. Middle East & Africa
- 4.1. Turkey
- 4.2. Israel
- 4.3. GCC
- 4.4. North Africa
- 4.5. South Africa
- 4.6. Rest of Middle East & Africa
-
5. Asia Pacific
- 5.1. China
- 5.2. India
- 5.3. Japan
- 5.4. South Korea
- 5.5. ASEAN
- 5.6. Oceania
- 5.7. Rest of Asia Pacific
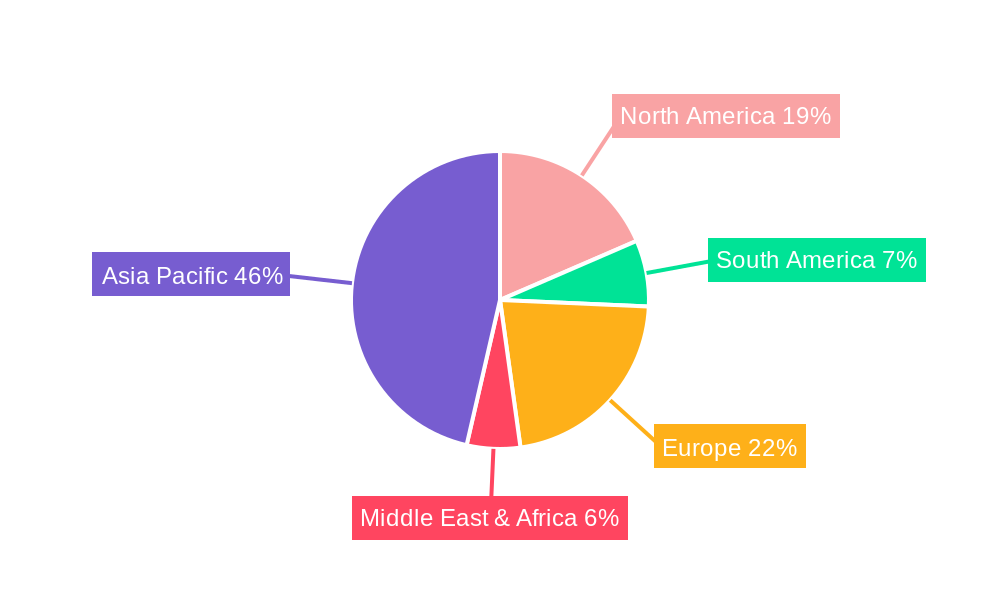
Consumer Electronic Oled Screen Regional Market Share
Geographic Coverage of Consumer Electronic Oled Screen
Consumer Electronic Oled Screen REPORT HIGHLIGHTS
| Aspects | Details |
|---|---|
| Study Period | 2020-2034 |
| Base Year | 2025 |
| Estimated Year | 2026 |
| Forecast Period | 2026-2034 |
| Historical Period | 2020-2025 |
| Growth Rate | CAGR of 18% from 2020-2034 |
| Segmentation |
|
Table of Contents
- 1. Introduction
- 1.1. Research Scope
- 1.2. Market Segmentation
- 1.3. Research Objective
- 1.4. Definitions and Assumptions
- 2. Executive Summary
- 2.1. Market Snapshot
- 3. Market Dynamics
- 3.1. Market Drivers
- 3.2. Market Restrains
- 3.3. Market Trends
- 3.4. Market Opportunities
- 4. Market Factor Analysis
- 4.1. Porters Five Forces
- 4.1.1. Bargaining Power of Suppliers
- 4.1.2. Bargaining Power of Buyers
- 4.1.3. Threat of New Entrants
- 4.1.4. Threat of Substitutes
- 4.1.5. Competitive Rivalry
- 4.2. PESTEL analysis
- 4.3. BCG Analysis
- 4.3.1. Stars (High Growth, High Market Share)
- 4.3.2. Cash Cows (Low Growth, High Market Share)
- 4.3.3. Question Mark (High Growth, Low Market Share)
- 4.3.4. Dogs (Low Growth, Low Market Share)
- 4.4. Ansoff Matrix Analysis
- 4.5. Supply Chain Analysis
- 4.6. Regulatory Landscape
- 4.7. Current Market Potential and Opportunity Assessment (TAM–SAM–SOM Framework)
- 4.8. DMV Analyst Note
- 4.1. Porters Five Forces
- 5. Market Analysis, Insights and Forecast 2021-2033
- 5.1. Market Analysis, Insights and Forecast - by Application
- 5.1.1. Tablet
- 5.1.2. Laptop
- 5.1.3. TV
- 5.1.4. Smartphone
- 5.1.5. Others
- 5.2. Market Analysis, Insights and Forecast - by Type
- 5.2.1. AMOLED Screen
- 5.2.2. PMOLED Screen
- 5.3. Market Analysis, Insights and Forecast - by Region
- 5.3.1. North America
- 5.3.2. South America
- 5.3.3. Europe
- 5.3.4. Middle East & Africa
- 5.3.5. Asia Pacific
- 5.1. Market Analysis, Insights and Forecast - by Application
- 6. Global Consumer Electronic Oled Screen Analysis, Insights and Forecast, 2021-2033
- 6.1. Market Analysis, Insights and Forecast - by Application
- 6.1.1. Tablet
- 6.1.2. Laptop
- 6.1.3. TV
- 6.1.4. Smartphone
- 6.1.5. Others
- 6.2. Market Analysis, Insights and Forecast - by Type
- 6.2.1. AMOLED Screen
- 6.2.2. PMOLED Screen
- 6.1. Market Analysis, Insights and Forecast - by Application
- 7. North America Consumer Electronic Oled Screen Analysis, Insights and Forecast, 2020-2032
- 7.1. Market Analysis, Insights and Forecast - by Application
- 7.1.1. Tablet
- 7.1.2. Laptop
- 7.1.3. TV
- 7.1.4. Smartphone
- 7.1.5. Others
- 7.2. Market Analysis, Insights and Forecast - by Type
- 7.2.1. AMOLED Screen
- 7.2.2. PMOLED Screen
- 7.1. Market Analysis, Insights and Forecast - by Application
- 8. South America Consumer Electronic Oled Screen Analysis, Insights and Forecast, 2020-2032
- 8.1. Market Analysis, Insights and Forecast - by Application
- 8.1.1. Tablet
- 8.1.2. Laptop
- 8.1.3. TV
- 8.1.4. Smartphone
- 8.1.5. Others
- 8.2. Market Analysis, Insights and Forecast - by Type
- 8.2.1. AMOLED Screen
- 8.2.2. PMOLED Screen
- 8.1. Market Analysis, Insights and Forecast - by Application
- 9. Europe Consumer Electronic Oled Screen Analysis, Insights and Forecast, 2020-2032
- 9.1. Market Analysis, Insights and Forecast - by Application
- 9.1.1. Tablet
- 9.1.2. Laptop
- 9.1.3. TV
- 9.1.4. Smartphone
- 9.1.5. Others
- 9.2. Market Analysis, Insights and Forecast - by Type
- 9.2.1. AMOLED Screen
- 9.2.2. PMOLED Screen
- 9.1. Market Analysis, Insights and Forecast - by Application
- 10. Middle East & Africa Consumer Electronic Oled Screen Analysis, Insights and Forecast, 2020-2032
- 10.1. Market Analysis, Insights and Forecast - by Application
- 10.1.1. Tablet
- 10.1.2. Laptop
- 10.1.3. TV
- 10.1.4. Smartphone
- 10.1.5. Others
- 10.2. Market Analysis, Insights and Forecast - by Type
- 10.2.1. AMOLED Screen
- 10.2.2. PMOLED Screen
- 10.1. Market Analysis, Insights and Forecast - by Application
- 11. Asia Pacific Consumer Electronic Oled Screen Analysis, Insights and Forecast, 2020-2032
- 11.1. Market Analysis, Insights and Forecast - by Application
- 11.1.1. Tablet
- 11.1.2. Laptop
- 11.1.3. TV
- 11.1.4. Smartphone
- 11.1.5. Others
- 11.2. Market Analysis, Insights and Forecast - by Type
- 11.2.1. AMOLED Screen
- 11.2.2. PMOLED Screen
- 11.1. Market Analysis, Insights and Forecast - by Application
- 12. Competitive Analysis
- 12.1. Company Profiles
- 12.1.1 Samsung Display
- 12.1.1.1. Company Overview
- 12.1.1.2. Products
- 12.1.1.3. Company Financials
- 12.1.1.4. SWOT Analysis
- 12.1.2 LG Display
- 12.1.2.1. Company Overview
- 12.1.2.2. Products
- 12.1.2.3. Company Financials
- 12.1.2.4. SWOT Analysis
- 12.1.3 CSOT
- 12.1.3.1. Company Overview
- 12.1.3.2. Products
- 12.1.3.3. Company Financials
- 12.1.3.4. SWOT Analysis
- 12.1.4 BOE Technology
- 12.1.4.1. Company Overview
- 12.1.4.2. Products
- 12.1.4.3. Company Financials
- 12.1.4.4. SWOT Analysis
- 12.1.5 AU Optronics
- 12.1.5.1. Company Overview
- 12.1.5.2. Products
- 12.1.5.3. Company Financials
- 12.1.5.4. SWOT Analysis
- 12.1.6 EverDisplay Optronics
- 12.1.6.1. Company Overview
- 12.1.6.2. Products
- 12.1.6.3. Company Financials
- 12.1.6.4. SWOT Analysis
- 12.1.7 RiTdisplay
- 12.1.7.1. Company Overview
- 12.1.7.2. Products
- 12.1.7.3. Company Financials
- 12.1.7.4. SWOT Analysis
- 12.1.8 Visionox
- 12.1.8.1. Company Overview
- 12.1.8.2. Products
- 12.1.8.3. Company Financials
- 12.1.8.4. SWOT Analysis
- 12.1.9 Tianma Micro-electronics
- 12.1.9.1. Company Overview
- 12.1.9.2. Products
- 12.1.9.3. Company Financials
- 12.1.9.4. SWOT Analysis
- 12.1.10 Truly International
- 12.1.10.1. Company Overview
- 12.1.10.2. Products
- 12.1.10.3. Company Financials
- 12.1.10.4. SWOT Analysis
- 12.1.11 Japan Display
- 12.1.11.1. Company Overview
- 12.1.11.2. Products
- 12.1.11.3. Company Financials
- 12.1.11.4. SWOT Analysis
- 12.1.12 OTI Lumionics
- 12.1.12.1. Company Overview
- 12.1.12.2. Products
- 12.1.12.3. Company Financials
- 12.1.12.4. SWOT Analysis
- 12.1.13 Sharp Corporation
- 12.1.13.1. Company Overview
- 12.1.13.2. Products
- 12.1.13.3. Company Financials
- 12.1.13.4. SWOT Analysis
- 12.1.1 Samsung Display
- 12.2. Market Entropy
- 12.2.1 Company's Key Areas Served
- 12.2.2 Recent Developments
- 12.3. Company Market Share Analysis 2025
- 12.3.1 Top 5 Companies Market Share Analysis
- 12.3.2 Top 3 Companies Market Share Analysis
- 12.4. List of Potential Customers
- 13. Research Methodology
List of Figures
- Figure 1: Global Consumer Electronic Oled Screen Revenue Breakdown (undefined, %) by Region 2025 & 2033
- Figure 2: North America Consumer Electronic Oled Screen Revenue (undefined), by Application 2025 & 2033
- Figure 3: North America Consumer Electronic Oled Screen Revenue Share (%), by Application 2025 & 2033
- Figure 4: North America Consumer Electronic Oled Screen Revenue (undefined), by Type 2025 & 2033
- Figure 5: North America Consumer Electronic Oled Screen Revenue Share (%), by Type 2025 & 2033
- Figure 6: North America Consumer Electronic Oled Screen Revenue (undefined), by Country 2025 & 2033
- Figure 7: North America Consumer Electronic Oled Screen Revenue Share (%), by Country 2025 & 2033
- Figure 8: South America Consumer Electronic Oled Screen Revenue (undefined), by Application 2025 & 2033
- Figure 9: South America Consumer Electronic Oled Screen Revenue Share (%), by Application 2025 & 2033
- Figure 10: South America Consumer Electronic Oled Screen Revenue (undefined), by Type 2025 & 2033
- Figure 11: South America Consumer Electronic Oled Screen Revenue Share (%), by Type 2025 & 2033
- Figure 12: South America Consumer Electronic Oled Screen Revenue (undefined), by Country 2025 & 2033
- Figure 13: South America Consumer Electronic Oled Screen Revenue Share (%), by Country 2025 & 2033
- Figure 14: Europe Consumer Electronic Oled Screen Revenue (undefined), by Application 2025 & 2033
- Figure 15: Europe Consumer Electronic Oled Screen Revenue Share (%), by Application 2025 & 2033
- Figure 16: Europe Consumer Electronic Oled Screen Revenue (undefined), by Type 2025 & 2033
- Figure 17: Europe Consumer Electronic Oled Screen Revenue Share (%), by Type 2025 & 2033
- Figure 18: Europe Consumer Electronic Oled Screen Revenue (undefined), by Country 2025 & 2033
- Figure 19: Europe Consumer Electronic Oled Screen Revenue Share (%), by Country 2025 & 2033
- Figure 20: Middle East & Africa Consumer Electronic Oled Screen Revenue (undefined), by Application 2025 & 2033
- Figure 21: Middle East & Africa Consumer Electronic Oled Screen Revenue Share (%), by Application 2025 & 2033
- Figure 22: Middle East & Africa Consumer Electronic Oled Screen Revenue (undefined), by Type 2025 & 2033
- Figure 23: Middle East & Africa Consumer Electronic Oled Screen Revenue Share (%), by Type 2025 & 2033
- Figure 24: Middle East & Africa Consumer Electronic Oled Screen Revenue (undefined), by Country 2025 & 2033
- Figure 25: Middle East & Africa Consumer Electronic Oled Screen Revenue Share (%), by Country 2025 & 2033
- Figure 26: Asia Pacific Consumer Electronic Oled Screen Revenue (undefined), by Application 2025 & 2033
- Figure 27: Asia Pacific Consumer Electronic Oled Screen Revenue Share (%), by Application 2025 & 2033
- Figure 28: Asia Pacific Consumer Electronic Oled Screen Revenue (undefined), by Type 2025 & 2033
- Figure 29: Asia Pacific Consumer Electronic Oled Screen Revenue Share (%), by Type 2025 & 2033
- Figure 30: Asia Pacific Consumer Electronic Oled Screen Revenue (undefined), by Country 2025 & 2033
- Figure 31: Asia Pacific Consumer Electronic Oled Screen Revenue Share (%), by Country 2025 & 2033
List of Tables
- Table 1: Global Consumer Electronic Oled Screen Revenue undefined Forecast, by Application 2020 & 2033
- Table 2: Global Consumer Electronic Oled Screen Revenue undefined Forecast, by Type 2020 & 2033
- Table 3: Global Consumer Electronic Oled Screen Revenue undefined Forecast, by Region 2020 & 2033
- Table 4: Global Consumer Electronic Oled Screen Revenue undefined Forecast, by Application 2020 & 2033
- Table 5: Global Consumer Electronic Oled Screen Revenue undefined Forecast, by Type 2020 & 2033
- Table 6: Global Consumer Electronic Oled Screen Revenue undefined Forecast, by Country 2020 & 2033
- Table 7: United States Consumer Electronic Oled Screen Revenue (undefined) Forecast, by Application 2020 & 2033
- Table 8: Canada Consumer Electronic Oled Screen Revenue (undefined) Forecast, by Application 2020 & 2033
- Table 9: Mexico Consumer Electronic Oled Screen Revenue (undefined) Forecast, by Application 2020 & 2033
- Table 10: Global Consumer Electronic Oled Screen Revenue undefined Forecast, by Application 2020 & 2033
- Table 11: Global Consumer Electronic Oled Screen Revenue undefined Forecast, by Type 2020 & 2033
- Table 12: Global Consumer Electronic Oled Screen Revenue undefined Forecast, by Country 2020 & 2033
- Table 13: Brazil Consumer Electronic Oled Screen Revenue (undefined) Forecast, by Application 2020 & 2033
- Table 14: Argentina Consumer Electronic Oled Screen Revenue (undefined) Forecast, by Application 2020 & 2033
- Table 15: Rest of South America Consumer Electronic Oled Screen Revenue (undefined) Forecast, by Application 2020 & 2033
- Table 16: Global Consumer Electronic Oled Screen Revenue undefined Forecast, by Application 2020 & 2033
- Table 17: Global Consumer Electronic Oled Screen Revenue undefined Forecast, by Type 2020 & 2033
- Table 18: Global Consumer Electronic Oled Screen Revenue undefined Forecast, by Country 2020 & 2033
- Table 19: United Kingdom Consumer Electronic Oled Screen Revenue (undefined) Forecast, by Application 2020 & 2033
- Table 20: Germany Consumer Electronic Oled Screen Revenue (undefined) Forecast, by Application 2020 & 2033
- Table 21: France Consumer Electronic Oled Screen Revenue (undefined) Forecast, by Application 2020 & 2033
- Table 22: Italy Consumer Electronic Oled Screen Revenue (undefined) Forecast, by Application 2020 & 2033
- Table 23: Spain Consumer Electronic Oled Screen Revenue (undefined) Forecast, by Application 2020 & 2033
- Table 24: Russia Consumer Electronic Oled Screen Revenue (undefined) Forecast, by Application 2020 & 2033
- Table 25: Benelux Consumer Electronic Oled Screen Revenue (undefined) Forecast, by Application 2020 & 2033
- Table 26: Nordics Consumer Electronic Oled Screen Revenue (undefined) Forecast, by Application 2020 & 2033
- Table 27: Rest of Europe Consumer Electronic Oled Screen Revenue (undefined) Forecast, by Application 2020 & 2033
- Table 28: Global Consumer Electronic Oled Screen Revenue undefined Forecast, by Application 2020 & 2033
- Table 29: Global Consumer Electronic Oled Screen Revenue undefined Forecast, by Type 2020 & 2033
- Table 30: Global Consumer Electronic Oled Screen Revenue undefined Forecast, by Country 2020 & 2033
- Table 31: Turkey Consumer Electronic Oled Screen Revenue (undefined) Forecast, by Application 2020 & 2033
- Table 32: Israel Consumer Electronic Oled Screen Revenue (undefined) Forecast, by Application 2020 & 2033
- Table 33: GCC Consumer Electronic Oled Screen Revenue (undefined) Forecast, by Application 2020 & 2033
- Table 34: North Africa Consumer Electronic Oled Screen Revenue (undefined) Forecast, by Application 2020 & 2033
- Table 35: South Africa Consumer Electronic Oled Screen Revenue (undefined) Forecast, by Application 2020 & 2033
- Table 36: Rest of Middle East & Africa Consumer Electronic Oled Screen Revenue (undefined) Forecast, by Application 2020 & 2033
- Table 37: Global Consumer Electronic Oled Screen Revenue undefined Forecast, by Application 2020 & 2033
- Table 38: Global Consumer Electronic Oled Screen Revenue undefined Forecast, by Type 2020 & 2033
- Table 39: Global Consumer Electronic Oled Screen Revenue undefined Forecast, by Country 2020 & 2033
- Table 40: China Consumer Electronic Oled Screen Revenue (undefined) Forecast, by Application 2020 & 2033
- Table 41: India Consumer Electronic Oled Screen Revenue (undefined) Forecast, by Application 2020 & 2033
- Table 42: Japan Consumer Electronic Oled Screen Revenue (undefined) Forecast, by Application 2020 & 2033
- Table 43: South Korea Consumer Electronic Oled Screen Revenue (undefined) Forecast, by Application 2020 & 2033
- Table 44: ASEAN Consumer Electronic Oled Screen Revenue (undefined) Forecast, by Application 2020 & 2033
- Table 45: Oceania Consumer Electronic Oled Screen Revenue (undefined) Forecast, by Application 2020 & 2033
- Table 46: Rest of Asia Pacific Consumer Electronic Oled Screen Revenue (undefined) Forecast, by Application 2020 & 2033
Frequently Asked Questions
1. What is the projected Compound Annual Growth Rate (CAGR) of the Consumer Electronic Oled Screen?
The projected CAGR is approximately 18%.
2. Which companies are prominent players in the Consumer Electronic Oled Screen?
Key companies in the market include Samsung Display, LG Display, CSOT, BOE Technology, AU Optronics, EverDisplay Optronics, RiTdisplay, Visionox, Tianma Micro-electronics, Truly International, Japan Display, OTI Lumionics, Sharp Corporation.
3. What are the main segments of the Consumer Electronic Oled Screen?
The market segments include Application, Type.
4. Can you provide details about the market size?
The market size is estimated to be USD XXX N/A as of 2022.
5. What are some drivers contributing to market growth?
N/A
6. What are the notable trends driving market growth?
N/A
7. Are there any restraints impacting market growth?
N/A
8. Can you provide examples of recent developments in the market?
N/A
9. What pricing options are available for accessing the report?
Pricing options include single-user, multi-user, and enterprise licenses priced at USD 2900.00, USD 4350.00, and USD 5800.00 respectively.
10. Is the market size provided in terms of value or volume?
The market size is provided in terms of value, measured in N/A.
11. Are there any specific market keywords associated with the report?
Yes, the market keyword associated with the report is "Consumer Electronic Oled Screen," which aids in identifying and referencing the specific market segment covered.
12. How do I determine which pricing option suits my needs best?
The pricing options vary based on user requirements and access needs. Individual users may opt for single-user licenses, while businesses requiring broader access may choose multi-user or enterprise licenses for cost-effective access to the report.
13. Are there any additional resources or data provided in the Consumer Electronic Oled Screen report?
While the report offers comprehensive insights, it's advisable to review the specific contents or supplementary materials provided to ascertain if additional resources or data are available.
14. How can I stay updated on further developments or reports in the Consumer Electronic Oled Screen?
To stay informed about further developments, trends, and reports in the Consumer Electronic Oled Screen, consider subscribing to industry newsletters, following relevant companies and organizations, or regularly checking reputable industry news sources and publications.
Methodology
Step 1 - Identification of Relevant Samples Size from Population Database


Step 2 - Approaches for Defining Global Market Size (Value, Volume* & Price*)

Note*: In applicable scenarios
Step 3 - Data Sources
Primary Research
- Web Analytics
- Survey Reports
- Research Institute
- Latest Research Reports
- Opinion Leaders
Secondary Research
- Annual Reports
- White Paper
- Latest Press Release
- Industry Association
- Paid Database
- Investor Presentations

Step 4 - Data Triangulation
Involves using different sources of information in order to increase the validity of a study
These sources are likely to be stakeholders in a program - participants, other researchers, program staff, other community members, and so on.
Then we put all data in single framework & apply various statistical tools to find out the dynamic on the market.
During the analysis stage, feedback from the stakeholder groups would be compared to determine areas of agreement as well as areas of divergence