

Key Insights
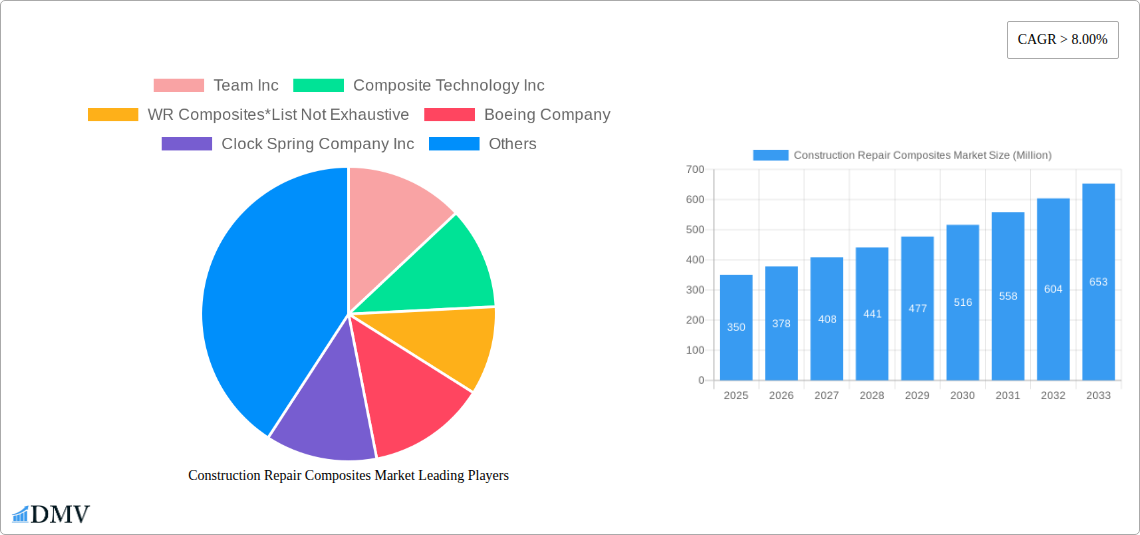
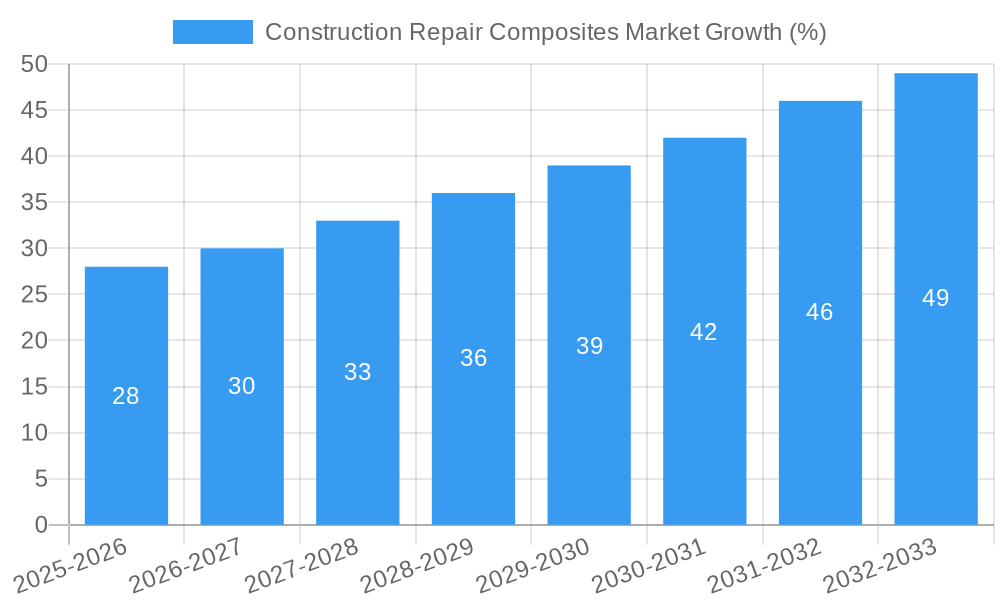
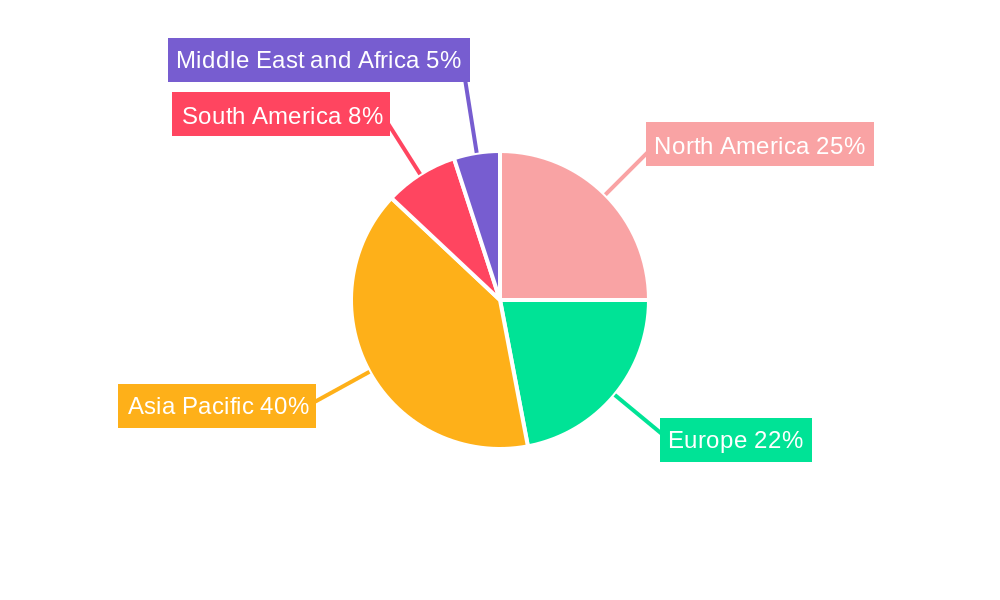
The Construction Repair Composites market, valued at $350 million in 2025, is poised for robust growth, exhibiting a Compound Annual Growth Rate (CAGR) exceeding 8% from 2025 to 2033. This expansion is driven by several key factors. Increasing infrastructure development globally necessitates frequent repairs and renovations, creating a substantial demand for durable and lightweight composite materials. Furthermore, the inherent advantages of composites—superior strength-to-weight ratio, corrosion resistance, and extended lifespan compared to traditional materials—are fueling adoption across various construction applications, including bridge repairs, strengthening of aging buildings, and the restoration of historical structures. The rising awareness of sustainability and the need for eco-friendly construction practices also contribute positively to market growth, as composites offer potential for reduced embodied carbon compared to some alternatives. Market segmentation reveals strong growth in structural composites, driven by their application in load-bearing repairs, while the hand lay-up process remains dominant due to its cost-effectiveness for smaller-scale projects. Geographically, the Asia-Pacific region, particularly China and India, is projected to dominate the market due to extensive infrastructure projects and rapid urbanization. North America and Europe will also experience significant growth driven by renovation and repair projects in existing infrastructure.
However, the market faces certain challenges. The high initial cost of composite materials compared to conventional options can be a barrier to entry for some projects. The specialized skills required for the fabrication and installation of composite repairs can also limit adoption. Furthermore, the long-term performance and durability of composite repairs in various environmental conditions need continued evaluation and improvement to build greater confidence in the industry. Despite these restraints, the overall market trajectory remains positive, driven by the increasing need for durable, efficient, and sustainable repair solutions in the construction industry. The ongoing innovation in composite materials and processing techniques will further unlock new opportunities and enhance market penetration in the coming years.
Construction Repair Composites Market: A Comprehensive Report (2019-2033)
This insightful report provides a detailed analysis of the Construction Repair Composites Market, offering a comprehensive overview of its current state, future trajectory, and key players. From market size and segmentation to growth drivers and challenges, this study equips stakeholders with the knowledge needed to make informed decisions in this dynamic sector. The report covers the period 2019-2033, with 2025 serving as the base and estimated year. The forecast period spans 2025-2033, while the historical period analyzed is 2019-2024. The total market value in 2025 is estimated at xx Million.
Construction Repair Composites Market Market Composition & Trends
This section delves into the competitive landscape of the Construction Repair Composites Market, examining market concentration, innovation drivers, regulatory frameworks, substitute products, end-user profiles, and mergers & acquisitions (M&A) activities. We analyze the market share distribution among key players, including Team Inc, Composite Technology Inc, WR Composites, Boeing Company, Clock Spring Company Inc, The IKM Group, TD Williamson Inc, Air France KLM Group, Milliken Infrastructure Solutions LLC, Lufthansa Technik AG, Hong Kong Aircraft Engineering Company Limited (HAECO), and Crawford Composites LLC (list not exhaustive). The report quantifies the market concentration using metrics such as the Herfindahl-Hirschman Index (HHI) and identifies key trends shaping the competitive dynamics. M&A activity is examined, including the total value of deals concluded within the specified period (xx Million), and their impact on market consolidation and technological advancements. Analysis of substitute products, such as traditional repair methods, and their impact on market growth is also included. Furthermore, the report provides in-depth profiles of end-user industries and their evolving demands for construction repair composites.
- Market Concentration: xx% (2025) dominated by top 5 players.
- M&A Deal Value (2019-2024): xx Million
- Key Innovation Catalysts: Lightweighting demands, improved durability requirements, sustainable material adoption.
- Regulatory Landscape: Analysis of key environmental and safety regulations impacting the market.
Construction Repair Composites Market Industry Evolution
This section provides a detailed analysis of the Construction Repair Composites Market's growth trajectory, technological advancements, and evolving consumer preferences from 2019 to 2033. We explore the factors driving market expansion, including increased infrastructure spending, the growing demand for durable and lightweight materials, and technological innovations in composite materials and manufacturing processes. The analysis incorporates specific data points such as compound annual growth rates (CAGR) and adoption rates of various composite types across different end-user industries. The impact of macroeconomic factors and technological disruptions on market growth is meticulously examined. This section will also discuss the shift in consumer demand towards sustainable and environmentally friendly composite materials.
Leading Regions, Countries, or Segments in Construction Repair Composites Market
This section identifies the leading regions, countries, and market segments within the Construction Repair Composites Market. We analyze market dominance factors in terms of product type (Structural, Semi-structural, Cosmetic), process (Hand Lay-up, Vacuum Infusion, Autoclave, Other Processes), and end-user industry (Aerospace and Defense, Wind Energy, Automotive, Marine, Construction, Other End-user Industries). The analysis highlights key drivers for each leading segment, such as investment trends, regulatory support, and technological advancements.
- Dominant Region: North America (Detailed justification and data to support this claim will be provided in the full report)
- Leading Product Type: Structural Composites (Reasons for dominance detailed in the report)
- Fastest-Growing Segment: Wind Energy (Explanations and data provided in full report)
Key Drivers (Examples):
- Increased investment in infrastructure projects.
- Government incentives promoting sustainable construction practices.
- Technological advancements in composite manufacturing processes.
Construction Repair Composites Market Product Innovations
This section details recent product innovations, applications, and performance metrics within the Construction Repair Composites Market. We showcase unique selling propositions (USPs) and highlight technological advancements that enhance performance characteristics such as strength-to-weight ratio, durability, and resistance to environmental factors. Specific examples of innovative products and their key features will be provided.
Propelling Factors for Construction Repair Composites Market Growth
Several factors are propelling the growth of the Construction Repair Composites Market. These include advancements in composite materials offering enhanced strength and durability, increasing government regulations emphasizing sustainable construction practices, and rising demand for lightweight and energy-efficient structures across various sectors. The decreasing cost of composite materials also plays a significant role.
Obstacles in the Construction Repair Composites Market Market
Despite the considerable growth potential, the Construction Repair Composites Market faces certain challenges. High initial investment costs associated with composite manufacturing can hinder market penetration, particularly among smaller players. Supply chain disruptions and fluctuations in raw material prices can impact profitability. Furthermore, the lack of skilled labor for composite manufacturing and repair can create bottlenecks.
Future Opportunities in Construction Repair Composites Market
The Construction Repair Composites Market presents various promising opportunities. Expansion into new and emerging markets, particularly in developing economies, holds substantial potential. Technological advancements, like the development of self-healing composites and improved recycling processes, will open new avenues for growth. Moreover, increasing demand for sustainable and eco-friendly construction materials will drive innovation and market expansion.
Major Players in the Construction Repair Composites Market Ecosystem
- Team Inc
- Composite Technology Inc
- WR Composites
- Boeing Company
- Clock Spring Company Inc
- The IKM Group
- TD Williamson Inc
- Air France KLM Group
- Milliken Infrastructure Solutions LLC
- Lufthansa Technik AG
- Hong Kong Aircraft Engineering Company Limited (HAECO)
- Crawford Composites LLC
Key Developments in Construction Repair Composites Market Industry
- [Month, Year]: Launch of a new high-strength, lightweight composite material by [Company Name].
- [Month, Year]: Acquisition of [Company A] by [Company B], expanding market reach.
- [Month, Year]: Introduction of a novel repair technique using advanced composite technology. (Further details will be in the full report)
Strategic Construction Repair Composites Market Market Forecast
The Construction Repair Composites Market is poised for significant growth over the forecast period (2025-2033). Continued technological advancements, increasing demand from key end-user industries, and supportive government policies will drive market expansion. New applications and innovative materials will further fuel this growth, creating substantial opportunities for established players and new entrants alike. The market is expected to reach xx Million by 2033.
Construction Repair Composites Market Segmentation
-
1. Product Type
- 1.1. Structural
- 1.2. Semi-structural
- 1.3. Cosmetic
-
2. Process
- 2.1. Hand Lay-up
- 2.2. Vacuum Infusion
- 2.3. Autoclave
- 2.4. Other Processes
-
3. End-user Industry
- 3.1. Aerospace and Defense
- 3.2. Wind Energy
- 3.3. Automotive
- 3.4. Marine
- 3.5. Construction
- 3.6. Other End-user Industries
Construction Repair Composites Market Segmentation By Geography
-
1. Asia Pacific
- 1.1. China
- 1.2. India
- 1.3. Japan
- 1.4. South Korea
- 1.5. Rest of Asia Pacific
-
2. North America
- 2.1. United States
- 2.2. Canada
- 2.3. Mexico
-
3. Europe
- 3.1. Germany
- 3.2. United Kingdom
- 3.3. France
- 3.4. Italy
- 3.5. Rest of Europe
-
4. South America
- 4.1. Brazil
- 4.2. Argentina
- 4.3. Rest of South America
-
5. Middle East and Africa
- 5.1. Saudi Arabia
- 5.2. South Africa
- 5.3. Rest of Middle East and Africa
Construction Repair Composites Market REPORT HIGHLIGHTS
| Aspects | Details |
|---|---|
| Study Period | 2019-2033 |
| Base Year | 2024 |
| Estimated Year | 2025 |
| Forecast Period | 2025-2033 |
| Historical Period | 2019-2024 |
| Growth Rate | CAGR of > 8.00% from 2019-2033 |
| Segmentation |
|
Table of Contents
- 1. Introduction
- 1.1. Research Scope
- 1.2. Market Segmentation
- 1.3. Research Methodology
- 1.4. Definitions and Assumptions
- 2. Executive Summary
- 2.1. Introduction
- 3. Market Dynamics
- 3.1. Introduction
- 3.2. Market Drivers
- 3.2.1. ; Rising Investment in Rehabilitation of Old Structures; Cost Saving Associated with Composite Structure Repair; Increasing Use of Composites in the Aerospace and Defense Industry
- 3.3. Market Restrains
- 3.3.1. ; Introduction of Self-healing Composites; Other Restraints
- 3.4. Market Trends
- 3.4.1. Aerospace and Defense to Lead the Growth of the Composite Repair Market
- 4. Market Factor Analysis
- 4.1. Porters Five Forces
- 4.2. Supply/Value Chain
- 4.3. PESTEL analysis
- 4.4. Market Entropy
- 4.5. Patent/Trademark Analysis
- 5. Global Construction Repair Composites Market Analysis, Insights and Forecast, 2019-2031
- 5.1. Market Analysis, Insights and Forecast - by Product Type
- 5.1.1. Structural
- 5.1.2. Semi-structural
- 5.1.3. Cosmetic
- 5.2. Market Analysis, Insights and Forecast - by Process
- 5.2.1. Hand Lay-up
- 5.2.2. Vacuum Infusion
- 5.2.3. Autoclave
- 5.2.4. Other Processes
- 5.3. Market Analysis, Insights and Forecast - by End-user Industry
- 5.3.1. Aerospace and Defense
- 5.3.2. Wind Energy
- 5.3.3. Automotive
- 5.3.4. Marine
- 5.3.5. Construction
- 5.3.6. Other End-user Industries
- 5.4. Market Analysis, Insights and Forecast - by Region
- 5.4.1. Asia Pacific
- 5.4.2. North America
- 5.4.3. Europe
- 5.4.4. South America
- 5.4.5. Middle East and Africa
- 5.1. Market Analysis, Insights and Forecast - by Product Type
- 6. Asia Pacific Construction Repair Composites Market Analysis, Insights and Forecast, 2019-2031
- 6.1. Market Analysis, Insights and Forecast - by Product Type
- 6.1.1. Structural
- 6.1.2. Semi-structural
- 6.1.3. Cosmetic
- 6.2. Market Analysis, Insights and Forecast - by Process
- 6.2.1. Hand Lay-up
- 6.2.2. Vacuum Infusion
- 6.2.3. Autoclave
- 6.2.4. Other Processes
- 6.3. Market Analysis, Insights and Forecast - by End-user Industry
- 6.3.1. Aerospace and Defense
- 6.3.2. Wind Energy
- 6.3.3. Automotive
- 6.3.4. Marine
- 6.3.5. Construction
- 6.3.6. Other End-user Industries
- 6.1. Market Analysis, Insights and Forecast - by Product Type
- 7. North America Construction Repair Composites Market Analysis, Insights and Forecast, 2019-2031
- 7.1. Market Analysis, Insights and Forecast - by Product Type
- 7.1.1. Structural
- 7.1.2. Semi-structural
- 7.1.3. Cosmetic
- 7.2. Market Analysis, Insights and Forecast - by Process
- 7.2.1. Hand Lay-up
- 7.2.2. Vacuum Infusion
- 7.2.3. Autoclave
- 7.2.4. Other Processes
- 7.3. Market Analysis, Insights and Forecast - by End-user Industry
- 7.3.1. Aerospace and Defense
- 7.3.2. Wind Energy
- 7.3.3. Automotive
- 7.3.4. Marine
- 7.3.5. Construction
- 7.3.6. Other End-user Industries
- 7.1. Market Analysis, Insights and Forecast - by Product Type
- 8. Europe Construction Repair Composites Market Analysis, Insights and Forecast, 2019-2031
- 8.1. Market Analysis, Insights and Forecast - by Product Type
- 8.1.1. Structural
- 8.1.2. Semi-structural
- 8.1.3. Cosmetic
- 8.2. Market Analysis, Insights and Forecast - by Process
- 8.2.1. Hand Lay-up
- 8.2.2. Vacuum Infusion
- 8.2.3. Autoclave
- 8.2.4. Other Processes
- 8.3. Market Analysis, Insights and Forecast - by End-user Industry
- 8.3.1. Aerospace and Defense
- 8.3.2. Wind Energy
- 8.3.3. Automotive
- 8.3.4. Marine
- 8.3.5. Construction
- 8.3.6. Other End-user Industries
- 8.1. Market Analysis, Insights and Forecast - by Product Type
- 9. South America Construction Repair Composites Market Analysis, Insights and Forecast, 2019-2031
- 9.1. Market Analysis, Insights and Forecast - by Product Type
- 9.1.1. Structural
- 9.1.2. Semi-structural
- 9.1.3. Cosmetic
- 9.2. Market Analysis, Insights and Forecast - by Process
- 9.2.1. Hand Lay-up
- 9.2.2. Vacuum Infusion
- 9.2.3. Autoclave
- 9.2.4. Other Processes
- 9.3. Market Analysis, Insights and Forecast - by End-user Industry
- 9.3.1. Aerospace and Defense
- 9.3.2. Wind Energy
- 9.3.3. Automotive
- 9.3.4. Marine
- 9.3.5. Construction
- 9.3.6. Other End-user Industries
- 9.1. Market Analysis, Insights and Forecast - by Product Type
- 10. Middle East and Africa Construction Repair Composites Market Analysis, Insights and Forecast, 2019-2031
- 10.1. Market Analysis, Insights and Forecast - by Product Type
- 10.1.1. Structural
- 10.1.2. Semi-structural
- 10.1.3. Cosmetic
- 10.2. Market Analysis, Insights and Forecast - by Process
- 10.2.1. Hand Lay-up
- 10.2.2. Vacuum Infusion
- 10.2.3. Autoclave
- 10.2.4. Other Processes
- 10.3. Market Analysis, Insights and Forecast - by End-user Industry
- 10.3.1. Aerospace and Defense
- 10.3.2. Wind Energy
- 10.3.3. Automotive
- 10.3.4. Marine
- 10.3.5. Construction
- 10.3.6. Other End-user Industries
- 10.1. Market Analysis, Insights and Forecast - by Product Type
- 11. Asia Pacific Construction Repair Composites Market Analysis, Insights and Forecast, 2019-2031
- 11.1. Market Analysis, Insights and Forecast - By Country/Sub-region
- 11.1.1 China
- 11.1.2 India
- 11.1.3 Japan
- 11.1.4 South Korea
- 11.1.5 Rest of Asia Pacific
- 12. North America Construction Repair Composites Market Analysis, Insights and Forecast, 2019-2031
- 12.1. Market Analysis, Insights and Forecast - By Country/Sub-region
- 12.1.1 United States
- 12.1.2 Canada
- 12.1.3 Mexico
- 13. Europe Construction Repair Composites Market Analysis, Insights and Forecast, 2019-2031
- 13.1. Market Analysis, Insights and Forecast - By Country/Sub-region
- 13.1.1 Germany
- 13.1.2 United Kingdom
- 13.1.3 France
- 13.1.4 Italy
- 13.1.5 Rest of Europe
- 14. South America Construction Repair Composites Market Analysis, Insights and Forecast, 2019-2031
- 14.1. Market Analysis, Insights and Forecast - By Country/Sub-region
- 14.1.1 Brazil
- 14.1.2 Argentina
- 14.1.3 Rest of South America
- 15. Middle East and Africa Construction Repair Composites Market Analysis, Insights and Forecast, 2019-2031
- 15.1. Market Analysis, Insights and Forecast - By Country/Sub-region
- 15.1.1 Saudi Arabia
- 15.1.2 South Africa
- 15.1.3 Rest of Middle East and Africa
- 16. Competitive Analysis
- 16.1. Global Market Share Analysis 2024
- 16.2. Company Profiles
- 16.2.1 Team Inc
- 16.2.1.1. Overview
- 16.2.1.2. Products
- 16.2.1.3. SWOT Analysis
- 16.2.1.4. Recent Developments
- 16.2.1.5. Financials (Based on Availability)
- 16.2.2 Composite Technology Inc
- 16.2.2.1. Overview
- 16.2.2.2. Products
- 16.2.2.3. SWOT Analysis
- 16.2.2.4. Recent Developments
- 16.2.2.5. Financials (Based on Availability)
- 16.2.3 WR Composites*List Not Exhaustive
- 16.2.3.1. Overview
- 16.2.3.2. Products
- 16.2.3.3. SWOT Analysis
- 16.2.3.4. Recent Developments
- 16.2.3.5. Financials (Based on Availability)
- 16.2.4 Boeing Company
- 16.2.4.1. Overview
- 16.2.4.2. Products
- 16.2.4.3. SWOT Analysis
- 16.2.4.4. Recent Developments
- 16.2.4.5. Financials (Based on Availability)
- 16.2.5 Clock Spring Company Inc
- 16.2.5.1. Overview
- 16.2.5.2. Products
- 16.2.5.3. SWOT Analysis
- 16.2.5.4. Recent Developments
- 16.2.5.5. Financials (Based on Availability)
- 16.2.6 The IKM Group
- 16.2.6.1. Overview
- 16.2.6.2. Products
- 16.2.6.3. SWOT Analysis
- 16.2.6.4. Recent Developments
- 16.2.6.5. Financials (Based on Availability)
- 16.2.7 TD Williamson Inc
- 16.2.7.1. Overview
- 16.2.7.2. Products
- 16.2.7.3. SWOT Analysis
- 16.2.7.4. Recent Developments
- 16.2.7.5. Financials (Based on Availability)
- 16.2.8 Air France KLM Group
- 16.2.8.1. Overview
- 16.2.8.2. Products
- 16.2.8.3. SWOT Analysis
- 16.2.8.4. Recent Developments
- 16.2.8.5. Financials (Based on Availability)
- 16.2.9 Milliken Infrastructure Solutions LLC
- 16.2.9.1. Overview
- 16.2.9.2. Products
- 16.2.9.3. SWOT Analysis
- 16.2.9.4. Recent Developments
- 16.2.9.5. Financials (Based on Availability)
- 16.2.10 Lufthansa Technik AG
- 16.2.10.1. Overview
- 16.2.10.2. Products
- 16.2.10.3. SWOT Analysis
- 16.2.10.4. Recent Developments
- 16.2.10.5. Financials (Based on Availability)
- 16.2.11 Hong Kong Aircraft Engineering Company Limited (HAECO)
- 16.2.11.1. Overview
- 16.2.11.2. Products
- 16.2.11.3. SWOT Analysis
- 16.2.11.4. Recent Developments
- 16.2.11.5. Financials (Based on Availability)
- 16.2.12 Crawford Composites LLC
- 16.2.12.1. Overview
- 16.2.12.2. Products
- 16.2.12.3. SWOT Analysis
- 16.2.12.4. Recent Developments
- 16.2.12.5. Financials (Based on Availability)
- 16.2.1 Team Inc
List of Figures
- Figure 1: Global Construction Repair Composites Market Revenue Breakdown (Million, %) by Region 2024 & 2032
- Figure 2: Global Construction Repair Composites Market Volume Breakdown (K Tons, %) by Region 2024 & 2032
- Figure 3: Asia Pacific Construction Repair Composites Market Revenue (Million), by Country 2024 & 2032
- Figure 4: Asia Pacific Construction Repair Composites Market Volume (K Tons), by Country 2024 & 2032
- Figure 5: Asia Pacific Construction Repair Composites Market Revenue Share (%), by Country 2024 & 2032
- Figure 6: Asia Pacific Construction Repair Composites Market Volume Share (%), by Country 2024 & 2032
- Figure 7: North America Construction Repair Composites Market Revenue (Million), by Country 2024 & 2032
- Figure 8: North America Construction Repair Composites Market Volume (K Tons), by Country 2024 & 2032
- Figure 9: North America Construction Repair Composites Market Revenue Share (%), by Country 2024 & 2032
- Figure 10: North America Construction Repair Composites Market Volume Share (%), by Country 2024 & 2032
- Figure 11: Europe Construction Repair Composites Market Revenue (Million), by Country 2024 & 2032
- Figure 12: Europe Construction Repair Composites Market Volume (K Tons), by Country 2024 & 2032
- Figure 13: Europe Construction Repair Composites Market Revenue Share (%), by Country 2024 & 2032
- Figure 14: Europe Construction Repair Composites Market Volume Share (%), by Country 2024 & 2032
- Figure 15: South America Construction Repair Composites Market Revenue (Million), by Country 2024 & 2032
- Figure 16: South America Construction Repair Composites Market Volume (K Tons), by Country 2024 & 2032
- Figure 17: South America Construction Repair Composites Market Revenue Share (%), by Country 2024 & 2032
- Figure 18: South America Construction Repair Composites Market Volume Share (%), by Country 2024 & 2032
- Figure 19: Middle East and Africa Construction Repair Composites Market Revenue (Million), by Country 2024 & 2032
- Figure 20: Middle East and Africa Construction Repair Composites Market Volume (K Tons), by Country 2024 & 2032
- Figure 21: Middle East and Africa Construction Repair Composites Market Revenue Share (%), by Country 2024 & 2032
- Figure 22: Middle East and Africa Construction Repair Composites Market Volume Share (%), by Country 2024 & 2032
- Figure 23: Asia Pacific Construction Repair Composites Market Revenue (Million), by Product Type 2024 & 2032
- Figure 24: Asia Pacific Construction Repair Composites Market Volume (K Tons), by Product Type 2024 & 2032
- Figure 25: Asia Pacific Construction Repair Composites Market Revenue Share (%), by Product Type 2024 & 2032
- Figure 26: Asia Pacific Construction Repair Composites Market Volume Share (%), by Product Type 2024 & 2032
- Figure 27: Asia Pacific Construction Repair Composites Market Revenue (Million), by Process 2024 & 2032
- Figure 28: Asia Pacific Construction Repair Composites Market Volume (K Tons), by Process 2024 & 2032
- Figure 29: Asia Pacific Construction Repair Composites Market Revenue Share (%), by Process 2024 & 2032
- Figure 30: Asia Pacific Construction Repair Composites Market Volume Share (%), by Process 2024 & 2032
- Figure 31: Asia Pacific Construction Repair Composites Market Revenue (Million), by End-user Industry 2024 & 2032
- Figure 32: Asia Pacific Construction Repair Composites Market Volume (K Tons), by End-user Industry 2024 & 2032
- Figure 33: Asia Pacific Construction Repair Composites Market Revenue Share (%), by End-user Industry 2024 & 2032
- Figure 34: Asia Pacific Construction Repair Composites Market Volume Share (%), by End-user Industry 2024 & 2032
- Figure 35: Asia Pacific Construction Repair Composites Market Revenue (Million), by Country 2024 & 2032
- Figure 36: Asia Pacific Construction Repair Composites Market Volume (K Tons), by Country 2024 & 2032
- Figure 37: Asia Pacific Construction Repair Composites Market Revenue Share (%), by Country 2024 & 2032
- Figure 38: Asia Pacific Construction Repair Composites Market Volume Share (%), by Country 2024 & 2032
- Figure 39: North America Construction Repair Composites Market Revenue (Million), by Product Type 2024 & 2032
- Figure 40: North America Construction Repair Composites Market Volume (K Tons), by Product Type 2024 & 2032
- Figure 41: North America Construction Repair Composites Market Revenue Share (%), by Product Type 2024 & 2032
- Figure 42: North America Construction Repair Composites Market Volume Share (%), by Product Type 2024 & 2032
- Figure 43: North America Construction Repair Composites Market Revenue (Million), by Process 2024 & 2032
- Figure 44: North America Construction Repair Composites Market Volume (K Tons), by Process 2024 & 2032
- Figure 45: North America Construction Repair Composites Market Revenue Share (%), by Process 2024 & 2032
- Figure 46: North America Construction Repair Composites Market Volume Share (%), by Process 2024 & 2032
- Figure 47: North America Construction Repair Composites Market Revenue (Million), by End-user Industry 2024 & 2032
- Figure 48: North America Construction Repair Composites Market Volume (K Tons), by End-user Industry 2024 & 2032
- Figure 49: North America Construction Repair Composites Market Revenue Share (%), by End-user Industry 2024 & 2032
- Figure 50: North America Construction Repair Composites Market Volume Share (%), by End-user Industry 2024 & 2032
- Figure 51: North America Construction Repair Composites Market Revenue (Million), by Country 2024 & 2032
- Figure 52: North America Construction Repair Composites Market Volume (K Tons), by Country 2024 & 2032
- Figure 53: North America Construction Repair Composites Market Revenue Share (%), by Country 2024 & 2032
- Figure 54: North America Construction Repair Composites Market Volume Share (%), by Country 2024 & 2032
- Figure 55: Europe Construction Repair Composites Market Revenue (Million), by Product Type 2024 & 2032
- Figure 56: Europe Construction Repair Composites Market Volume (K Tons), by Product Type 2024 & 2032
- Figure 57: Europe Construction Repair Composites Market Revenue Share (%), by Product Type 2024 & 2032
- Figure 58: Europe Construction Repair Composites Market Volume Share (%), by Product Type 2024 & 2032
- Figure 59: Europe Construction Repair Composites Market Revenue (Million), by Process 2024 & 2032
- Figure 60: Europe Construction Repair Composites Market Volume (K Tons), by Process 2024 & 2032
- Figure 61: Europe Construction Repair Composites Market Revenue Share (%), by Process 2024 & 2032
- Figure 62: Europe Construction Repair Composites Market Volume Share (%), by Process 2024 & 2032
- Figure 63: Europe Construction Repair Composites Market Revenue (Million), by End-user Industry 2024 & 2032
- Figure 64: Europe Construction Repair Composites Market Volume (K Tons), by End-user Industry 2024 & 2032
- Figure 65: Europe Construction Repair Composites Market Revenue Share (%), by End-user Industry 2024 & 2032
- Figure 66: Europe Construction Repair Composites Market Volume Share (%), by End-user Industry 2024 & 2032
- Figure 67: Europe Construction Repair Composites Market Revenue (Million), by Country 2024 & 2032
- Figure 68: Europe Construction Repair Composites Market Volume (K Tons), by Country 2024 & 2032
- Figure 69: Europe Construction Repair Composites Market Revenue Share (%), by Country 2024 & 2032
- Figure 70: Europe Construction Repair Composites Market Volume Share (%), by Country 2024 & 2032
- Figure 71: South America Construction Repair Composites Market Revenue (Million), by Product Type 2024 & 2032
- Figure 72: South America Construction Repair Composites Market Volume (K Tons), by Product Type 2024 & 2032
- Figure 73: South America Construction Repair Composites Market Revenue Share (%), by Product Type 2024 & 2032
- Figure 74: South America Construction Repair Composites Market Volume Share (%), by Product Type 2024 & 2032
- Figure 75: South America Construction Repair Composites Market Revenue (Million), by Process 2024 & 2032
- Figure 76: South America Construction Repair Composites Market Volume (K Tons), by Process 2024 & 2032
- Figure 77: South America Construction Repair Composites Market Revenue Share (%), by Process 2024 & 2032
- Figure 78: South America Construction Repair Composites Market Volume Share (%), by Process 2024 & 2032
- Figure 79: South America Construction Repair Composites Market Revenue (Million), by End-user Industry 2024 & 2032
- Figure 80: South America Construction Repair Composites Market Volume (K Tons), by End-user Industry 2024 & 2032
- Figure 81: South America Construction Repair Composites Market Revenue Share (%), by End-user Industry 2024 & 2032
- Figure 82: South America Construction Repair Composites Market Volume Share (%), by End-user Industry 2024 & 2032
- Figure 83: South America Construction Repair Composites Market Revenue (Million), by Country 2024 & 2032
- Figure 84: South America Construction Repair Composites Market Volume (K Tons), by Country 2024 & 2032
- Figure 85: South America Construction Repair Composites Market Revenue Share (%), by Country 2024 & 2032
- Figure 86: South America Construction Repair Composites Market Volume Share (%), by Country 2024 & 2032
- Figure 87: Middle East and Africa Construction Repair Composites Market Revenue (Million), by Product Type 2024 & 2032
- Figure 88: Middle East and Africa Construction Repair Composites Market Volume (K Tons), by Product Type 2024 & 2032
- Figure 89: Middle East and Africa Construction Repair Composites Market Revenue Share (%), by Product Type 2024 & 2032
- Figure 90: Middle East and Africa Construction Repair Composites Market Volume Share (%), by Product Type 2024 & 2032
- Figure 91: Middle East and Africa Construction Repair Composites Market Revenue (Million), by Process 2024 & 2032
- Figure 92: Middle East and Africa Construction Repair Composites Market Volume (K Tons), by Process 2024 & 2032
- Figure 93: Middle East and Africa Construction Repair Composites Market Revenue Share (%), by Process 2024 & 2032
- Figure 94: Middle East and Africa Construction Repair Composites Market Volume Share (%), by Process 2024 & 2032
- Figure 95: Middle East and Africa Construction Repair Composites Market Revenue (Million), by End-user Industry 2024 & 2032
- Figure 96: Middle East and Africa Construction Repair Composites Market Volume (K Tons), by End-user Industry 2024 & 2032
- Figure 97: Middle East and Africa Construction Repair Composites Market Revenue Share (%), by End-user Industry 2024 & 2032
- Figure 98: Middle East and Africa Construction Repair Composites Market Volume Share (%), by End-user Industry 2024 & 2032
- Figure 99: Middle East and Africa Construction Repair Composites Market Revenue (Million), by Country 2024 & 2032
- Figure 100: Middle East and Africa Construction Repair Composites Market Volume (K Tons), by Country 2024 & 2032
- Figure 101: Middle East and Africa Construction Repair Composites Market Revenue Share (%), by Country 2024 & 2032
- Figure 102: Middle East and Africa Construction Repair Composites Market Volume Share (%), by Country 2024 & 2032
List of Tables
- Table 1: Global Construction Repair Composites Market Revenue Million Forecast, by Region 2019 & 2032
- Table 2: Global Construction Repair Composites Market Volume K Tons Forecast, by Region 2019 & 2032
- Table 3: Global Construction Repair Composites Market Revenue Million Forecast, by Product Type 2019 & 2032
- Table 4: Global Construction Repair Composites Market Volume K Tons Forecast, by Product Type 2019 & 2032
- Table 5: Global Construction Repair Composites Market Revenue Million Forecast, by Process 2019 & 2032
- Table 6: Global Construction Repair Composites Market Volume K Tons Forecast, by Process 2019 & 2032
- Table 7: Global Construction Repair Composites Market Revenue Million Forecast, by End-user Industry 2019 & 2032
- Table 8: Global Construction Repair Composites Market Volume K Tons Forecast, by End-user Industry 2019 & 2032
- Table 9: Global Construction Repair Composites Market Revenue Million Forecast, by Region 2019 & 2032
- Table 10: Global Construction Repair Composites Market Volume K Tons Forecast, by Region 2019 & 2032
- Table 11: Global Construction Repair Composites Market Revenue Million Forecast, by Country 2019 & 2032
- Table 12: Global Construction Repair Composites Market Volume K Tons Forecast, by Country 2019 & 2032
- Table 13: China Construction Repair Composites Market Revenue (Million) Forecast, by Application 2019 & 2032
- Table 14: China Construction Repair Composites Market Volume (K Tons) Forecast, by Application 2019 & 2032
- Table 15: India Construction Repair Composites Market Revenue (Million) Forecast, by Application 2019 & 2032
- Table 16: India Construction Repair Composites Market Volume (K Tons) Forecast, by Application 2019 & 2032
- Table 17: Japan Construction Repair Composites Market Revenue (Million) Forecast, by Application 2019 & 2032
- Table 18: Japan Construction Repair Composites Market Volume (K Tons) Forecast, by Application 2019 & 2032
- Table 19: South Korea Construction Repair Composites Market Revenue (Million) Forecast, by Application 2019 & 2032
- Table 20: South Korea Construction Repair Composites Market Volume (K Tons) Forecast, by Application 2019 & 2032
- Table 21: Rest of Asia Pacific Construction Repair Composites Market Revenue (Million) Forecast, by Application 2019 & 2032
- Table 22: Rest of Asia Pacific Construction Repair Composites Market Volume (K Tons) Forecast, by Application 2019 & 2032
- Table 23: Global Construction Repair Composites Market Revenue Million Forecast, by Country 2019 & 2032
- Table 24: Global Construction Repair Composites Market Volume K Tons Forecast, by Country 2019 & 2032
- Table 25: United States Construction Repair Composites Market Revenue (Million) Forecast, by Application 2019 & 2032
- Table 26: United States Construction Repair Composites Market Volume (K Tons) Forecast, by Application 2019 & 2032
- Table 27: Canada Construction Repair Composites Market Revenue (Million) Forecast, by Application 2019 & 2032
- Table 28: Canada Construction Repair Composites Market Volume (K Tons) Forecast, by Application 2019 & 2032
- Table 29: Mexico Construction Repair Composites Market Revenue (Million) Forecast, by Application 2019 & 2032
- Table 30: Mexico Construction Repair Composites Market Volume (K Tons) Forecast, by Application 2019 & 2032
- Table 31: Global Construction Repair Composites Market Revenue Million Forecast, by Country 2019 & 2032
- Table 32: Global Construction Repair Composites Market Volume K Tons Forecast, by Country 2019 & 2032
- Table 33: Germany Construction Repair Composites Market Revenue (Million) Forecast, by Application 2019 & 2032
- Table 34: Germany Construction Repair Composites Market Volume (K Tons) Forecast, by Application 2019 & 2032
- Table 35: United Kingdom Construction Repair Composites Market Revenue (Million) Forecast, by Application 2019 & 2032
- Table 36: United Kingdom Construction Repair Composites Market Volume (K Tons) Forecast, by Application 2019 & 2032
- Table 37: France Construction Repair Composites Market Revenue (Million) Forecast, by Application 2019 & 2032
- Table 38: France Construction Repair Composites Market Volume (K Tons) Forecast, by Application 2019 & 2032
- Table 39: Italy Construction Repair Composites Market Revenue (Million) Forecast, by Application 2019 & 2032
- Table 40: Italy Construction Repair Composites Market Volume (K Tons) Forecast, by Application 2019 & 2032
- Table 41: Rest of Europe Construction Repair Composites Market Revenue (Million) Forecast, by Application 2019 & 2032
- Table 42: Rest of Europe Construction Repair Composites Market Volume (K Tons) Forecast, by Application 2019 & 2032
- Table 43: Global Construction Repair Composites Market Revenue Million Forecast, by Country 2019 & 2032
- Table 44: Global Construction Repair Composites Market Volume K Tons Forecast, by Country 2019 & 2032
- Table 45: Brazil Construction Repair Composites Market Revenue (Million) Forecast, by Application 2019 & 2032
- Table 46: Brazil Construction Repair Composites Market Volume (K Tons) Forecast, by Application 2019 & 2032
- Table 47: Argentina Construction Repair Composites Market Revenue (Million) Forecast, by Application 2019 & 2032
- Table 48: Argentina Construction Repair Composites Market Volume (K Tons) Forecast, by Application 2019 & 2032
- Table 49: Rest of South America Construction Repair Composites Market Revenue (Million) Forecast, by Application 2019 & 2032
- Table 50: Rest of South America Construction Repair Composites Market Volume (K Tons) Forecast, by Application 2019 & 2032
- Table 51: Global Construction Repair Composites Market Revenue Million Forecast, by Country 2019 & 2032
- Table 52: Global Construction Repair Composites Market Volume K Tons Forecast, by Country 2019 & 2032
- Table 53: Saudi Arabia Construction Repair Composites Market Revenue (Million) Forecast, by Application 2019 & 2032
- Table 54: Saudi Arabia Construction Repair Composites Market Volume (K Tons) Forecast, by Application 2019 & 2032
- Table 55: South Africa Construction Repair Composites Market Revenue (Million) Forecast, by Application 2019 & 2032
- Table 56: South Africa Construction Repair Composites Market Volume (K Tons) Forecast, by Application 2019 & 2032
- Table 57: Rest of Middle East and Africa Construction Repair Composites Market Revenue (Million) Forecast, by Application 2019 & 2032
- Table 58: Rest of Middle East and Africa Construction Repair Composites Market Volume (K Tons) Forecast, by Application 2019 & 2032
- Table 59: Global Construction Repair Composites Market Revenue Million Forecast, by Product Type 2019 & 2032
- Table 60: Global Construction Repair Composites Market Volume K Tons Forecast, by Product Type 2019 & 2032
- Table 61: Global Construction Repair Composites Market Revenue Million Forecast, by Process 2019 & 2032
- Table 62: Global Construction Repair Composites Market Volume K Tons Forecast, by Process 2019 & 2032
- Table 63: Global Construction Repair Composites Market Revenue Million Forecast, by End-user Industry 2019 & 2032
- Table 64: Global Construction Repair Composites Market Volume K Tons Forecast, by End-user Industry 2019 & 2032
- Table 65: Global Construction Repair Composites Market Revenue Million Forecast, by Country 2019 & 2032
- Table 66: Global Construction Repair Composites Market Volume K Tons Forecast, by Country 2019 & 2032
- Table 67: China Construction Repair Composites Market Revenue (Million) Forecast, by Application 2019 & 2032
- Table 68: China Construction Repair Composites Market Volume (K Tons) Forecast, by Application 2019 & 2032
- Table 69: India Construction Repair Composites Market Revenue (Million) Forecast, by Application 2019 & 2032
- Table 70: India Construction Repair Composites Market Volume (K Tons) Forecast, by Application 2019 & 2032
- Table 71: Japan Construction Repair Composites Market Revenue (Million) Forecast, by Application 2019 & 2032
- Table 72: Japan Construction Repair Composites Market Volume (K Tons) Forecast, by Application 2019 & 2032
- Table 73: South Korea Construction Repair Composites Market Revenue (Million) Forecast, by Application 2019 & 2032
- Table 74: South Korea Construction Repair Composites Market Volume (K Tons) Forecast, by Application 2019 & 2032
- Table 75: Rest of Asia Pacific Construction Repair Composites Market Revenue (Million) Forecast, by Application 2019 & 2032
- Table 76: Rest of Asia Pacific Construction Repair Composites Market Volume (K Tons) Forecast, by Application 2019 & 2032
- Table 77: Global Construction Repair Composites Market Revenue Million Forecast, by Product Type 2019 & 2032
- Table 78: Global Construction Repair Composites Market Volume K Tons Forecast, by Product Type 2019 & 2032
- Table 79: Global Construction Repair Composites Market Revenue Million Forecast, by Process 2019 & 2032
- Table 80: Global Construction Repair Composites Market Volume K Tons Forecast, by Process 2019 & 2032
- Table 81: Global Construction Repair Composites Market Revenue Million Forecast, by End-user Industry 2019 & 2032
- Table 82: Global Construction Repair Composites Market Volume K Tons Forecast, by End-user Industry 2019 & 2032
- Table 83: Global Construction Repair Composites Market Revenue Million Forecast, by Country 2019 & 2032
- Table 84: Global Construction Repair Composites Market Volume K Tons Forecast, by Country 2019 & 2032
- Table 85: United States Construction Repair Composites Market Revenue (Million) Forecast, by Application 2019 & 2032
- Table 86: United States Construction Repair Composites Market Volume (K Tons) Forecast, by Application 2019 & 2032
- Table 87: Canada Construction Repair Composites Market Revenue (Million) Forecast, by Application 2019 & 2032
- Table 88: Canada Construction Repair Composites Market Volume (K Tons) Forecast, by Application 2019 & 2032
- Table 89: Mexico Construction Repair Composites Market Revenue (Million) Forecast, by Application 2019 & 2032
- Table 90: Mexico Construction Repair Composites Market Volume (K Tons) Forecast, by Application 2019 & 2032
- Table 91: Global Construction Repair Composites Market Revenue Million Forecast, by Product Type 2019 & 2032
- Table 92: Global Construction Repair Composites Market Volume K Tons Forecast, by Product Type 2019 & 2032
- Table 93: Global Construction Repair Composites Market Revenue Million Forecast, by Process 2019 & 2032
- Table 94: Global Construction Repair Composites Market Volume K Tons Forecast, by Process 2019 & 2032
- Table 95: Global Construction Repair Composites Market Revenue Million Forecast, by End-user Industry 2019 & 2032
- Table 96: Global Construction Repair Composites Market Volume K Tons Forecast, by End-user Industry 2019 & 2032
- Table 97: Global Construction Repair Composites Market Revenue Million Forecast, by Country 2019 & 2032
- Table 98: Global Construction Repair Composites Market Volume K Tons Forecast, by Country 2019 & 2032
- Table 99: Germany Construction Repair Composites Market Revenue (Million) Forecast, by Application 2019 & 2032
- Table 100: Germany Construction Repair Composites Market Volume (K Tons) Forecast, by Application 2019 & 2032
- Table 101: United Kingdom Construction Repair Composites Market Revenue (Million) Forecast, by Application 2019 & 2032
- Table 102: United Kingdom Construction Repair Composites Market Volume (K Tons) Forecast, by Application 2019 & 2032
- Table 103: France Construction Repair Composites Market Revenue (Million) Forecast, by Application 2019 & 2032
- Table 104: France Construction Repair Composites Market Volume (K Tons) Forecast, by Application 2019 & 2032
- Table 105: Italy Construction Repair Composites Market Revenue (Million) Forecast, by Application 2019 & 2032
- Table 106: Italy Construction Repair Composites Market Volume (K Tons) Forecast, by Application 2019 & 2032
- Table 107: Rest of Europe Construction Repair Composites Market Revenue (Million) Forecast, by Application 2019 & 2032
- Table 108: Rest of Europe Construction Repair Composites Market Volume (K Tons) Forecast, by Application 2019 & 2032
- Table 109: Global Construction Repair Composites Market Revenue Million Forecast, by Product Type 2019 & 2032
- Table 110: Global Construction Repair Composites Market Volume K Tons Forecast, by Product Type 2019 & 2032
- Table 111: Global Construction Repair Composites Market Revenue Million Forecast, by Process 2019 & 2032
- Table 112: Global Construction Repair Composites Market Volume K Tons Forecast, by Process 2019 & 2032
- Table 113: Global Construction Repair Composites Market Revenue Million Forecast, by End-user Industry 2019 & 2032
- Table 114: Global Construction Repair Composites Market Volume K Tons Forecast, by End-user Industry 2019 & 2032
- Table 115: Global Construction Repair Composites Market Revenue Million Forecast, by Country 2019 & 2032
- Table 116: Global Construction Repair Composites Market Volume K Tons Forecast, by Country 2019 & 2032
- Table 117: Brazil Construction Repair Composites Market Revenue (Million) Forecast, by Application 2019 & 2032
- Table 118: Brazil Construction Repair Composites Market Volume (K Tons) Forecast, by Application 2019 & 2032
- Table 119: Argentina Construction Repair Composites Market Revenue (Million) Forecast, by Application 2019 & 2032
- Table 120: Argentina Construction Repair Composites Market Volume (K Tons) Forecast, by Application 2019 & 2032
- Table 121: Rest of South America Construction Repair Composites Market Revenue (Million) Forecast, by Application 2019 & 2032
- Table 122: Rest of South America Construction Repair Composites Market Volume (K Tons) Forecast, by Application 2019 & 2032
- Table 123: Global Construction Repair Composites Market Revenue Million Forecast, by Product Type 2019 & 2032
- Table 124: Global Construction Repair Composites Market Volume K Tons Forecast, by Product Type 2019 & 2032
- Table 125: Global Construction Repair Composites Market Revenue Million Forecast, by Process 2019 & 2032
- Table 126: Global Construction Repair Composites Market Volume K Tons Forecast, by Process 2019 & 2032
- Table 127: Global Construction Repair Composites Market Revenue Million Forecast, by End-user Industry 2019 & 2032
- Table 128: Global Construction Repair Composites Market Volume K Tons Forecast, by End-user Industry 2019 & 2032
- Table 129: Global Construction Repair Composites Market Revenue Million Forecast, by Country 2019 & 2032
- Table 130: Global Construction Repair Composites Market Volume K Tons Forecast, by Country 2019 & 2032
- Table 131: Saudi Arabia Construction Repair Composites Market Revenue (Million) Forecast, by Application 2019 & 2032
- Table 132: Saudi Arabia Construction Repair Composites Market Volume (K Tons) Forecast, by Application 2019 & 2032
- Table 133: South Africa Construction Repair Composites Market Revenue (Million) Forecast, by Application 2019 & 2032
- Table 134: South Africa Construction Repair Composites Market Volume (K Tons) Forecast, by Application 2019 & 2032
- Table 135: Rest of Middle East and Africa Construction Repair Composites Market Revenue (Million) Forecast, by Application 2019 & 2032
- Table 136: Rest of Middle East and Africa Construction Repair Composites Market Volume (K Tons) Forecast, by Application 2019 & 2032
Frequently Asked Questions
1. What is the projected Compound Annual Growth Rate (CAGR) of the Construction Repair Composites Market?
The projected CAGR is approximately > 8.00%.
2. Which companies are prominent players in the Construction Repair Composites Market?
Key companies in the market include Team Inc, Composite Technology Inc, WR Composites*List Not Exhaustive, Boeing Company, Clock Spring Company Inc, The IKM Group, TD Williamson Inc, Air France KLM Group, Milliken Infrastructure Solutions LLC, Lufthansa Technik AG, Hong Kong Aircraft Engineering Company Limited (HAECO), Crawford Composites LLC.
3. What are the main segments of the Construction Repair Composites Market?
The market segments include Product Type, Process, End-user Industry.
4. Can you provide details about the market size?
The market size is estimated to be USD 350 Million as of 2022.
5. What are some drivers contributing to market growth?
; Rising Investment in Rehabilitation of Old Structures; Cost Saving Associated with Composite Structure Repair; Increasing Use of Composites in the Aerospace and Defense Industry.
6. What are the notable trends driving market growth?
Aerospace and Defense to Lead the Growth of the Composite Repair Market.
7. Are there any restraints impacting market growth?
; Introduction of Self-healing Composites; Other Restraints.
8. Can you provide examples of recent developments in the market?
N/A
9. What pricing options are available for accessing the report?
Pricing options include single-user, multi-user, and enterprise licenses priced at USD 4750, USD 5250, and USD 8750 respectively.
10. Is the market size provided in terms of value or volume?
The market size is provided in terms of value, measured in Million and volume, measured in K Tons.
11. Are there any specific market keywords associated with the report?
Yes, the market keyword associated with the report is "Construction Repair Composites Market," which aids in identifying and referencing the specific market segment covered.
12. How do I determine which pricing option suits my needs best?
The pricing options vary based on user requirements and access needs. Individual users may opt for single-user licenses, while businesses requiring broader access may choose multi-user or enterprise licenses for cost-effective access to the report.
13. Are there any additional resources or data provided in the Construction Repair Composites Market report?
While the report offers comprehensive insights, it's advisable to review the specific contents or supplementary materials provided to ascertain if additional resources or data are available.
14. How can I stay updated on further developments or reports in the Construction Repair Composites Market?
To stay informed about further developments, trends, and reports in the Construction Repair Composites Market, consider subscribing to industry newsletters, following relevant companies and organizations, or regularly checking reputable industry news sources and publications.
Methodology
Step 1 - Identification of Relevant Samples Size from Population Database


Step 2 - Approaches for Defining Global Market Size (Value, Volume* & Price*)

Note*: In applicable scenarios
Step 3 - Data Sources
Primary Research
- Web Analytics
- Survey Reports
- Research Institute
- Latest Research Reports
- Opinion Leaders
Secondary Research
- Annual Reports
- White Paper
- Latest Press Release
- Industry Association
- Paid Database
- Investor Presentations

Step 4 - Data Triangulation
Involves using different sources of information in order to increase the validity of a study
These sources are likely to be stakeholders in a program - participants, other researchers, program staff, other community members, and so on.
Then we put all data in single framework & apply various statistical tools to find out the dynamic on the market.
During the analysis stage, feedback from the stakeholder groups would be compared to determine areas of agreement as well as areas of divergence
