

Key Insights
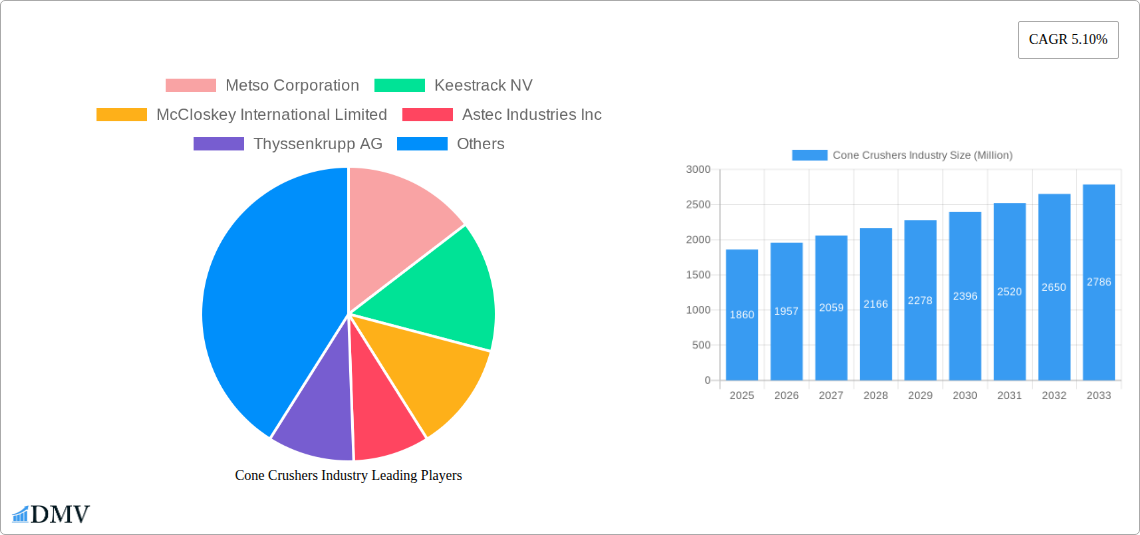
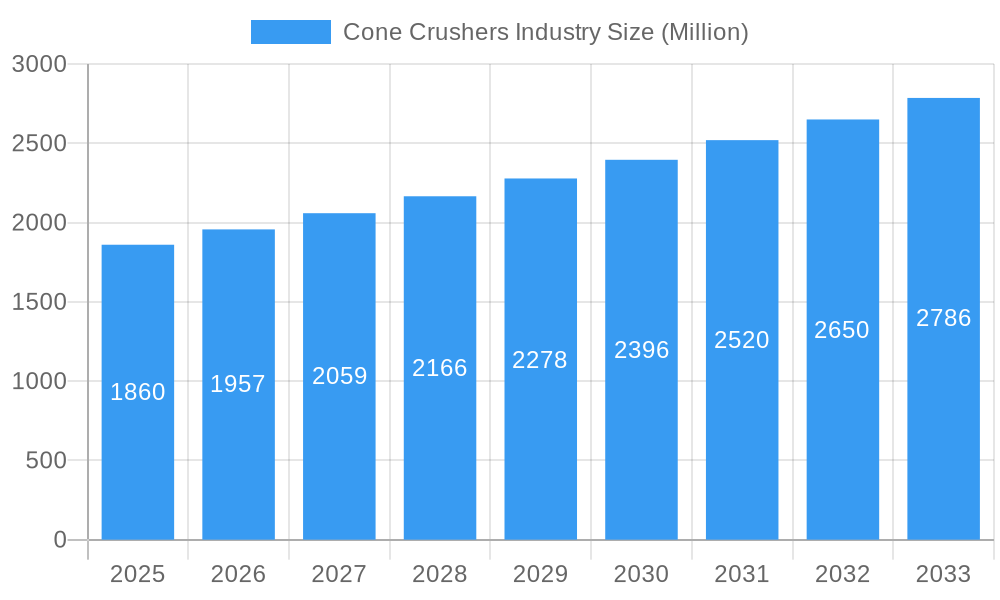
The global Cone Crushers market is projected for robust growth, exhibiting a Compound Annual Growth Rate (CAGR) of 5.10% and anticipated to reach a market size of USD 1.86 billion. This expansion is propelled by escalating demand from the mining and metallurgy sector, driven by increasing global mineral exploration and production activities. Furthermore, the burgeoning construction industry, fueled by infrastructure development projects worldwide, is a significant contributor to market growth. The rising need for efficient aggregate processing in these sectors further solidifies the demand for advanced cone crushing solutions. Technological advancements in crusher design, leading to enhanced energy efficiency, reduced emissions, and improved crushing performance, are also key drivers. The market is witnessing a notable trend towards the adoption of mobile and portable crushing equipment, offering greater flexibility and reduced operational costs for on-site applications in remote mining and construction sites.
Cone Crushers Industry Market Size (In Billion)
While the market demonstrates a healthy upward trajectory, certain restraints could influence its pace. Stringent environmental regulations concerning dust emissions and noise pollution from crushing operations might necessitate significant investments in advanced pollution control technologies, potentially impacting the profitability of smaller players. The high initial capital expenditure associated with sophisticated cone crusher machinery can also be a barrier to entry for some businesses, particularly in developing economies. However, the increasing focus on recycling and waste management in construction and demolition further presents an opportunity for the cone crushers market, as these machines are crucial for processing recycled materials into usable aggregates. The market is characterized by intense competition among established players like Metso Corporation, Sandvik AB, and Terex Corporation, alongside emerging manufacturers, all vying for market share through product innovation and strategic partnerships.
Cone Crushers Industry Company Market Share
Cone Crushers Industry Market Composition & Trends
The global Cone Crushers Industry exhibits a moderate to high level of market concentration, driven by a few dominant global players alongside a growing number of specialized manufacturers. Innovation is a key catalyst, with continuous advancements in crushing efficiency, energy consumption reduction, and automation shaping the competitive landscape. Regulatory frameworks, particularly concerning environmental emissions and workplace safety, significantly influence product design and operational standards. Substitute products, such as impact crushers and jaw crushers, cater to specific application needs, but cone crushers remain indispensable for fine crushing and high reduction ratios. End-user profiles are diverse, spanning the expansive mining and metallurgy sectors, critical construction projects, and the robust aggregate processing industry, with growing applications in demolition and recycling. Mergers and acquisitions (M&A) activity is a notable trend, with strategic consolidations aimed at expanding product portfolios, geographical reach, and technological capabilities. For instance, significant M&A deals valued in the hundreds of millions of dollars have reshaped the industry in recent years, impacting market share distribution.
- Market Concentration: Dominated by a mix of large multinational corporations and specialized regional players.
- Innovation Drivers: Focus on energy efficiency, automation, digital integration, and material handling capabilities.
- Regulatory Influence: Stringent environmental and safety standards are shaping product development and operational practices.
- Substitute Products: Jaw crushers, impact crushers, and screens offer alternative solutions for specific crushing stages.
- End-User Diversity: Key sectors include mining, construction, aggregate processing, and demolition.
- M&A Activity: Strategic acquisitions and mergers are common for market expansion and technological integration.
Cone Crushers Industry Industry Evolution
The Cone Crushers Industry has undergone a remarkable evolution, marked by consistent market growth trajectories and significant technological advancements. From its inception, the industry has been driven by the burgeoning demand for essential materials in infrastructure development, mining operations, and the aggregate sector. The historical period (2019-2024) witnessed a steady upward trend in market valuation, influenced by global economic expansion and increased capital expenditure in mining and construction. The base year (2025) represents a pivotal point, with projections indicating sustained growth throughout the forecast period (2025-2033). This growth is underpinned by technological innovations that have dramatically enhanced the efficiency and versatility of cone crushers. Early models were characterized by simpler mechanical designs, whereas contemporary cone crushers incorporate sophisticated hydraulic systems for superior crushing control, adjustable settings, and enhanced safety features. The adoption of advanced materials for wear parts, coupled with precision engineering, has led to increased throughput, reduced downtime, and extended equipment lifespan. Shifting consumer demands, particularly the increasing emphasis on sustainability and reduced environmental impact, are also shaping the industry. Manufacturers are responding with energy-efficient designs, quieter operation, and crushers capable of processing recycled materials. The integration of smart technologies, including IoT sensors and predictive maintenance capabilities, is further revolutionizing operational efficiency and offering users real-time performance data. This technological evolution is crucial for meeting the increasing demand for processed aggregates and minerals, essential for global infrastructure projects and resource extraction. The adoption rate of advanced cone crusher technologies has been steadily increasing, reflecting the industry's commitment to innovation and customer-centric solutions. The market is projected to continue its upward trajectory, with an estimated compound annual growth rate (CAGR) of approximately 5-7% over the forecast period, driven by robust demand from emerging economies and continuous technological upgrades.
Leading Regions, Countries, or Segments in Cone Crushers Industry
The global Cone Crushers Industry landscape is characterized by a dynamic interplay of regional strengths and segment-specific dominance. Within the Type segment, Hydraulics cone crushers have emerged as a leading category, driven by their superior flexibility, precise control over crushing parameters, and enhanced safety features. The ability to adjust settings remotely and adapt to varying material feed characteristics makes them highly sought after in demanding applications. In terms of Offering, Mobile Crushers are witnessing exceptional growth, fueled by the increasing need for on-site processing and flexibility in construction and quarrying operations. The ability to transport and deploy crushers directly to project sites reduces logistical costs and processing time. The Power Source segment is increasingly tilting towards Electric Connection, owing to its environmental benefits, lower operating costs compared to diesel, and the growing availability of reliable power grids at industrial sites. While Diesel Connection remains crucial for remote locations and mobile units, the long-term trend favors electric power. The End-user Application segment is dominated by Mining and Metallurgy and Construction, which represent the largest consumers of cone crushers due to the scale of operations and the continuous demand for crushed materials. However, Aggregate Processing is a rapidly expanding segment, directly linked to infrastructure development and road construction.
- Dominant Type: Hydraulics cone crushers, offering advanced control and flexibility.
- Leading Offering: Mobile Crushers, providing on-site processing and logistical advantages.
- Growing Power Source Preference: Electric Connection, driven by environmental and cost efficiencies.
- Key End-user Applications: Mining and Metallurgy, Construction, and Aggregate Processing, accounting for the majority of demand.
Key Drivers of Dominance:
- Investment Trends: Significant capital expenditure in the mining sector, particularly for precious metals and industrial minerals, drives demand for high-capacity and efficient crushing equipment.
- Infrastructure Development: Government initiatives and private sector investments in global infrastructure projects, including roads, bridges, and urban development, create sustained demand for aggregates, thereby boosting the aggregate processing segment.
- Technological Advancements: The continuous innovation in hydraulic cone crusher technology, offering finer control, higher reduction ratios, and better energy efficiency, positions them as the preferred choice for many applications.
- Regulatory Support: Favorable government policies and incentives for the mining and construction sectors in key regions stimulate the adoption of advanced crushing machinery.
- Urbanization and Industrialization: Rapid urbanization in emerging economies necessitates large-scale construction activities, directly translating into increased demand for aggregates and, consequently, cone crushers.
The Mining and Metallurgy segment benefits from the global demand for raw materials, essential for various industries, while the Construction segment thrives on residential, commercial, and industrial building projects. The Aggregate Processing segment is closely tied to infrastructure development and road building, experiencing robust growth globally. The increasing trend towards sustainability is also influencing the adoption of cone crushers in Demolition and waste recycling, where they are used to process rubble and convert it into reusable aggregate.
Cone Crushers Industry Product Innovations
Recent product innovations in the Cone Crushers Industry are centered around enhancing operational efficiency, reducing energy consumption, and improving user experience. Manufacturers are increasingly integrating advanced automation and digital technologies, enabling remote monitoring, predictive maintenance, and optimized crushing performance. The development of more robust wear parts, utilizing advanced alloys and heat treatments, significantly extends service life and reduces downtime. Furthermore, advancements in hydraulic systems provide finer control over product size distribution and improved crushing ratios, catering to specific customer requirements. Innovations in electric drive systems and energy recovery mechanisms are also contributing to a more sustainable and cost-effective operation, making these crushers more attractive for environmentally conscious operations.
Propelling Factors for Cone Crushers Industry Growth
The Cone Crushers Industry is propelled by a confluence of robust growth factors. Key among these is the sustained global demand for aggregates and minerals, driven by extensive infrastructure development and a burgeoning construction sector across both developed and developing economies. Technological advancements are continuously enhancing crusher efficiency, reducing energy consumption, and improving automation, making these machines more attractive for operational optimization. Furthermore, the growing emphasis on resource efficiency and recycling in industries like construction and demolition is creating new avenues for cone crusher applications. Favorable government policies and investments in mining exploration and production also play a crucial role in stimulating market growth.
Obstacles in the Cone Crushers Industry Market
Despite a positive growth outlook, the Cone Crushers Industry faces several obstacles. Fluctuations in commodity prices can significantly impact capital expenditure in the mining sector, directly affecting demand for new equipment. Stringent environmental regulations regarding noise pollution and dust emissions necessitate significant investment in mitigation technologies, increasing operational costs. Supply chain disruptions, particularly for specialized components and raw materials, can lead to production delays and increased manufacturing costs. Intense competition among a large number of manufacturers, including both established players and new entrants, can lead to price pressures and reduced profit margins, particularly for standard product offerings.
Future Opportunities in Cone Crushers Industry
The Cone Crushers Industry is ripe with future opportunities. The increasing global focus on sustainable mining practices and the circular economy presents a significant opportunity for crushers capable of processing recycled construction and demolition waste into valuable aggregates. Emerging markets in Asia, Africa, and Latin America, with their rapid infrastructure development and growing mining activities, offer substantial untapped potential. Advancements in digitalization and smart technologies, such as AI-powered optimization and IoT-enabled monitoring, will create opportunities for value-added services and predictive maintenance solutions. The development of smaller, more portable, and highly efficient crushers will also cater to niche markets and specialized applications.
Major Players in the Cone Crushers Industry Ecosystem
- Metso Corporation
- Keestrack NV
- McCloskey International Limited
- Astec Industries Inc
- Thyssenkrupp AG
- Puzzolana Machinery Fabricators LLP
- Tesab Engineering Ltd
- SANDVIK AB
- WESTPRO Machinery Inc
- FLSmidth & Co A/S
- Terex Corporation
Key Developments in Cone Crushers Industry Industry
- April 2022: FLSmidth secured a significant contract to provide complete equipment and processing flowsheets, including ore leaching, for Sabina Gold & Silver Corp.'s Goose gold mine in Nunavut, Canada. The order, valued at DKK 270 million, booked in Q2 2022, includes a jaw crusher, Raptor Cone Crushers, ball mill, VXP-Stirred Mill, KREBS cyclones, pumps, screens, feeders, and Knelson gravity concentrators. This development underscores FLSmidth's capabilities in integrated processing solutions for the mining sector.
- March 2022: Sandvik launched its UK373 wheeled cone crusher and surface drills rental fleet in the United States, alongside showcasing its CH440 cone crusher and rock tools. The electrically-driven UK373 offers a closed-circuit crushing solution on a quad-axle trailer, highlighting Sandvik's commitment to mobile crushing solutions. The CH440, designed for high-capacity secondary, tertiary, or pebble-crushing applications, demonstrates Sandvik's focus on versatility and adaptability to changing production demands.
Strategic Cone Crushers Industry Market Forecast
The strategic forecast for the Cone Crushers Industry indicates a period of sustained and robust growth, driven by the fundamental need for processed aggregates and minerals in global infrastructure development and resource extraction. Key growth catalysts include escalating demand from emerging economies undergoing rapid industrialization and urbanization, coupled with continuous technological advancements that enhance efficiency, reduce environmental impact, and enable greater automation. The increasing adoption of mobile and electric-powered cone crushers, alongside the growing application of these machines in recycling and waste management, further solidifies their market potential. The industry is poised for significant expansion as it adapts to evolving market demands for sustainability and digital integration.
Cone Crushers Industry Segmentation
-
1. Type
- 1.1. Symons
- 1.2. Hydraulics
- 1.3. Gyratory
- 1.4. Other Types
-
2. Offering
- 2.1. Mobile Crushers
- 2.2. Portable Crushers
- 2.3. Stationary Crushers
-
3. Power Source
- 3.1. Electric Connection
- 3.2. Diesel Connection
- 3.3. Dual Connection
-
4. End-user Application
- 4.1. Mining and Metallurgy
- 4.2. Construction
- 4.3. Aggregate Processing
- 4.4. Demolition
- 4.5. Other End-user Applications
Cone Crushers Industry Segmentation By Geography
-
1. North America
- 1.1. United States
- 1.2. Canada
-
2. Europe
- 2.1. United Kingdom
- 2.2. Germany
- 2.3. France
- 2.4. Rest of Europe
-
3. Asia Pacific
- 3.1. India
- 3.2. China
- 3.3. Japan
- 3.4. Rest of Asia Pacific
-
4. Latin America
- 4.1. Brazil
- 4.2. Argentina
- 4.3. Mexico
- 4.4. Rest of Latin America
-
5. Middle East and Africa
- 5.1. United Arab Emirates
- 5.2. Saudi Arabia
- 5.3. South Africa
- 5.4. Rest of Middle East and Africa
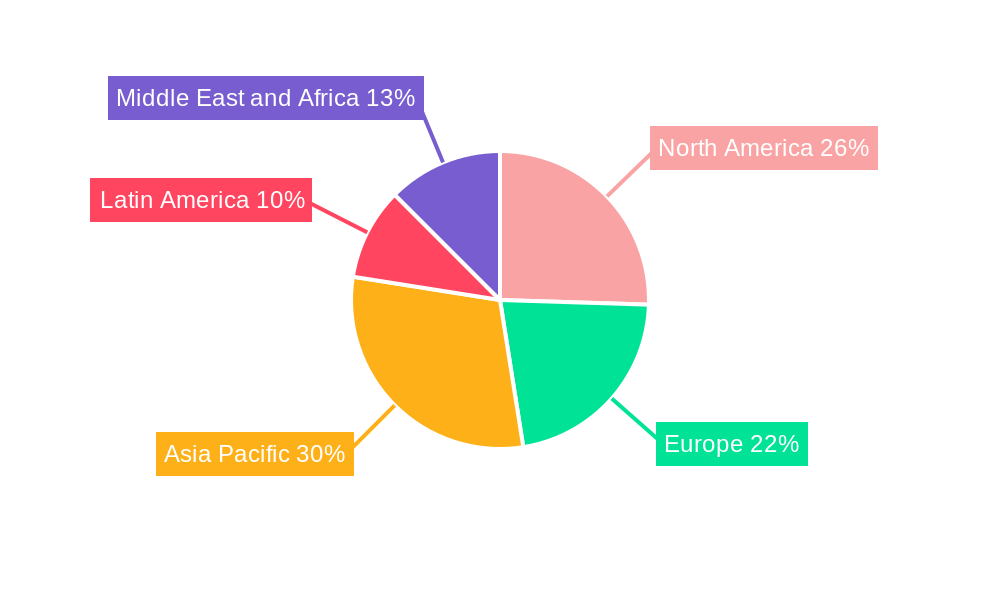
Cone Crushers Industry Regional Market Share
Geographic Coverage of Cone Crushers Industry
Cone Crushers Industry REPORT HIGHLIGHTS
| Aspects | Details |
|---|---|
| Study Period | 2020-2034 |
| Base Year | 2025 |
| Estimated Year | 2026 |
| Forecast Period | 2026-2034 |
| Historical Period | 2020-2025 |
| Growth Rate | CAGR of 5.10% from 2020-2034 |
| Segmentation |
|
Table of Contents
- 1. Introduction
- 1.1. Research Scope
- 1.2. Market Segmentation
- 1.3. Research Methodology
- 1.4. Definitions and Assumptions
- 2. Executive Summary
- 2.1. Introduction
- 3. Market Dynamics
- 3.1. Introduction
- 3.2. Market Drivers
- 3.2.1. Increased Demand in the Mining Sector in the Emerging Market; Growth of the Construction Industry
- 3.3. Market Restrains
- 3.3.1. Effects of Carbon Emission from Machinery
- 3.4. Market Trends
- 3.4.1. The Construction Segment is Expected to Hold a Major Market Share
- 4. Market Factor Analysis
- 4.1. Porters Five Forces
- 4.2. Supply/Value Chain
- 4.3. PESTEL analysis
- 4.4. Market Entropy
- 4.5. Patent/Trademark Analysis
- 5. Global Cone Crushers Industry Analysis, Insights and Forecast, 2020-2032
- 5.1. Market Analysis, Insights and Forecast - by Type
- 5.1.1. Symons
- 5.1.2. Hydraulics
- 5.1.3. Gyratory
- 5.1.4. Other Types
- 5.2. Market Analysis, Insights and Forecast - by Offering
- 5.2.1. Mobile Crushers
- 5.2.2. Portable Crushers
- 5.2.3. Stationary Crushers
- 5.3. Market Analysis, Insights and Forecast - by Power Source
- 5.3.1. Electric Connection
- 5.3.2. Diesel Connection
- 5.3.3. Dual Connection
- 5.4. Market Analysis, Insights and Forecast - by End-user Application
- 5.4.1. Mining and Metallurgy
- 5.4.2. Construction
- 5.4.3. Aggregate Processing
- 5.4.4. Demolition
- 5.4.5. Other End-user Applications
- 5.5. Market Analysis, Insights and Forecast - by Region
- 5.5.1. North America
- 5.5.2. Europe
- 5.5.3. Asia Pacific
- 5.5.4. Latin America
- 5.5.5. Middle East and Africa
- 5.1. Market Analysis, Insights and Forecast - by Type
- 6. North America Cone Crushers Industry Analysis, Insights and Forecast, 2020-2032
- 6.1. Market Analysis, Insights and Forecast - by Type
- 6.1.1. Symons
- 6.1.2. Hydraulics
- 6.1.3. Gyratory
- 6.1.4. Other Types
- 6.2. Market Analysis, Insights and Forecast - by Offering
- 6.2.1. Mobile Crushers
- 6.2.2. Portable Crushers
- 6.2.3. Stationary Crushers
- 6.3. Market Analysis, Insights and Forecast - by Power Source
- 6.3.1. Electric Connection
- 6.3.2. Diesel Connection
- 6.3.3. Dual Connection
- 6.4. Market Analysis, Insights and Forecast - by End-user Application
- 6.4.1. Mining and Metallurgy
- 6.4.2. Construction
- 6.4.3. Aggregate Processing
- 6.4.4. Demolition
- 6.4.5. Other End-user Applications
- 6.1. Market Analysis, Insights and Forecast - by Type
- 7. Europe Cone Crushers Industry Analysis, Insights and Forecast, 2020-2032
- 7.1. Market Analysis, Insights and Forecast - by Type
- 7.1.1. Symons
- 7.1.2. Hydraulics
- 7.1.3. Gyratory
- 7.1.4. Other Types
- 7.2. Market Analysis, Insights and Forecast - by Offering
- 7.2.1. Mobile Crushers
- 7.2.2. Portable Crushers
- 7.2.3. Stationary Crushers
- 7.3. Market Analysis, Insights and Forecast - by Power Source
- 7.3.1. Electric Connection
- 7.3.2. Diesel Connection
- 7.3.3. Dual Connection
- 7.4. Market Analysis, Insights and Forecast - by End-user Application
- 7.4.1. Mining and Metallurgy
- 7.4.2. Construction
- 7.4.3. Aggregate Processing
- 7.4.4. Demolition
- 7.4.5. Other End-user Applications
- 7.1. Market Analysis, Insights and Forecast - by Type
- 8. Asia Pacific Cone Crushers Industry Analysis, Insights and Forecast, 2020-2032
- 8.1. Market Analysis, Insights and Forecast - by Type
- 8.1.1. Symons
- 8.1.2. Hydraulics
- 8.1.3. Gyratory
- 8.1.4. Other Types
- 8.2. Market Analysis, Insights and Forecast - by Offering
- 8.2.1. Mobile Crushers
- 8.2.2. Portable Crushers
- 8.2.3. Stationary Crushers
- 8.3. Market Analysis, Insights and Forecast - by Power Source
- 8.3.1. Electric Connection
- 8.3.2. Diesel Connection
- 8.3.3. Dual Connection
- 8.4. Market Analysis, Insights and Forecast - by End-user Application
- 8.4.1. Mining and Metallurgy
- 8.4.2. Construction
- 8.4.3. Aggregate Processing
- 8.4.4. Demolition
- 8.4.5. Other End-user Applications
- 8.1. Market Analysis, Insights and Forecast - by Type
- 9. Latin America Cone Crushers Industry Analysis, Insights and Forecast, 2020-2032
- 9.1. Market Analysis, Insights and Forecast - by Type
- 9.1.1. Symons
- 9.1.2. Hydraulics
- 9.1.3. Gyratory
- 9.1.4. Other Types
- 9.2. Market Analysis, Insights and Forecast - by Offering
- 9.2.1. Mobile Crushers
- 9.2.2. Portable Crushers
- 9.2.3. Stationary Crushers
- 9.3. Market Analysis, Insights and Forecast - by Power Source
- 9.3.1. Electric Connection
- 9.3.2. Diesel Connection
- 9.3.3. Dual Connection
- 9.4. Market Analysis, Insights and Forecast - by End-user Application
- 9.4.1. Mining and Metallurgy
- 9.4.2. Construction
- 9.4.3. Aggregate Processing
- 9.4.4. Demolition
- 9.4.5. Other End-user Applications
- 9.1. Market Analysis, Insights and Forecast - by Type
- 10. Middle East and Africa Cone Crushers Industry Analysis, Insights and Forecast, 2020-2032
- 10.1. Market Analysis, Insights and Forecast - by Type
- 10.1.1. Symons
- 10.1.2. Hydraulics
- 10.1.3. Gyratory
- 10.1.4. Other Types
- 10.2. Market Analysis, Insights and Forecast - by Offering
- 10.2.1. Mobile Crushers
- 10.2.2. Portable Crushers
- 10.2.3. Stationary Crushers
- 10.3. Market Analysis, Insights and Forecast - by Power Source
- 10.3.1. Electric Connection
- 10.3.2. Diesel Connection
- 10.3.3. Dual Connection
- 10.4. Market Analysis, Insights and Forecast - by End-user Application
- 10.4.1. Mining and Metallurgy
- 10.4.2. Construction
- 10.4.3. Aggregate Processing
- 10.4.4. Demolition
- 10.4.5. Other End-user Applications
- 10.1. Market Analysis, Insights and Forecast - by Type
- 11. Competitive Analysis
- 11.1. Global Market Share Analysis 2025
- 11.2. Company Profiles
- 11.2.1 Metso Corporation
- 11.2.1.1. Overview
- 11.2.1.2. Products
- 11.2.1.3. SWOT Analysis
- 11.2.1.4. Recent Developments
- 11.2.1.5. Financials (Based on Availability)
- 11.2.2 Keestrack NV
- 11.2.2.1. Overview
- 11.2.2.2. Products
- 11.2.2.3. SWOT Analysis
- 11.2.2.4. Recent Developments
- 11.2.2.5. Financials (Based on Availability)
- 11.2.3 McCloskey International Limited
- 11.2.3.1. Overview
- 11.2.3.2. Products
- 11.2.3.3. SWOT Analysis
- 11.2.3.4. Recent Developments
- 11.2.3.5. Financials (Based on Availability)
- 11.2.4 Astec Industries Inc
- 11.2.4.1. Overview
- 11.2.4.2. Products
- 11.2.4.3. SWOT Analysis
- 11.2.4.4. Recent Developments
- 11.2.4.5. Financials (Based on Availability)
- 11.2.5 Thyssenkrupp AG
- 11.2.5.1. Overview
- 11.2.5.2. Products
- 11.2.5.3. SWOT Analysis
- 11.2.5.4. Recent Developments
- 11.2.5.5. Financials (Based on Availability)
- 11.2.6 Puzzolana Machinery Fabricators LLP
- 11.2.6.1. Overview
- 11.2.6.2. Products
- 11.2.6.3. SWOT Analysis
- 11.2.6.4. Recent Developments
- 11.2.6.5. Financials (Based on Availability)
- 11.2.7 Tesab Engineering Ltd*List Not Exhaustive
- 11.2.7.1. Overview
- 11.2.7.2. Products
- 11.2.7.3. SWOT Analysis
- 11.2.7.4. Recent Developments
- 11.2.7.5. Financials (Based on Availability)
- 11.2.8 SANDVIK AB
- 11.2.8.1. Overview
- 11.2.8.2. Products
- 11.2.8.3. SWOT Analysis
- 11.2.8.4. Recent Developments
- 11.2.8.5. Financials (Based on Availability)
- 11.2.9 WESTPRO Machinery Inc
- 11.2.9.1. Overview
- 11.2.9.2. Products
- 11.2.9.3. SWOT Analysis
- 11.2.9.4. Recent Developments
- 11.2.9.5. Financials (Based on Availability)
- 11.2.10 FLSmidth & Co A/S
- 11.2.10.1. Overview
- 11.2.10.2. Products
- 11.2.10.3. SWOT Analysis
- 11.2.10.4. Recent Developments
- 11.2.10.5. Financials (Based on Availability)
- 11.2.11 Terex Corporation
- 11.2.11.1. Overview
- 11.2.11.2. Products
- 11.2.11.3. SWOT Analysis
- 11.2.11.4. Recent Developments
- 11.2.11.5. Financials (Based on Availability)
- 11.2.1 Metso Corporation
List of Figures
- Figure 1: Global Cone Crushers Industry Revenue Breakdown (Million, %) by Region 2025 & 2033
- Figure 2: North America Cone Crushers Industry Revenue (Million), by Type 2025 & 2033
- Figure 3: North America Cone Crushers Industry Revenue Share (%), by Type 2025 & 2033
- Figure 4: North America Cone Crushers Industry Revenue (Million), by Offering 2025 & 2033
- Figure 5: North America Cone Crushers Industry Revenue Share (%), by Offering 2025 & 2033
- Figure 6: North America Cone Crushers Industry Revenue (Million), by Power Source 2025 & 2033
- Figure 7: North America Cone Crushers Industry Revenue Share (%), by Power Source 2025 & 2033
- Figure 8: North America Cone Crushers Industry Revenue (Million), by End-user Application 2025 & 2033
- Figure 9: North America Cone Crushers Industry Revenue Share (%), by End-user Application 2025 & 2033
- Figure 10: North America Cone Crushers Industry Revenue (Million), by Country 2025 & 2033
- Figure 11: North America Cone Crushers Industry Revenue Share (%), by Country 2025 & 2033
- Figure 12: Europe Cone Crushers Industry Revenue (Million), by Type 2025 & 2033
- Figure 13: Europe Cone Crushers Industry Revenue Share (%), by Type 2025 & 2033
- Figure 14: Europe Cone Crushers Industry Revenue (Million), by Offering 2025 & 2033
- Figure 15: Europe Cone Crushers Industry Revenue Share (%), by Offering 2025 & 2033
- Figure 16: Europe Cone Crushers Industry Revenue (Million), by Power Source 2025 & 2033
- Figure 17: Europe Cone Crushers Industry Revenue Share (%), by Power Source 2025 & 2033
- Figure 18: Europe Cone Crushers Industry Revenue (Million), by End-user Application 2025 & 2033
- Figure 19: Europe Cone Crushers Industry Revenue Share (%), by End-user Application 2025 & 2033
- Figure 20: Europe Cone Crushers Industry Revenue (Million), by Country 2025 & 2033
- Figure 21: Europe Cone Crushers Industry Revenue Share (%), by Country 2025 & 2033
- Figure 22: Asia Pacific Cone Crushers Industry Revenue (Million), by Type 2025 & 2033
- Figure 23: Asia Pacific Cone Crushers Industry Revenue Share (%), by Type 2025 & 2033
- Figure 24: Asia Pacific Cone Crushers Industry Revenue (Million), by Offering 2025 & 2033
- Figure 25: Asia Pacific Cone Crushers Industry Revenue Share (%), by Offering 2025 & 2033
- Figure 26: Asia Pacific Cone Crushers Industry Revenue (Million), by Power Source 2025 & 2033
- Figure 27: Asia Pacific Cone Crushers Industry Revenue Share (%), by Power Source 2025 & 2033
- Figure 28: Asia Pacific Cone Crushers Industry Revenue (Million), by End-user Application 2025 & 2033
- Figure 29: Asia Pacific Cone Crushers Industry Revenue Share (%), by End-user Application 2025 & 2033
- Figure 30: Asia Pacific Cone Crushers Industry Revenue (Million), by Country 2025 & 2033
- Figure 31: Asia Pacific Cone Crushers Industry Revenue Share (%), by Country 2025 & 2033
- Figure 32: Latin America Cone Crushers Industry Revenue (Million), by Type 2025 & 2033
- Figure 33: Latin America Cone Crushers Industry Revenue Share (%), by Type 2025 & 2033
- Figure 34: Latin America Cone Crushers Industry Revenue (Million), by Offering 2025 & 2033
- Figure 35: Latin America Cone Crushers Industry Revenue Share (%), by Offering 2025 & 2033
- Figure 36: Latin America Cone Crushers Industry Revenue (Million), by Power Source 2025 & 2033
- Figure 37: Latin America Cone Crushers Industry Revenue Share (%), by Power Source 2025 & 2033
- Figure 38: Latin America Cone Crushers Industry Revenue (Million), by End-user Application 2025 & 2033
- Figure 39: Latin America Cone Crushers Industry Revenue Share (%), by End-user Application 2025 & 2033
- Figure 40: Latin America Cone Crushers Industry Revenue (Million), by Country 2025 & 2033
- Figure 41: Latin America Cone Crushers Industry Revenue Share (%), by Country 2025 & 2033
- Figure 42: Middle East and Africa Cone Crushers Industry Revenue (Million), by Type 2025 & 2033
- Figure 43: Middle East and Africa Cone Crushers Industry Revenue Share (%), by Type 2025 & 2033
- Figure 44: Middle East and Africa Cone Crushers Industry Revenue (Million), by Offering 2025 & 2033
- Figure 45: Middle East and Africa Cone Crushers Industry Revenue Share (%), by Offering 2025 & 2033
- Figure 46: Middle East and Africa Cone Crushers Industry Revenue (Million), by Power Source 2025 & 2033
- Figure 47: Middle East and Africa Cone Crushers Industry Revenue Share (%), by Power Source 2025 & 2033
- Figure 48: Middle East and Africa Cone Crushers Industry Revenue (Million), by End-user Application 2025 & 2033
- Figure 49: Middle East and Africa Cone Crushers Industry Revenue Share (%), by End-user Application 2025 & 2033
- Figure 50: Middle East and Africa Cone Crushers Industry Revenue (Million), by Country 2025 & 2033
- Figure 51: Middle East and Africa Cone Crushers Industry Revenue Share (%), by Country 2025 & 2033
List of Tables
- Table 1: Global Cone Crushers Industry Revenue Million Forecast, by Type 2020 & 2033
- Table 2: Global Cone Crushers Industry Revenue Million Forecast, by Offering 2020 & 2033
- Table 3: Global Cone Crushers Industry Revenue Million Forecast, by Power Source 2020 & 2033
- Table 4: Global Cone Crushers Industry Revenue Million Forecast, by End-user Application 2020 & 2033
- Table 5: Global Cone Crushers Industry Revenue Million Forecast, by Region 2020 & 2033
- Table 6: Global Cone Crushers Industry Revenue Million Forecast, by Type 2020 & 2033
- Table 7: Global Cone Crushers Industry Revenue Million Forecast, by Offering 2020 & 2033
- Table 8: Global Cone Crushers Industry Revenue Million Forecast, by Power Source 2020 & 2033
- Table 9: Global Cone Crushers Industry Revenue Million Forecast, by End-user Application 2020 & 2033
- Table 10: Global Cone Crushers Industry Revenue Million Forecast, by Country 2020 & 2033
- Table 11: United States Cone Crushers Industry Revenue (Million) Forecast, by Application 2020 & 2033
- Table 12: Canada Cone Crushers Industry Revenue (Million) Forecast, by Application 2020 & 2033
- Table 13: Global Cone Crushers Industry Revenue Million Forecast, by Type 2020 & 2033
- Table 14: Global Cone Crushers Industry Revenue Million Forecast, by Offering 2020 & 2033
- Table 15: Global Cone Crushers Industry Revenue Million Forecast, by Power Source 2020 & 2033
- Table 16: Global Cone Crushers Industry Revenue Million Forecast, by End-user Application 2020 & 2033
- Table 17: Global Cone Crushers Industry Revenue Million Forecast, by Country 2020 & 2033
- Table 18: United Kingdom Cone Crushers Industry Revenue (Million) Forecast, by Application 2020 & 2033
- Table 19: Germany Cone Crushers Industry Revenue (Million) Forecast, by Application 2020 & 2033
- Table 20: France Cone Crushers Industry Revenue (Million) Forecast, by Application 2020 & 2033
- Table 21: Rest of Europe Cone Crushers Industry Revenue (Million) Forecast, by Application 2020 & 2033
- Table 22: Global Cone Crushers Industry Revenue Million Forecast, by Type 2020 & 2033
- Table 23: Global Cone Crushers Industry Revenue Million Forecast, by Offering 2020 & 2033
- Table 24: Global Cone Crushers Industry Revenue Million Forecast, by Power Source 2020 & 2033
- Table 25: Global Cone Crushers Industry Revenue Million Forecast, by End-user Application 2020 & 2033
- Table 26: Global Cone Crushers Industry Revenue Million Forecast, by Country 2020 & 2033
- Table 27: India Cone Crushers Industry Revenue (Million) Forecast, by Application 2020 & 2033
- Table 28: China Cone Crushers Industry Revenue (Million) Forecast, by Application 2020 & 2033
- Table 29: Japan Cone Crushers Industry Revenue (Million) Forecast, by Application 2020 & 2033
- Table 30: Rest of Asia Pacific Cone Crushers Industry Revenue (Million) Forecast, by Application 2020 & 2033
- Table 31: Global Cone Crushers Industry Revenue Million Forecast, by Type 2020 & 2033
- Table 32: Global Cone Crushers Industry Revenue Million Forecast, by Offering 2020 & 2033
- Table 33: Global Cone Crushers Industry Revenue Million Forecast, by Power Source 2020 & 2033
- Table 34: Global Cone Crushers Industry Revenue Million Forecast, by End-user Application 2020 & 2033
- Table 35: Global Cone Crushers Industry Revenue Million Forecast, by Country 2020 & 2033
- Table 36: Brazil Cone Crushers Industry Revenue (Million) Forecast, by Application 2020 & 2033
- Table 37: Argentina Cone Crushers Industry Revenue (Million) Forecast, by Application 2020 & 2033
- Table 38: Mexico Cone Crushers Industry Revenue (Million) Forecast, by Application 2020 & 2033
- Table 39: Rest of Latin America Cone Crushers Industry Revenue (Million) Forecast, by Application 2020 & 2033
- Table 40: Global Cone Crushers Industry Revenue Million Forecast, by Type 2020 & 2033
- Table 41: Global Cone Crushers Industry Revenue Million Forecast, by Offering 2020 & 2033
- Table 42: Global Cone Crushers Industry Revenue Million Forecast, by Power Source 2020 & 2033
- Table 43: Global Cone Crushers Industry Revenue Million Forecast, by End-user Application 2020 & 2033
- Table 44: Global Cone Crushers Industry Revenue Million Forecast, by Country 2020 & 2033
- Table 45: United Arab Emirates Cone Crushers Industry Revenue (Million) Forecast, by Application 2020 & 2033
- Table 46: Saudi Arabia Cone Crushers Industry Revenue (Million) Forecast, by Application 2020 & 2033
- Table 47: South Africa Cone Crushers Industry Revenue (Million) Forecast, by Application 2020 & 2033
- Table 48: Rest of Middle East and Africa Cone Crushers Industry Revenue (Million) Forecast, by Application 2020 & 2033
Frequently Asked Questions
1. What is the projected Compound Annual Growth Rate (CAGR) of the Cone Crushers Industry?
The projected CAGR is approximately 5.10%.
2. Which companies are prominent players in the Cone Crushers Industry?
Key companies in the market include Metso Corporation, Keestrack NV, McCloskey International Limited, Astec Industries Inc, Thyssenkrupp AG, Puzzolana Machinery Fabricators LLP, Tesab Engineering Ltd*List Not Exhaustive, SANDVIK AB, WESTPRO Machinery Inc, FLSmidth & Co A/S, Terex Corporation.
3. What are the main segments of the Cone Crushers Industry?
The market segments include Type, Offering, Power Source, End-user Application.
4. Can you provide details about the market size?
The market size is estimated to be USD 1.86 Million as of 2022.
5. What are some drivers contributing to market growth?
Increased Demand in the Mining Sector in the Emerging Market; Growth of the Construction Industry.
6. What are the notable trends driving market growth?
The Construction Segment is Expected to Hold a Major Market Share.
7. Are there any restraints impacting market growth?
Effects of Carbon Emission from Machinery.
8. Can you provide examples of recent developments in the market?
April 2022 - FLSmidth was chosen to provide complete equipment and processing flowsheet, including ore leaching, for Sabina Gold & Silver Corp.'s Goose gold mine in Nunavut, Canada. The order is valued at DKK 270 million and was booked in Q2 2022. The equipment would be delivered in mid-2023, ahead of the mine start-up date in Q1 2025. FLSmidth would supply the jaw crusher, Raptor Cone Crushers, ball mill, VXP-Stirred Mill (secondary grinding), KREBS cyclones, pumps, screens, feeders, and Knelson gravity concentrators. The order also comprises equipment for pre-oxidation and leaching; carbon in pulp (CIP) extraction; absorption, desorption, and refining (ADR); and detoxification.
9. What pricing options are available for accessing the report?
Pricing options include single-user, multi-user, and enterprise licenses priced at USD 4750, USD 5250, and USD 8750 respectively.
10. Is the market size provided in terms of value or volume?
The market size is provided in terms of value, measured in Million.
11. Are there any specific market keywords associated with the report?
Yes, the market keyword associated with the report is "Cone Crushers Industry," which aids in identifying and referencing the specific market segment covered.
12. How do I determine which pricing option suits my needs best?
The pricing options vary based on user requirements and access needs. Individual users may opt for single-user licenses, while businesses requiring broader access may choose multi-user or enterprise licenses for cost-effective access to the report.
13. Are there any additional resources or data provided in the Cone Crushers Industry report?
While the report offers comprehensive insights, it's advisable to review the specific contents or supplementary materials provided to ascertain if additional resources or data are available.
14. How can I stay updated on further developments or reports in the Cone Crushers Industry?
To stay informed about further developments, trends, and reports in the Cone Crushers Industry, consider subscribing to industry newsletters, following relevant companies and organizations, or regularly checking reputable industry news sources and publications.
Methodology
Step 1 - Identification of Relevant Samples Size from Population Database


Step 2 - Approaches for Defining Global Market Size (Value, Volume* & Price*)

Note*: In applicable scenarios
Step 3 - Data Sources
Primary Research
- Web Analytics
- Survey Reports
- Research Institute
- Latest Research Reports
- Opinion Leaders
Secondary Research
- Annual Reports
- White Paper
- Latest Press Release
- Industry Association
- Paid Database
- Investor Presentations

Step 4 - Data Triangulation
Involves using different sources of information in order to increase the validity of a study
These sources are likely to be stakeholders in a program - participants, other researchers, program staff, other community members, and so on.
Then we put all data in single framework & apply various statistical tools to find out the dynamic on the market.
During the analysis stage, feedback from the stakeholder groups would be compared to determine areas of agreement as well as areas of divergence