

Key Insights
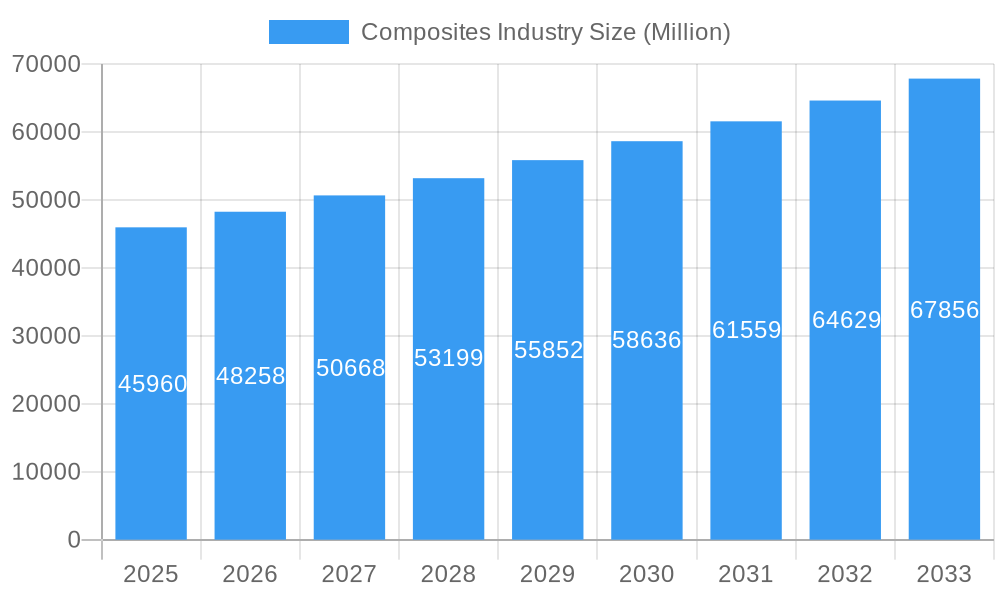
The global composites market, valued at $45.96 billion in 2025, is projected to experience robust growth, exceeding a 5% CAGR through 2033. This expansion is driven by several key factors. Increasing demand from the automotive and transportation sectors, fueled by the lightweighting trend for improved fuel efficiency and performance, is a significant contributor. The burgeoning renewable energy sector, particularly wind energy, presents another substantial growth opportunity, with composites playing a crucial role in turbine blades and other components. Furthermore, the aerospace and defense industries are major consumers of high-performance composites, driven by the need for stronger, lighter, and more durable aircraft and military equipment. Advancements in material science, leading to the development of novel high-strength, high-temperature resistant composites, further bolster market growth. While the high initial cost of composites can be a restraint, ongoing technological improvements and economies of scale are gradually mitigating this challenge. The market is segmented by matrix material (polymer, ceramic/carbon, metal), reinforcement fiber (glass, carbon, aramid), and end-use application. Polymer matrix composites (PMCs) currently dominate the market due to their cost-effectiveness and versatility, but ceramic and carbon matrix composites (CMCs) are expected to witness significant growth driven by their superior performance in high-temperature applications. Key players like SGL Carbon, Solvay, 3M, and Toray Industries are actively investing in R&D and expanding their production capacities to meet the rising demand. Geographic distribution shows a strong presence across North America, Europe, and Asia Pacific, with China and the US being leading consumers.
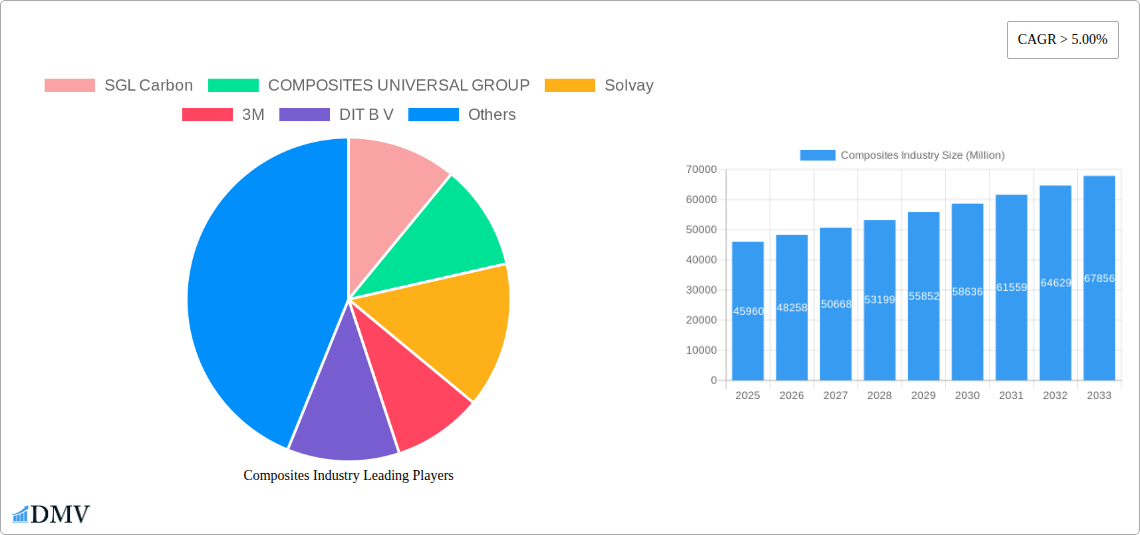
Composites Industry Market Size (In Billion)
The competitive landscape is characterized by both established industry giants and emerging players. While large multinational corporations possess extensive manufacturing capabilities and global reach, smaller companies are innovating with specialized materials and applications. Strategic partnerships, mergers, and acquisitions are common strategies to enhance market share and technological advancements. Future growth will depend on continued innovation in materials science, cost reductions through improved manufacturing processes, and the successful integration of composites in new and emerging applications. Government initiatives promoting sustainable materials and energy efficiency are also expected to positively influence market growth. The continued adoption of composites in infrastructure projects like construction and pipes and tanks will also contribute to the market's overall expansion. The market's resilience to economic fluctuations, owing to its essential role in key industries, makes it a particularly attractive investment opportunity for the foreseeable future.
Composites Industry Company Market Share
Composites Industry Market Report: 2019-2033
This comprehensive report provides an in-depth analysis of the global composites industry, projecting a market value exceeding USD xx million by 2033. We analyze market dynamics, technological advancements, and key player strategies across various segments, offering invaluable insights for stakeholders seeking to navigate this rapidly evolving landscape. The study period covers 2019-2033, with 2025 as the base and estimated year.
Composites Industry Market Composition & Trends
The global composites market, valued at USD xx million in 2024, exhibits a moderately concentrated landscape with several major players vying for market share. Market leaders like 3M, Solvay, and Owens Corning hold significant positions, although the distribution is dynamic due to ongoing mergers and acquisitions (M&A) activities. Innovation is driven by the need for lighter, stronger, and more sustainable materials, particularly in the automotive, aerospace, and wind energy sectors. Stringent regulatory frameworks concerning environmental impact and safety standards influence material selection and manufacturing processes. Substitute materials, such as traditional metals and alloys, continue to compete, posing a challenge to the industry. End-users increasingly demand customized solutions and higher performance characteristics, driving further innovation. M&A activity is substantial; for instance, Owens Corning's USD 3.9 billion acquisition of Masonite in February 2024 significantly reshaped the building and construction materials segment.
- Market Concentration: Moderately concentrated, with top players holding xx% market share.
- Innovation Catalysts: Lightweighting needs, sustainability concerns, demand for high-performance materials.
- Regulatory Landscape: Stringent environmental and safety regulations impacting material choices.
- Substitute Products: Metals, alloys, and other traditional materials.
- End-User Profiles: Automotive, aerospace, wind energy, construction, and electronics industries.
- M&A Activity: Significant activity, with deal values exceeding USD xx million annually. Examples include Owens Corning's Masonite acquisition and Solvay's collaboration with Spirit AeroSystems.
Composites Industry Industry Evolution
The composites industry demonstrates a robust growth trajectory, fueled by technological breakthroughs and shifting consumer preferences towards lighter, more durable, and environmentally friendly products. From 2019 to 2024, the market witnessed a Compound Annual Growth Rate (CAGR) of xx%, driven primarily by increased demand from the automotive and aerospace sectors. Advancements in material science, such as the development of high-performance thermoplastic resins and advanced fiber architectures, are further propelling market expansion. Consumer demand for lightweight vehicles and fuel-efficient aircraft is significantly impacting material selection. The incorporation of recycled materials and sustainable manufacturing processes is gaining traction, enhancing the industry's environmental profile. This is expected to continue, with a projected CAGR of xx% during the forecast period (2025-2033). Adoption of new materials and processes varies significantly by industry segment and geographic region.
Leading Regions, Countries, or Segments in Composites Industry
The North American and European regions currently dominate the composites market, driven by robust aerospace and automotive industries and substantial investments in renewable energy infrastructure. Within material segments, Polymer Matrix Composites (PMC) hold the largest market share, followed by Ceramic/Carbon Matrix Composites (CMCs). Glass fiber remains the most widely used reinforcement material due to its cost-effectiveness, while carbon fiber continues to gain traction in high-performance applications. The automotive and transportation segment is the primary end-use application.
- Key Drivers:
- North America: Strong aerospace and automotive sectors, significant government investments in renewable energy.
- Europe: Well-established manufacturing base, strong focus on sustainability and innovation.
- Asia-Pacific: Rapid industrialization, growing automotive and wind energy sectors.
- PMC: Cost-effectiveness, versatility, and wide range of applications.
- Glass Fiber: Cost-effectiveness and ease of processing.
- Automotive and Transportation: High demand for lightweight and fuel-efficient vehicles.
Composites Industry Product Innovations
Recent innovations focus on developing high-performance, lightweight, and sustainable composite materials. Advancements in resin systems, such as the introduction of bio-based resins and improved thermoplastic materials, enhance the environmental profile and mechanical properties of composites. Novel fiber architectures, including hybrid fiber reinforcement and advanced carbon fiber technologies, deliver superior strength and stiffness. These advancements are driving applications in various sectors, expanding the market reach and competitiveness of the composites industry.
Propelling Factors for Composites Industry Growth
Technological advancements, economic growth, and supportive government policies are driving substantial growth. The development of high-performance materials, such as advanced carbon fibers and bio-based resins, is expanding applications in diverse sectors. Increasing demand for lightweight and fuel-efficient vehicles fuels growth in the automotive sector. Government initiatives promoting renewable energy sources, such as wind energy, further bolster market expansion.
Obstacles in the Composites Industry Market
High raw material costs, supply chain disruptions, and intense competition pose significant challenges. Fluctuations in raw material prices, particularly for carbon fiber and resins, impact profitability. Supply chain vulnerabilities, exacerbated by geopolitical events, create production uncertainties. Intense competition from established materials and emerging technologies requires continuous innovation and cost optimization.
Future Opportunities in Composites Industry
Expanding applications in renewable energy, electric vehicles, and infrastructure development present significant opportunities. The development of advanced bio-based composites and recyclable materials enhances sustainability and reduces environmental impact. Growing demand for lightweight structures in aerospace and construction sectors creates substantial market potential.
Major Players in the Composites Industry Ecosystem
- SGL Carbon
- COMPOSITES UNIVERSAL GROUP
- Solvay
- 3M
- DIT B V
- Owens Corning
- DuPont
- TORAY INDUSTRIES INC
- Mitsubishi Chemical Group Corporation
- Hexcel Corporation
- TEIJIN LIMITED
- Materion Corporation
Key Developments in Composites Industry Industry
- June 2023: Solvay collaborates with Spirit AeroSystems on composite development for sustainable aircraft technologies.
- February 2024: Owens Corning acquires Masonite for USD 3.9 billion, strengthening its position in building and construction materials.
Strategic Composites Industry Market Forecast
The composites industry is poised for continued growth, driven by technological advancements, expanding applications, and supportive government policies. The market is expected to witness significant expansion in various sectors, including automotive, aerospace, and renewable energy. The focus on sustainability and the development of innovative materials will further propel market expansion in the coming years.
Composites Industry Segmentation
-
1. Matrix Material
-
1.1. Polymer Matrix Composites (PMC)
- 1.1.1. Thermoset Resins
- 1.1.2. Thermoplastic Resins
- 1.2. Ceramic/Carbon Matrix Composites (CMCs)
- 1.3. Other Matrices (Metal Matrix Composites)
-
1.1. Polymer Matrix Composites (PMC)
-
2. Reinforcement Fiber
- 2.1. Glass Fiber
- 2.2. Carbon Fiber
- 2.3. Aramid Fiber
- 2.4. Other Fibers
-
3. End-use Application
- 3.1. Automotive and Transportation
- 3.2. Wind Energy
- 3.3. Aerospace and Defense
- 3.4. Pipes and Tanks
- 3.5. Construction
- 3.6. Electrical and Electronics
- 3.7. Sports and Recreation
- 3.8. Other End-use Applications
Composites Industry Segmentation By Geography
-
1. Asia Pacific
- 1.1. China
- 1.2. India
- 1.3. Japan
- 1.4. South Korea
- 1.5. Thailand
- 1.6. Malaysia
- 1.7. Indonesia
- 1.8. Vietnam
- 1.9. Rest of Asia Pacific
-
2. North America
- 2.1. United States
- 2.2. Canada
- 2.3. Mexico
-
3. Europe
- 3.1. Germany
- 3.2. United Kingdom
- 3.3. France
- 3.4. Italy
- 3.5. Spain
- 3.6. Russia
- 3.7. NORDIC Countries
- 3.8. Turkey
- 3.9. Rest of Europe
-
4. South America
- 4.1. Brazil
- 4.2. Argentina
- 4.3. Colombia
- 4.4. Rest of South America
-
5. Middle East and Africa
- 5.1. Saudi Arabia
- 5.2. South Africa
- 5.3. Nigeria
- 5.4. Qatar
- 5.5. Egypt
- 5.6. United Arab Emirates
- 5.7. Rest of Middle East and Africa
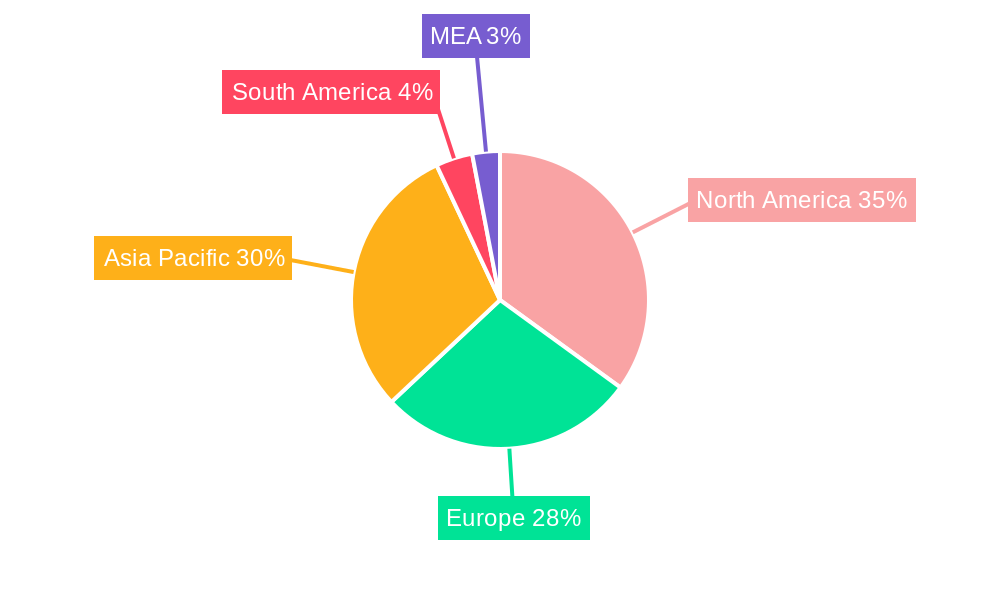
Composites Industry Regional Market Share
Geographic Coverage of Composites Industry
Composites Industry REPORT HIGHLIGHTS
| Aspects | Details |
|---|---|
| Study Period | 2020-2034 |
| Base Year | 2025 |
| Estimated Year | 2026 |
| Forecast Period | 2026-2034 |
| Historical Period | 2020-2025 |
| Growth Rate | CAGR of > 5.00% from 2020-2034 |
| Segmentation |
|
Table of Contents
- 1. Introduction
- 1.1. Research Scope
- 1.2. Market Segmentation
- 1.3. Research Objective
- 1.4. Definitions and Assumptions
- 2. Executive Summary
- 2.1. Market Snapshot
- 3. Market Dynamics
- 3.1. Market Drivers
- 3.2. Market Restrains
- 3.3. Market Trends
- 3.4. Market Opportunities
- 4. Market Factor Analysis
- 4.1. Porters Five Forces
- 4.1.1. Bargaining Power of Suppliers
- 4.1.2. Bargaining Power of Buyers
- 4.1.3. Threat of New Entrants
- 4.1.4. Threat of Substitutes
- 4.1.5. Competitive Rivalry
- 4.2. PESTEL analysis
- 4.3. BCG Analysis
- 4.3.1. Stars (High Growth, High Market Share)
- 4.3.2. Cash Cows (Low Growth, High Market Share)
- 4.3.3. Question Mark (High Growth, Low Market Share)
- 4.3.4. Dogs (Low Growth, Low Market Share)
- 4.4. Ansoff Matrix Analysis
- 4.5. Supply Chain Analysis
- 4.6. Regulatory Landscape
- 4.7. Current Market Potential and Opportunity Assessment (TAM–SAM–SOM Framework)
- 4.8. DMV Analyst Note
- 4.1. Porters Five Forces
- 5. Market Analysis, Insights and Forecast 2021-2033
- 5.1. Market Analysis, Insights and Forecast - by Matrix Material
- 5.1.1. Polymer Matrix Composites (PMC)
- 5.1.1.1. Thermoset Resins
- 5.1.1.2. Thermoplastic Resins
- 5.1.2. Ceramic/Carbon Matrix Composites (CMCs)
- 5.1.3. Other Matrices (Metal Matrix Composites)
- 5.1.1. Polymer Matrix Composites (PMC)
- 5.2. Market Analysis, Insights and Forecast - by Reinforcement Fiber
- 5.2.1. Glass Fiber
- 5.2.2. Carbon Fiber
- 5.2.3. Aramid Fiber
- 5.2.4. Other Fibers
- 5.3. Market Analysis, Insights and Forecast - by End-use Application
- 5.3.1. Automotive and Transportation
- 5.3.2. Wind Energy
- 5.3.3. Aerospace and Defense
- 5.3.4. Pipes and Tanks
- 5.3.5. Construction
- 5.3.6. Electrical and Electronics
- 5.3.7. Sports and Recreation
- 5.3.8. Other End-use Applications
- 5.4. Market Analysis, Insights and Forecast - by Region
- 5.4.1. Asia Pacific
- 5.4.2. North America
- 5.4.3. Europe
- 5.4.4. South America
- 5.4.5. Middle East and Africa
- 5.1. Market Analysis, Insights and Forecast - by Matrix Material
- 6. Global Composites Industry Analysis, Insights and Forecast, 2021-2033
- 6.1. Market Analysis, Insights and Forecast - by Matrix Material
- 6.1.1. Polymer Matrix Composites (PMC)
- 6.1.1.1. Thermoset Resins
- 6.1.1.2. Thermoplastic Resins
- 6.1.2. Ceramic/Carbon Matrix Composites (CMCs)
- 6.1.3. Other Matrices (Metal Matrix Composites)
- 6.1.1. Polymer Matrix Composites (PMC)
- 6.2. Market Analysis, Insights and Forecast - by Reinforcement Fiber
- 6.2.1. Glass Fiber
- 6.2.2. Carbon Fiber
- 6.2.3. Aramid Fiber
- 6.2.4. Other Fibers
- 6.3. Market Analysis, Insights and Forecast - by End-use Application
- 6.3.1. Automotive and Transportation
- 6.3.2. Wind Energy
- 6.3.3. Aerospace and Defense
- 6.3.4. Pipes and Tanks
- 6.3.5. Construction
- 6.3.6. Electrical and Electronics
- 6.3.7. Sports and Recreation
- 6.3.8. Other End-use Applications
- 6.1. Market Analysis, Insights and Forecast - by Matrix Material
- 7. Asia Pacific Composites Industry Analysis, Insights and Forecast, 2020-2032
- 7.1. Market Analysis, Insights and Forecast - by Matrix Material
- 7.1.1. Polymer Matrix Composites (PMC)
- 7.1.1.1. Thermoset Resins
- 7.1.1.2. Thermoplastic Resins
- 7.1.2. Ceramic/Carbon Matrix Composites (CMCs)
- 7.1.3. Other Matrices (Metal Matrix Composites)
- 7.1.1. Polymer Matrix Composites (PMC)
- 7.2. Market Analysis, Insights and Forecast - by Reinforcement Fiber
- 7.2.1. Glass Fiber
- 7.2.2. Carbon Fiber
- 7.2.3. Aramid Fiber
- 7.2.4. Other Fibers
- 7.3. Market Analysis, Insights and Forecast - by End-use Application
- 7.3.1. Automotive and Transportation
- 7.3.2. Wind Energy
- 7.3.3. Aerospace and Defense
- 7.3.4. Pipes and Tanks
- 7.3.5. Construction
- 7.3.6. Electrical and Electronics
- 7.3.7. Sports and Recreation
- 7.3.8. Other End-use Applications
- 7.1. Market Analysis, Insights and Forecast - by Matrix Material
- 8. North America Composites Industry Analysis, Insights and Forecast, 2020-2032
- 8.1. Market Analysis, Insights and Forecast - by Matrix Material
- 8.1.1. Polymer Matrix Composites (PMC)
- 8.1.1.1. Thermoset Resins
- 8.1.1.2. Thermoplastic Resins
- 8.1.2. Ceramic/Carbon Matrix Composites (CMCs)
- 8.1.3. Other Matrices (Metal Matrix Composites)
- 8.1.1. Polymer Matrix Composites (PMC)
- 8.2. Market Analysis, Insights and Forecast - by Reinforcement Fiber
- 8.2.1. Glass Fiber
- 8.2.2. Carbon Fiber
- 8.2.3. Aramid Fiber
- 8.2.4. Other Fibers
- 8.3. Market Analysis, Insights and Forecast - by End-use Application
- 8.3.1. Automotive and Transportation
- 8.3.2. Wind Energy
- 8.3.3. Aerospace and Defense
- 8.3.4. Pipes and Tanks
- 8.3.5. Construction
- 8.3.6. Electrical and Electronics
- 8.3.7. Sports and Recreation
- 8.3.8. Other End-use Applications
- 8.1. Market Analysis, Insights and Forecast - by Matrix Material
- 9. Europe Composites Industry Analysis, Insights and Forecast, 2020-2032
- 9.1. Market Analysis, Insights and Forecast - by Matrix Material
- 9.1.1. Polymer Matrix Composites (PMC)
- 9.1.1.1. Thermoset Resins
- 9.1.1.2. Thermoplastic Resins
- 9.1.2. Ceramic/Carbon Matrix Composites (CMCs)
- 9.1.3. Other Matrices (Metal Matrix Composites)
- 9.1.1. Polymer Matrix Composites (PMC)
- 9.2. Market Analysis, Insights and Forecast - by Reinforcement Fiber
- 9.2.1. Glass Fiber
- 9.2.2. Carbon Fiber
- 9.2.3. Aramid Fiber
- 9.2.4. Other Fibers
- 9.3. Market Analysis, Insights and Forecast - by End-use Application
- 9.3.1. Automotive and Transportation
- 9.3.2. Wind Energy
- 9.3.3. Aerospace and Defense
- 9.3.4. Pipes and Tanks
- 9.3.5. Construction
- 9.3.6. Electrical and Electronics
- 9.3.7. Sports and Recreation
- 9.3.8. Other End-use Applications
- 9.1. Market Analysis, Insights and Forecast - by Matrix Material
- 10. South America Composites Industry Analysis, Insights and Forecast, 2020-2032
- 10.1. Market Analysis, Insights and Forecast - by Matrix Material
- 10.1.1. Polymer Matrix Composites (PMC)
- 10.1.1.1. Thermoset Resins
- 10.1.1.2. Thermoplastic Resins
- 10.1.2. Ceramic/Carbon Matrix Composites (CMCs)
- 10.1.3. Other Matrices (Metal Matrix Composites)
- 10.1.1. Polymer Matrix Composites (PMC)
- 10.2. Market Analysis, Insights and Forecast - by Reinforcement Fiber
- 10.2.1. Glass Fiber
- 10.2.2. Carbon Fiber
- 10.2.3. Aramid Fiber
- 10.2.4. Other Fibers
- 10.3. Market Analysis, Insights and Forecast - by End-use Application
- 10.3.1. Automotive and Transportation
- 10.3.2. Wind Energy
- 10.3.3. Aerospace and Defense
- 10.3.4. Pipes and Tanks
- 10.3.5. Construction
- 10.3.6. Electrical and Electronics
- 10.3.7. Sports and Recreation
- 10.3.8. Other End-use Applications
- 10.1. Market Analysis, Insights and Forecast - by Matrix Material
- 11. Middle East and Africa Composites Industry Analysis, Insights and Forecast, 2020-2032
- 11.1. Market Analysis, Insights and Forecast - by Matrix Material
- 11.1.1. Polymer Matrix Composites (PMC)
- 11.1.1.1. Thermoset Resins
- 11.1.1.2. Thermoplastic Resins
- 11.1.2. Ceramic/Carbon Matrix Composites (CMCs)
- 11.1.3. Other Matrices (Metal Matrix Composites)
- 11.1.1. Polymer Matrix Composites (PMC)
- 11.2. Market Analysis, Insights and Forecast - by Reinforcement Fiber
- 11.2.1. Glass Fiber
- 11.2.2. Carbon Fiber
- 11.2.3. Aramid Fiber
- 11.2.4. Other Fibers
- 11.3. Market Analysis, Insights and Forecast - by End-use Application
- 11.3.1. Automotive and Transportation
- 11.3.2. Wind Energy
- 11.3.3. Aerospace and Defense
- 11.3.4. Pipes and Tanks
- 11.3.5. Construction
- 11.3.6. Electrical and Electronics
- 11.3.7. Sports and Recreation
- 11.3.8. Other End-use Applications
- 11.1. Market Analysis, Insights and Forecast - by Matrix Material
- 12. Competitive Analysis
- 12.1. Company Profiles
- 12.1.1 SGL Carbon
- 12.1.1.1. Company Overview
- 12.1.1.2. Products
- 12.1.1.3. Company Financials
- 12.1.1.4. SWOT Analysis
- 12.1.2 COMPOSITES UNIVERSAL GROUP
- 12.1.2.1. Company Overview
- 12.1.2.2. Products
- 12.1.2.3. Company Financials
- 12.1.2.4. SWOT Analysis
- 12.1.3 Solvay
- 12.1.3.1. Company Overview
- 12.1.3.2. Products
- 12.1.3.3. Company Financials
- 12.1.3.4. SWOT Analysis
- 12.1.4 3M
- 12.1.4.1. Company Overview
- 12.1.4.2. Products
- 12.1.4.3. Company Financials
- 12.1.4.4. SWOT Analysis
- 12.1.5 DIT B V
- 12.1.5.1. Company Overview
- 12.1.5.2. Products
- 12.1.5.3. Company Financials
- 12.1.5.4. SWOT Analysis
- 12.1.6 Owens Corning
- 12.1.6.1. Company Overview
- 12.1.6.2. Products
- 12.1.6.3. Company Financials
- 12.1.6.4. SWOT Analysis
- 12.1.7 DuPont
- 12.1.7.1. Company Overview
- 12.1.7.2. Products
- 12.1.7.3. Company Financials
- 12.1.7.4. SWOT Analysis
- 12.1.8 TORAY INDUSTRIES INC *List Not Exhaustive
- 12.1.8.1. Company Overview
- 12.1.8.2. Products
- 12.1.8.3. Company Financials
- 12.1.8.4. SWOT Analysis
- 12.1.9 Mitsubishi Chemical Group Corporation
- 12.1.9.1. Company Overview
- 12.1.9.2. Products
- 12.1.9.3. Company Financials
- 12.1.9.4. SWOT Analysis
- 12.1.10 Hexcel Corporation
- 12.1.10.1. Company Overview
- 12.1.10.2. Products
- 12.1.10.3. Company Financials
- 12.1.10.4. SWOT Analysis
- 12.1.11 TEIJIN LIMITED
- 12.1.11.1. Company Overview
- 12.1.11.2. Products
- 12.1.11.3. Company Financials
- 12.1.11.4. SWOT Analysis
- 12.1.12 Materion Corporation
- 12.1.12.1. Company Overview
- 12.1.12.2. Products
- 12.1.12.3. Company Financials
- 12.1.12.4. SWOT Analysis
- 12.1.1 SGL Carbon
- 12.2. Market Entropy
- 12.2.1 Company's Key Areas Served
- 12.2.2 Recent Developments
- 12.3. Company Market Share Analysis 2025
- 12.3.1 Top 5 Companies Market Share Analysis
- 12.3.2 Top 3 Companies Market Share Analysis
- 12.4. List of Potential Customers
- 13. Research Methodology
List of Figures
- Figure 1: Global Composites Industry Revenue Breakdown (Million, %) by Region 2025 & 2033
- Figure 2: Asia Pacific Composites Industry Revenue (Million), by Matrix Material 2025 & 2033
- Figure 3: Asia Pacific Composites Industry Revenue Share (%), by Matrix Material 2025 & 2033
- Figure 4: Asia Pacific Composites Industry Revenue (Million), by Reinforcement Fiber 2025 & 2033
- Figure 5: Asia Pacific Composites Industry Revenue Share (%), by Reinforcement Fiber 2025 & 2033
- Figure 6: Asia Pacific Composites Industry Revenue (Million), by End-use Application 2025 & 2033
- Figure 7: Asia Pacific Composites Industry Revenue Share (%), by End-use Application 2025 & 2033
- Figure 8: Asia Pacific Composites Industry Revenue (Million), by Country 2025 & 2033
- Figure 9: Asia Pacific Composites Industry Revenue Share (%), by Country 2025 & 2033
- Figure 10: North America Composites Industry Revenue (Million), by Matrix Material 2025 & 2033
- Figure 11: North America Composites Industry Revenue Share (%), by Matrix Material 2025 & 2033
- Figure 12: North America Composites Industry Revenue (Million), by Reinforcement Fiber 2025 & 2033
- Figure 13: North America Composites Industry Revenue Share (%), by Reinforcement Fiber 2025 & 2033
- Figure 14: North America Composites Industry Revenue (Million), by End-use Application 2025 & 2033
- Figure 15: North America Composites Industry Revenue Share (%), by End-use Application 2025 & 2033
- Figure 16: North America Composites Industry Revenue (Million), by Country 2025 & 2033
- Figure 17: North America Composites Industry Revenue Share (%), by Country 2025 & 2033
- Figure 18: Europe Composites Industry Revenue (Million), by Matrix Material 2025 & 2033
- Figure 19: Europe Composites Industry Revenue Share (%), by Matrix Material 2025 & 2033
- Figure 20: Europe Composites Industry Revenue (Million), by Reinforcement Fiber 2025 & 2033
- Figure 21: Europe Composites Industry Revenue Share (%), by Reinforcement Fiber 2025 & 2033
- Figure 22: Europe Composites Industry Revenue (Million), by End-use Application 2025 & 2033
- Figure 23: Europe Composites Industry Revenue Share (%), by End-use Application 2025 & 2033
- Figure 24: Europe Composites Industry Revenue (Million), by Country 2025 & 2033
- Figure 25: Europe Composites Industry Revenue Share (%), by Country 2025 & 2033
- Figure 26: South America Composites Industry Revenue (Million), by Matrix Material 2025 & 2033
- Figure 27: South America Composites Industry Revenue Share (%), by Matrix Material 2025 & 2033
- Figure 28: South America Composites Industry Revenue (Million), by Reinforcement Fiber 2025 & 2033
- Figure 29: South America Composites Industry Revenue Share (%), by Reinforcement Fiber 2025 & 2033
- Figure 30: South America Composites Industry Revenue (Million), by End-use Application 2025 & 2033
- Figure 31: South America Composites Industry Revenue Share (%), by End-use Application 2025 & 2033
- Figure 32: South America Composites Industry Revenue (Million), by Country 2025 & 2033
- Figure 33: South America Composites Industry Revenue Share (%), by Country 2025 & 2033
- Figure 34: Middle East and Africa Composites Industry Revenue (Million), by Matrix Material 2025 & 2033
- Figure 35: Middle East and Africa Composites Industry Revenue Share (%), by Matrix Material 2025 & 2033
- Figure 36: Middle East and Africa Composites Industry Revenue (Million), by Reinforcement Fiber 2025 & 2033
- Figure 37: Middle East and Africa Composites Industry Revenue Share (%), by Reinforcement Fiber 2025 & 2033
- Figure 38: Middle East and Africa Composites Industry Revenue (Million), by End-use Application 2025 & 2033
- Figure 39: Middle East and Africa Composites Industry Revenue Share (%), by End-use Application 2025 & 2033
- Figure 40: Middle East and Africa Composites Industry Revenue (Million), by Country 2025 & 2033
- Figure 41: Middle East and Africa Composites Industry Revenue Share (%), by Country 2025 & 2033
List of Tables
- Table 1: Global Composites Industry Revenue Million Forecast, by Matrix Material 2020 & 2033
- Table 2: Global Composites Industry Revenue Million Forecast, by Reinforcement Fiber 2020 & 2033
- Table 3: Global Composites Industry Revenue Million Forecast, by End-use Application 2020 & 2033
- Table 4: Global Composites Industry Revenue Million Forecast, by Region 2020 & 2033
- Table 5: Global Composites Industry Revenue Million Forecast, by Matrix Material 2020 & 2033
- Table 6: Global Composites Industry Revenue Million Forecast, by Reinforcement Fiber 2020 & 2033
- Table 7: Global Composites Industry Revenue Million Forecast, by End-use Application 2020 & 2033
- Table 8: Global Composites Industry Revenue Million Forecast, by Country 2020 & 2033
- Table 9: China Composites Industry Revenue (Million) Forecast, by Application 2020 & 2033
- Table 10: India Composites Industry Revenue (Million) Forecast, by Application 2020 & 2033
- Table 11: Japan Composites Industry Revenue (Million) Forecast, by Application 2020 & 2033
- Table 12: South Korea Composites Industry Revenue (Million) Forecast, by Application 2020 & 2033
- Table 13: Thailand Composites Industry Revenue (Million) Forecast, by Application 2020 & 2033
- Table 14: Malaysia Composites Industry Revenue (Million) Forecast, by Application 2020 & 2033
- Table 15: Indonesia Composites Industry Revenue (Million) Forecast, by Application 2020 & 2033
- Table 16: Vietnam Composites Industry Revenue (Million) Forecast, by Application 2020 & 2033
- Table 17: Rest of Asia Pacific Composites Industry Revenue (Million) Forecast, by Application 2020 & 2033
- Table 18: Global Composites Industry Revenue Million Forecast, by Matrix Material 2020 & 2033
- Table 19: Global Composites Industry Revenue Million Forecast, by Reinforcement Fiber 2020 & 2033
- Table 20: Global Composites Industry Revenue Million Forecast, by End-use Application 2020 & 2033
- Table 21: Global Composites Industry Revenue Million Forecast, by Country 2020 & 2033
- Table 22: United States Composites Industry Revenue (Million) Forecast, by Application 2020 & 2033
- Table 23: Canada Composites Industry Revenue (Million) Forecast, by Application 2020 & 2033
- Table 24: Mexico Composites Industry Revenue (Million) Forecast, by Application 2020 & 2033
- Table 25: Global Composites Industry Revenue Million Forecast, by Matrix Material 2020 & 2033
- Table 26: Global Composites Industry Revenue Million Forecast, by Reinforcement Fiber 2020 & 2033
- Table 27: Global Composites Industry Revenue Million Forecast, by End-use Application 2020 & 2033
- Table 28: Global Composites Industry Revenue Million Forecast, by Country 2020 & 2033
- Table 29: Germany Composites Industry Revenue (Million) Forecast, by Application 2020 & 2033
- Table 30: United Kingdom Composites Industry Revenue (Million) Forecast, by Application 2020 & 2033
- Table 31: France Composites Industry Revenue (Million) Forecast, by Application 2020 & 2033
- Table 32: Italy Composites Industry Revenue (Million) Forecast, by Application 2020 & 2033
- Table 33: Spain Composites Industry Revenue (Million) Forecast, by Application 2020 & 2033
- Table 34: Russia Composites Industry Revenue (Million) Forecast, by Application 2020 & 2033
- Table 35: NORDIC Countries Composites Industry Revenue (Million) Forecast, by Application 2020 & 2033
- Table 36: Turkey Composites Industry Revenue (Million) Forecast, by Application 2020 & 2033
- Table 37: Rest of Europe Composites Industry Revenue (Million) Forecast, by Application 2020 & 2033
- Table 38: Global Composites Industry Revenue Million Forecast, by Matrix Material 2020 & 2033
- Table 39: Global Composites Industry Revenue Million Forecast, by Reinforcement Fiber 2020 & 2033
- Table 40: Global Composites Industry Revenue Million Forecast, by End-use Application 2020 & 2033
- Table 41: Global Composites Industry Revenue Million Forecast, by Country 2020 & 2033
- Table 42: Brazil Composites Industry Revenue (Million) Forecast, by Application 2020 & 2033
- Table 43: Argentina Composites Industry Revenue (Million) Forecast, by Application 2020 & 2033
- Table 44: Colombia Composites Industry Revenue (Million) Forecast, by Application 2020 & 2033
- Table 45: Rest of South America Composites Industry Revenue (Million) Forecast, by Application 2020 & 2033
- Table 46: Global Composites Industry Revenue Million Forecast, by Matrix Material 2020 & 2033
- Table 47: Global Composites Industry Revenue Million Forecast, by Reinforcement Fiber 2020 & 2033
- Table 48: Global Composites Industry Revenue Million Forecast, by End-use Application 2020 & 2033
- Table 49: Global Composites Industry Revenue Million Forecast, by Country 2020 & 2033
- Table 50: Saudi Arabia Composites Industry Revenue (Million) Forecast, by Application 2020 & 2033
- Table 51: South Africa Composites Industry Revenue (Million) Forecast, by Application 2020 & 2033
- Table 52: Nigeria Composites Industry Revenue (Million) Forecast, by Application 2020 & 2033
- Table 53: Qatar Composites Industry Revenue (Million) Forecast, by Application 2020 & 2033
- Table 54: Egypt Composites Industry Revenue (Million) Forecast, by Application 2020 & 2033
- Table 55: United Arab Emirates Composites Industry Revenue (Million) Forecast, by Application 2020 & 2033
- Table 56: Rest of Middle East and Africa Composites Industry Revenue (Million) Forecast, by Application 2020 & 2033
Frequently Asked Questions
1. What is the projected Compound Annual Growth Rate (CAGR) of the Composites Industry?
The projected CAGR is approximately > 5.00%.
2. Which companies are prominent players in the Composites Industry?
Key companies in the market include SGL Carbon, COMPOSITES UNIVERSAL GROUP, Solvay, 3M, DIT B V, Owens Corning, DuPont, TORAY INDUSTRIES INC *List Not Exhaustive, Mitsubishi Chemical Group Corporation, Hexcel Corporation, TEIJIN LIMITED, Materion Corporation.
3. What are the main segments of the Composites Industry?
The market segments include Matrix Material, Reinforcement Fiber, End-use Application.
4. Can you provide details about the market size?
The market size is estimated to be USD 45.96 Million as of 2022.
5. What are some drivers contributing to market growth?
Technological Advancement in the Field of Material Science; Increasing Use of Composites in the Aerospace and Defense Industry; Other Drivers.
6. What are the notable trends driving market growth?
Rising Demand from Transportation sector.
7. Are there any restraints impacting market growth?
High Cost of Composite Materials.
8. Can you provide examples of recent developments in the market?
February 2024 - Owens Corning acquired USD 3.9 billion of Masonite. This acquisition would strengthen the company's position in building and construction materials and the glass reinforcement business within its Composites segment.
9. What pricing options are available for accessing the report?
Pricing options include single-user, multi-user, and enterprise licenses priced at USD 4750, USD 5250, and USD 8750 respectively.
10. Is the market size provided in terms of value or volume?
The market size is provided in terms of value, measured in Million.
11. Are there any specific market keywords associated with the report?
Yes, the market keyword associated with the report is "Composites Industry," which aids in identifying and referencing the specific market segment covered.
12. How do I determine which pricing option suits my needs best?
The pricing options vary based on user requirements and access needs. Individual users may opt for single-user licenses, while businesses requiring broader access may choose multi-user or enterprise licenses for cost-effective access to the report.
13. Are there any additional resources or data provided in the Composites Industry report?
While the report offers comprehensive insights, it's advisable to review the specific contents or supplementary materials provided to ascertain if additional resources or data are available.
14. How can I stay updated on further developments or reports in the Composites Industry?
To stay informed about further developments, trends, and reports in the Composites Industry, consider subscribing to industry newsletters, following relevant companies and organizations, or regularly checking reputable industry news sources and publications.
Methodology
Step 1 - Identification of Relevant Samples Size from Population Database


Step 2 - Approaches for Defining Global Market Size (Value, Volume* & Price*)

Note*: In applicable scenarios
Step 3 - Data Sources
Primary Research
- Web Analytics
- Survey Reports
- Research Institute
- Latest Research Reports
- Opinion Leaders
Secondary Research
- Annual Reports
- White Paper
- Latest Press Release
- Industry Association
- Paid Database
- Investor Presentations

Step 4 - Data Triangulation
Involves using different sources of information in order to increase the validity of a study
These sources are likely to be stakeholders in a program - participants, other researchers, program staff, other community members, and so on.
Then we put all data in single framework & apply various statistical tools to find out the dynamic on the market.
During the analysis stage, feedback from the stakeholder groups would be compared to determine areas of agreement as well as areas of divergence