

Key Insights
The Ceramic Matrix Composites (CMC) market is experiencing robust growth, driven by increasing demand across diverse sectors. A CAGR exceeding 10% from 2019 to 2024 indicates a significant upward trajectory, projected to continue throughout the forecast period (2025-2033). Key drivers include the superior high-temperature strength, lightweight nature, and corrosion resistance of CMCs, making them ideal for applications demanding extreme operational conditions. The aerospace industry, particularly in the development of advanced aircraft engines and space exploration vehicles, is a major growth catalyst. The automotive industry's pursuit of lightweight and fuel-efficient vehicles is also fueling demand for CMC components. Furthermore, the expanding energy and power sectors, specifically in high-temperature applications like gas turbines and nuclear reactors, are contributing to market expansion. Segmentation reveals that C/C and C/SiC Ceramic Matrix Composites currently dominate the product type segment, due to their established applications and manufacturing capabilities. Geographically, the Asia Pacific region, particularly China, is anticipated to witness substantial growth due to significant investments in infrastructure and manufacturing capacity. While competition is strong amongst established players like Rolls-Royce, General Electric, and Kyocera, the market also presents opportunities for smaller, specialized manufacturers focused on niche applications. Restraints include the relatively high cost of manufacturing CMCs and the complexity of processing these advanced materials. However, ongoing research and development efforts aimed at improving manufacturing techniques and broadening applications are mitigating these challenges.
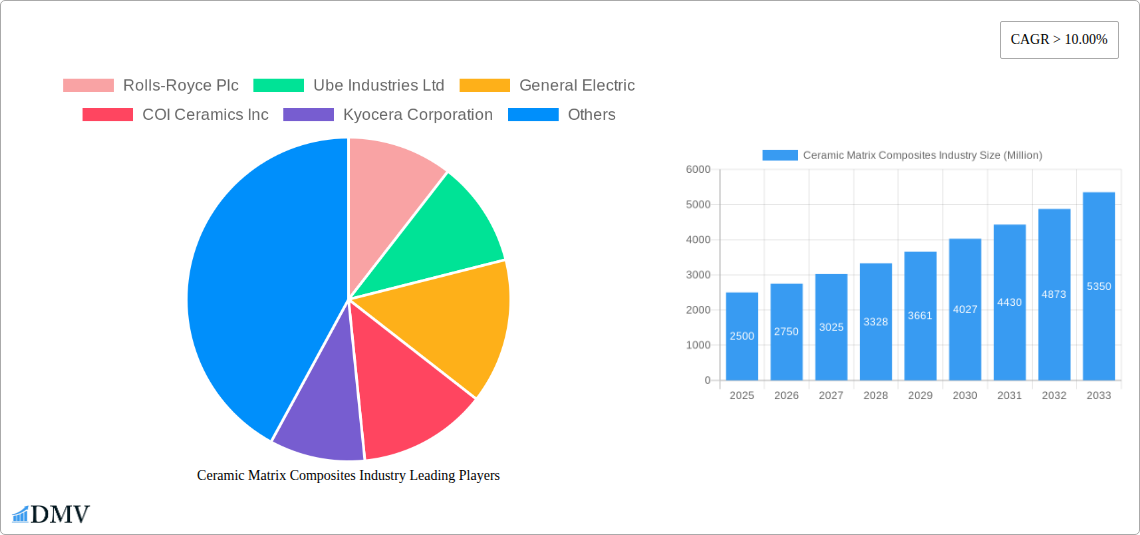
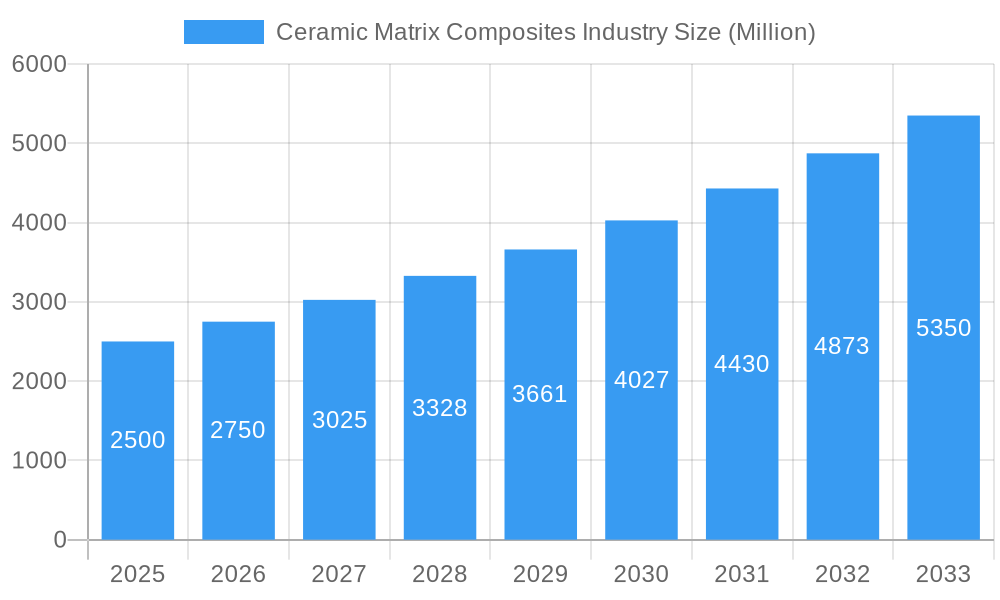
Ceramic Matrix Composites Industry Market Size (In Billion)
The forecast for the CMC market paints a picture of continued expansion, with substantial opportunities for market players who can innovate in material science and manufacturing processes. Strategic partnerships and collaborations between material suppliers and end-use industries are expected to be key to accelerating market penetration and driving further growth. The market's future success hinges on addressing the challenges related to cost-effectiveness and scaling up production to meet the burgeoning demand across various sectors. The ongoing development of novel CMC materials with improved properties and the exploration of new applications will further fuel the market's expansion, creating a promising outlook for the foreseeable future.
Ceramic Matrix Composites Industry Company Market Share
Ceramic Matrix Composites (CMC) Industry Market Report: 2019-2033
This comprehensive report provides a detailed analysis of the Ceramic Matrix Composites (CMC) industry, offering invaluable insights for stakeholders seeking to navigate this rapidly evolving market. The study covers the period from 2019 to 2033, with a focus on the 2025-2033 forecast period and a base year of 2025. The report delves into market trends, technological advancements, and competitive dynamics, providing critical information for strategic decision-making. The total market value is expected to reach xx Million by 2033.
Ceramic Matrix Composites Industry Market Composition & Trends
This section evaluates the concentration of the Ceramic Matrix Composites market, dissecting innovation drivers, regulatory landscapes, substitute product analysis, end-user profiles and merger & acquisition (M&A) activities. The market is characterized by a moderately concentrated landscape with key players such as Rolls-Royce Plc, General Electric, and 3M holding significant market share. However, the emergence of innovative smaller companies is leading to increased competition.
- Market Share Distribution: Rolls-Royce Plc holds an estimated xx% market share in 2025, followed by General Electric at xx% and 3M at xx%. The remaining market share is distributed among numerous other players, indicating a fragmented competitive landscape beyond the top three.
- M&A Activity: The CMC industry has witnessed significant M&A activity in recent years, with deal values exceeding xx Million in the period from 2019 to 2024. These transactions primarily focused on expanding product portfolios and accessing new technologies. Further consolidation is anticipated in the coming years.
- Innovation Catalysts: Ongoing research and development efforts focused on improving CMC performance in extreme environments, particularly in aerospace and defense, are driving significant innovation.
- Regulatory Landscape: Stringent environmental regulations and safety standards, particularly in aerospace and automotive applications, are shaping the development and adoption of CMCs.
- Substitute Products: While CMCs possess unique properties, they face competition from alternative materials like advanced polymers and metal alloys depending on specific application needs.
- End-User Profiles: Key end-user industries include aerospace, automotive, defense, energy & power, and electrical & electronics, with aerospace currently dominating the market.
Ceramic Matrix Composites Industry Industry Evolution
This section examines the evolution of the Ceramic Matrix Composites industry, tracing market growth trajectories, technological advancements, and shifting consumer demands. The industry has shown consistent growth during the historical period (2019-2024), with a Compound Annual Growth Rate (CAGR) of xx%. This growth is projected to continue during the forecast period (2025-2033), driven by increasing demand for lightweight, high-strength materials across various applications. Technological advancements, such as the development of novel manufacturing techniques and improved CMC formulations, are key factors contributing to this growth. Furthermore, the increasing adoption of CMCs in high-temperature applications, driven by the need for improved efficiency and durability, is also a significant growth driver. Specific adoption rates vary across end-user industries, with the aerospace sector demonstrating the highest level of adoption.
Leading Regions, Countries, or Segments in Ceramic Matrix Composites Industry
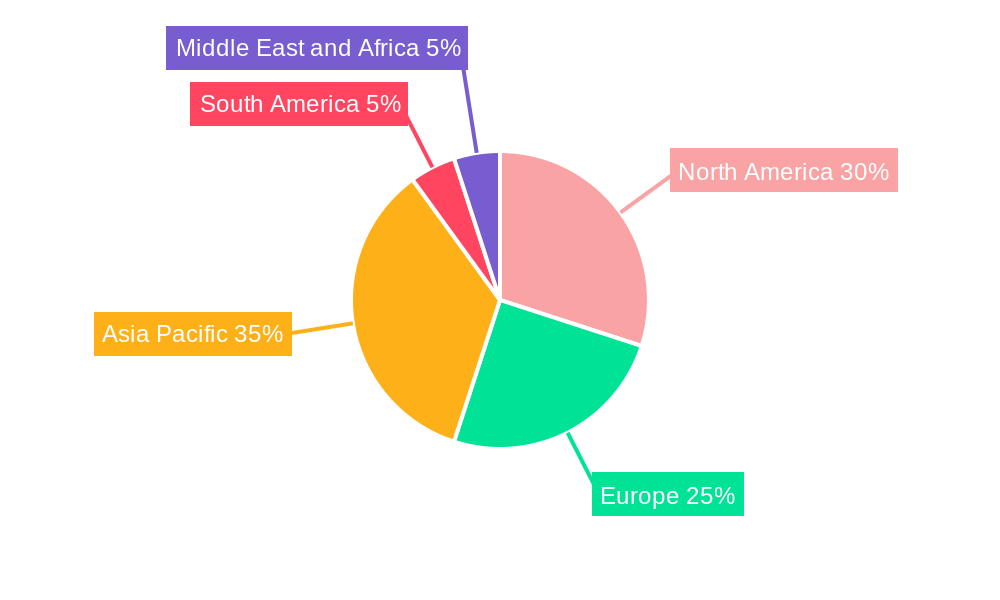
The aerospace sector, especially within the North American and European regions, currently dominates the Ceramic Matrix Composites market. This dominance is attributed to several key factors:
Key Drivers:
- High Investment in R&D: Significant government and private investment in aerospace R&D drives innovation and adoption of advanced materials like CMCs.
- Stringent Safety Regulations: Strict aerospace safety regulations necessitate the use of high-performance materials like CMCs.
- Demand for Lightweight Components: The need to reduce aircraft weight to improve fuel efficiency fuels the demand for lightweight CMC components.
Dominance Factors: North America and Europe's established aerospace industries, strong technological capabilities, and substantial government funding contribute to their leading market positions. The aerospace segment's preference for C/SIC and SIC/SIC Ceramic Matrix Composites further contributes to their significant market share within the Product Type segment. In terms of end-user industries, aerospace currently holds the largest share, followed by defense, automotive, and energy and power. The automotive segment is experiencing significant growth potential with increasing adoption of CMCs in turbochargers and heat shields.
Ceramic Matrix Composites Industry Product Innovations
Recent innovations in Ceramic Matrix Composites focus on enhancing material properties, expanding application possibilities, and improving manufacturing processes. This includes advancements in fiber technology, matrix development, and processing methods, leading to increased strength, toughness, and durability. These innovations result in lighter, more efficient components with extended operational lifetimes across diverse end-user sectors. For instance, the development of CMCs with improved oxidation resistance and creep strength has expanded their applicability in high-temperature environments. Unique selling propositions emphasize cost reduction, performance improvements, and application expansion to cater to evolving market demands.
Propelling Factors for Ceramic Matrix Composites Industry Growth
Several factors are propelling the growth of the Ceramic Matrix Composites industry. These include advancements in manufacturing technologies that reduce production costs, increasing demand for high-performance materials in aerospace and defense, and government initiatives promoting the adoption of lightweight materials. Furthermore, the growing need for energy-efficient solutions is driving the demand for CMCs in energy and power applications. The rising focus on sustainability also plays a significant role.
Obstacles in the Ceramic Matrix Composites Industry Market
The Ceramic Matrix Composites industry faces several challenges, including high production costs compared to alternative materials and the complexity of CMC manufacturing processes. Supply chain vulnerabilities, especially concerning raw materials, also pose a significant risk. Furthermore, intense competition from established materials and emerging technologies creates hurdles for market expansion. The variability in product performance due to manufacturing inconsistencies presents a challenge for wider adoption.
Future Opportunities in Ceramic Matrix Composites Industry
Future opportunities lie in the development of novel CMC formulations for specific applications, such as improved oxidation resistance and creep behavior in extreme environments. Expansion into emerging markets, particularly in the renewable energy and automotive sectors, presents substantial growth potential. Furthermore, exploration of cost-effective manufacturing processes to enhance the affordability of CMCs will significantly drive market expansion. The development of customized CMCs tailored for specific end-user needs presents further opportunities.
Major Players in the Ceramic Matrix Composites Industry Ecosystem
- Rolls-Royce Plc
- Ube Industries Ltd
- General Electric
- COI Ceramics Inc
- Kyocera Corporation
- 3M
- Ultramet Inc
- SGL Carbon Company
- CoorsTek Inc
- Lancer Systems LP
- Starfire Systems Inc
- CeramTec
- Applied Thin Films Inc
Key Developments in Ceramic Matrix Composites Industry Industry
- 2022 Q4: Rolls-Royce Plc announced a significant investment in CMC research and development, focusing on next-generation aerospace applications.
- 2023 Q1: General Electric launched a new line of CMC components for gas turbine engines, enhancing efficiency and durability.
- 2023 Q2: A major merger between two smaller CMC manufacturers resulted in a significant increase in production capacity. (Further details needed on the specific merger)
Strategic Ceramic Matrix Composites Industry Market Forecast
The Ceramic Matrix Composites market is poised for significant growth, driven by advancements in material science, cost-effective manufacturing techniques, and increasing demand across various industries. The focus on lightweighting, high-temperature applications, and sustainable solutions will drive continued market expansion in the forecast period. Emerging technologies and applications in renewable energy and electric vehicles are further catalysts for this growth. The market is expected to witness further consolidation through mergers and acquisitions as companies seek to enhance their market share and technological capabilities.
Ceramic Matrix Composites Industry Segmentation
-
1. Product Type
- 1.1. C/C Ceramic Matrix Composites
- 1.2. C/SIC Ceramic Matrix Composites
- 1.3. Oxide/Oxide Ceramic Matrix Composites
- 1.4. SIC/SIC Ceramic Matrix Composites
-
2. End-user Industry
- 2.1. Automotive
- 2.2. Aerospace
- 2.3. Defense
- 2.4. Energy and Power
- 2.5. Electrical and Electronics
- 2.6. Other End-user Industries
Ceramic Matrix Composites Industry Segmentation By Geography
-
1. Asia Pacific
- 1.1. China
- 1.2. India
- 1.3. Japan
- 1.4. South Korea
- 1.5. Malaysia
- 1.6. Thailand
- 1.7. Indonesia
- 1.8. Vietnam
- 1.9. Rest of Asia Pacific
-
2. North America
- 2.1. United States
- 2.2. Canada
- 2.3. Mexico
-
3. Europe
- 3.1. Germany
- 3.2. United Kingdom
- 3.3. France
- 3.4. Italy
- 3.5. Spain
- 3.6. Turkey
- 3.7. Russia
- 3.8. Nordic Countries
- 3.9. Rest of Europe
-
4. South America
- 4.1. Brazil
- 4.2. Argentina
- 4.3. Colombia
- 4.4. Rest of South America
-
5. Middle East and Africa
- 5.1. Saudi Arabia
- 5.2. Nigeria
- 5.3. Qatar
- 5.4. Egypt
- 5.5. United Arab Emirates
- 5.6. South Africa
- 5.7. Rest of Middle East and Africa
Ceramic Matrix Composites Industry Regional Market Share
Geographic Coverage of Ceramic Matrix Composites Industry
Ceramic Matrix Composites Industry REPORT HIGHLIGHTS
| Aspects | Details |
|---|---|
| Study Period | 2020-2034 |
| Base Year | 2025 |
| Estimated Year | 2026 |
| Forecast Period | 2026-2034 |
| Historical Period | 2020-2025 |
| Growth Rate | CAGR of > 10.00% from 2020-2034 |
| Segmentation |
|
Table of Contents
- 1. Introduction
- 1.1. Research Scope
- 1.2. Market Segmentation
- 1.3. Research Objective
- 1.4. Definitions and Assumptions
- 2. Executive Summary
- 2.1. Market Snapshot
- 3. Market Dynamics
- 3.1. Market Drivers
- 3.2. Market Restrains
- 3.3. Market Trends
- 3.4. Market Opportunities
- 4. Market Factor Analysis
- 4.1. Porters Five Forces
- 4.1.1. Bargaining Power of Suppliers
- 4.1.2. Bargaining Power of Buyers
- 4.1.3. Threat of New Entrants
- 4.1.4. Threat of Substitutes
- 4.1.5. Competitive Rivalry
- 4.2. PESTEL analysis
- 4.3. BCG Analysis
- 4.3.1. Stars (High Growth, High Market Share)
- 4.3.2. Cash Cows (Low Growth, High Market Share)
- 4.3.3. Question Mark (High Growth, Low Market Share)
- 4.3.4. Dogs (Low Growth, Low Market Share)
- 4.4. Ansoff Matrix Analysis
- 4.5. Supply Chain Analysis
- 4.6. Regulatory Landscape
- 4.7. Current Market Potential and Opportunity Assessment (TAM–SAM–SOM Framework)
- 4.8. DMV Analyst Note
- 4.1. Porters Five Forces
- 5. Market Analysis, Insights and Forecast 2021-2033
- 5.1. Market Analysis, Insights and Forecast - by Product Type
- 5.1.1. C/C Ceramic Matrix Composites
- 5.1.2. C/SIC Ceramic Matrix Composites
- 5.1.3. Oxide/Oxide Ceramic Matrix Composites
- 5.1.4. SIC/SIC Ceramic Matrix Composites
- 5.2. Market Analysis, Insights and Forecast - by End-user Industry
- 5.2.1. Automotive
- 5.2.2. Aerospace
- 5.2.3. Defense
- 5.2.4. Energy and Power
- 5.2.5. Electrical and Electronics
- 5.2.6. Other End-user Industries
- 5.3. Market Analysis, Insights and Forecast - by Region
- 5.3.1. Asia Pacific
- 5.3.2. North America
- 5.3.3. Europe
- 5.3.4. South America
- 5.3.5. Middle East and Africa
- 5.1. Market Analysis, Insights and Forecast - by Product Type
- 6. Global Ceramic Matrix Composites Industry Analysis, Insights and Forecast, 2021-2033
- 6.1. Market Analysis, Insights and Forecast - by Product Type
- 6.1.1. C/C Ceramic Matrix Composites
- 6.1.2. C/SIC Ceramic Matrix Composites
- 6.1.3. Oxide/Oxide Ceramic Matrix Composites
- 6.1.4. SIC/SIC Ceramic Matrix Composites
- 6.2. Market Analysis, Insights and Forecast - by End-user Industry
- 6.2.1. Automotive
- 6.2.2. Aerospace
- 6.2.3. Defense
- 6.2.4. Energy and Power
- 6.2.5. Electrical and Electronics
- 6.2.6. Other End-user Industries
- 6.1. Market Analysis, Insights and Forecast - by Product Type
- 7. Asia Pacific Ceramic Matrix Composites Industry Analysis, Insights and Forecast, 2020-2032
- 7.1. Market Analysis, Insights and Forecast - by Product Type
- 7.1.1. C/C Ceramic Matrix Composites
- 7.1.2. C/SIC Ceramic Matrix Composites
- 7.1.3. Oxide/Oxide Ceramic Matrix Composites
- 7.1.4. SIC/SIC Ceramic Matrix Composites
- 7.2. Market Analysis, Insights and Forecast - by End-user Industry
- 7.2.1. Automotive
- 7.2.2. Aerospace
- 7.2.3. Defense
- 7.2.4. Energy and Power
- 7.2.5. Electrical and Electronics
- 7.2.6. Other End-user Industries
- 7.1. Market Analysis, Insights and Forecast - by Product Type
- 8. North America Ceramic Matrix Composites Industry Analysis, Insights and Forecast, 2020-2032
- 8.1. Market Analysis, Insights and Forecast - by Product Type
- 8.1.1. C/C Ceramic Matrix Composites
- 8.1.2. C/SIC Ceramic Matrix Composites
- 8.1.3. Oxide/Oxide Ceramic Matrix Composites
- 8.1.4. SIC/SIC Ceramic Matrix Composites
- 8.2. Market Analysis, Insights and Forecast - by End-user Industry
- 8.2.1. Automotive
- 8.2.2. Aerospace
- 8.2.3. Defense
- 8.2.4. Energy and Power
- 8.2.5. Electrical and Electronics
- 8.2.6. Other End-user Industries
- 8.1. Market Analysis, Insights and Forecast - by Product Type
- 9. Europe Ceramic Matrix Composites Industry Analysis, Insights and Forecast, 2020-2032
- 9.1. Market Analysis, Insights and Forecast - by Product Type
- 9.1.1. C/C Ceramic Matrix Composites
- 9.1.2. C/SIC Ceramic Matrix Composites
- 9.1.3. Oxide/Oxide Ceramic Matrix Composites
- 9.1.4. SIC/SIC Ceramic Matrix Composites
- 9.2. Market Analysis, Insights and Forecast - by End-user Industry
- 9.2.1. Automotive
- 9.2.2. Aerospace
- 9.2.3. Defense
- 9.2.4. Energy and Power
- 9.2.5. Electrical and Electronics
- 9.2.6. Other End-user Industries
- 9.1. Market Analysis, Insights and Forecast - by Product Type
- 10. South America Ceramic Matrix Composites Industry Analysis, Insights and Forecast, 2020-2032
- 10.1. Market Analysis, Insights and Forecast - by Product Type
- 10.1.1. C/C Ceramic Matrix Composites
- 10.1.2. C/SIC Ceramic Matrix Composites
- 10.1.3. Oxide/Oxide Ceramic Matrix Composites
- 10.1.4. SIC/SIC Ceramic Matrix Composites
- 10.2. Market Analysis, Insights and Forecast - by End-user Industry
- 10.2.1. Automotive
- 10.2.2. Aerospace
- 10.2.3. Defense
- 10.2.4. Energy and Power
- 10.2.5. Electrical and Electronics
- 10.2.6. Other End-user Industries
- 10.1. Market Analysis, Insights and Forecast - by Product Type
- 11. Middle East and Africa Ceramic Matrix Composites Industry Analysis, Insights and Forecast, 2020-2032
- 11.1. Market Analysis, Insights and Forecast - by Product Type
- 11.1.1. C/C Ceramic Matrix Composites
- 11.1.2. C/SIC Ceramic Matrix Composites
- 11.1.3. Oxide/Oxide Ceramic Matrix Composites
- 11.1.4. SIC/SIC Ceramic Matrix Composites
- 11.2. Market Analysis, Insights and Forecast - by End-user Industry
- 11.2.1. Automotive
- 11.2.2. Aerospace
- 11.2.3. Defense
- 11.2.4. Energy and Power
- 11.2.5. Electrical and Electronics
- 11.2.6. Other End-user Industries
- 11.1. Market Analysis, Insights and Forecast - by Product Type
- 12. Competitive Analysis
- 12.1. Company Profiles
- 12.1.1 Rolls-Royce Plc
- 12.1.1.1. Company Overview
- 12.1.1.2. Products
- 12.1.1.3. Company Financials
- 12.1.1.4. SWOT Analysis
- 12.1.2 Ube Industries Ltd
- 12.1.2.1. Company Overview
- 12.1.2.2. Products
- 12.1.2.3. Company Financials
- 12.1.2.4. SWOT Analysis
- 12.1.3 General Electric
- 12.1.3.1. Company Overview
- 12.1.3.2. Products
- 12.1.3.3. Company Financials
- 12.1.3.4. SWOT Analysis
- 12.1.4 COI Ceramics Inc
- 12.1.4.1. Company Overview
- 12.1.4.2. Products
- 12.1.4.3. Company Financials
- 12.1.4.4. SWOT Analysis
- 12.1.5 Kyocera Corporation
- 12.1.5.1. Company Overview
- 12.1.5.2. Products
- 12.1.5.3. Company Financials
- 12.1.5.4. SWOT Analysis
- 12.1.6 3M
- 12.1.6.1. Company Overview
- 12.1.6.2. Products
- 12.1.6.3. Company Financials
- 12.1.6.4. SWOT Analysis
- 12.1.7 Ultramet Inc *List Not Exhaustive
- 12.1.7.1. Company Overview
- 12.1.7.2. Products
- 12.1.7.3. Company Financials
- 12.1.7.4. SWOT Analysis
- 12.1.8 SGL Carbon Company
- 12.1.8.1. Company Overview
- 12.1.8.2. Products
- 12.1.8.3. Company Financials
- 12.1.8.4. SWOT Analysis
- 12.1.9 CoorsTek Inc
- 12.1.9.1. Company Overview
- 12.1.9.2. Products
- 12.1.9.3. Company Financials
- 12.1.9.4. SWOT Analysis
- 12.1.10 Lancer Systems LP
- 12.1.10.1. Company Overview
- 12.1.10.2. Products
- 12.1.10.3. Company Financials
- 12.1.10.4. SWOT Analysis
- 12.1.11 Starfire Systems Inc
- 12.1.11.1. Company Overview
- 12.1.11.2. Products
- 12.1.11.3. Company Financials
- 12.1.11.4. SWOT Analysis
- 12.1.12 CeramTec
- 12.1.12.1. Company Overview
- 12.1.12.2. Products
- 12.1.12.3. Company Financials
- 12.1.12.4. SWOT Analysis
- 12.1.13 Applied Thin Films Inc
- 12.1.13.1. Company Overview
- 12.1.13.2. Products
- 12.1.13.3. Company Financials
- 12.1.13.4. SWOT Analysis
- 12.1.1 Rolls-Royce Plc
- 12.2. Market Entropy
- 12.2.1 Company's Key Areas Served
- 12.2.2 Recent Developments
- 12.3. Company Market Share Analysis 2025
- 12.3.1 Top 5 Companies Market Share Analysis
- 12.3.2 Top 3 Companies Market Share Analysis
- 12.4. List of Potential Customers
- 13. Research Methodology
List of Figures
- Figure 1: Global Ceramic Matrix Composites Industry Revenue Breakdown (Million, %) by Region 2025 & 2033
- Figure 2: Asia Pacific Ceramic Matrix Composites Industry Revenue (Million), by Product Type 2025 & 2033
- Figure 3: Asia Pacific Ceramic Matrix Composites Industry Revenue Share (%), by Product Type 2025 & 2033
- Figure 4: Asia Pacific Ceramic Matrix Composites Industry Revenue (Million), by End-user Industry 2025 & 2033
- Figure 5: Asia Pacific Ceramic Matrix Composites Industry Revenue Share (%), by End-user Industry 2025 & 2033
- Figure 6: Asia Pacific Ceramic Matrix Composites Industry Revenue (Million), by Country 2025 & 2033
- Figure 7: Asia Pacific Ceramic Matrix Composites Industry Revenue Share (%), by Country 2025 & 2033
- Figure 8: North America Ceramic Matrix Composites Industry Revenue (Million), by Product Type 2025 & 2033
- Figure 9: North America Ceramic Matrix Composites Industry Revenue Share (%), by Product Type 2025 & 2033
- Figure 10: North America Ceramic Matrix Composites Industry Revenue (Million), by End-user Industry 2025 & 2033
- Figure 11: North America Ceramic Matrix Composites Industry Revenue Share (%), by End-user Industry 2025 & 2033
- Figure 12: North America Ceramic Matrix Composites Industry Revenue (Million), by Country 2025 & 2033
- Figure 13: North America Ceramic Matrix Composites Industry Revenue Share (%), by Country 2025 & 2033
- Figure 14: Europe Ceramic Matrix Composites Industry Revenue (Million), by Product Type 2025 & 2033
- Figure 15: Europe Ceramic Matrix Composites Industry Revenue Share (%), by Product Type 2025 & 2033
- Figure 16: Europe Ceramic Matrix Composites Industry Revenue (Million), by End-user Industry 2025 & 2033
- Figure 17: Europe Ceramic Matrix Composites Industry Revenue Share (%), by End-user Industry 2025 & 2033
- Figure 18: Europe Ceramic Matrix Composites Industry Revenue (Million), by Country 2025 & 2033
- Figure 19: Europe Ceramic Matrix Composites Industry Revenue Share (%), by Country 2025 & 2033
- Figure 20: South America Ceramic Matrix Composites Industry Revenue (Million), by Product Type 2025 & 2033
- Figure 21: South America Ceramic Matrix Composites Industry Revenue Share (%), by Product Type 2025 & 2033
- Figure 22: South America Ceramic Matrix Composites Industry Revenue (Million), by End-user Industry 2025 & 2033
- Figure 23: South America Ceramic Matrix Composites Industry Revenue Share (%), by End-user Industry 2025 & 2033
- Figure 24: South America Ceramic Matrix Composites Industry Revenue (Million), by Country 2025 & 2033
- Figure 25: South America Ceramic Matrix Composites Industry Revenue Share (%), by Country 2025 & 2033
- Figure 26: Middle East and Africa Ceramic Matrix Composites Industry Revenue (Million), by Product Type 2025 & 2033
- Figure 27: Middle East and Africa Ceramic Matrix Composites Industry Revenue Share (%), by Product Type 2025 & 2033
- Figure 28: Middle East and Africa Ceramic Matrix Composites Industry Revenue (Million), by End-user Industry 2025 & 2033
- Figure 29: Middle East and Africa Ceramic Matrix Composites Industry Revenue Share (%), by End-user Industry 2025 & 2033
- Figure 30: Middle East and Africa Ceramic Matrix Composites Industry Revenue (Million), by Country 2025 & 2033
- Figure 31: Middle East and Africa Ceramic Matrix Composites Industry Revenue Share (%), by Country 2025 & 2033
List of Tables
- Table 1: Global Ceramic Matrix Composites Industry Revenue Million Forecast, by Product Type 2020 & 2033
- Table 2: Global Ceramic Matrix Composites Industry Revenue Million Forecast, by End-user Industry 2020 & 2033
- Table 3: Global Ceramic Matrix Composites Industry Revenue Million Forecast, by Region 2020 & 2033
- Table 4: Global Ceramic Matrix Composites Industry Revenue Million Forecast, by Product Type 2020 & 2033
- Table 5: Global Ceramic Matrix Composites Industry Revenue Million Forecast, by End-user Industry 2020 & 2033
- Table 6: Global Ceramic Matrix Composites Industry Revenue Million Forecast, by Country 2020 & 2033
- Table 7: China Ceramic Matrix Composites Industry Revenue (Million) Forecast, by Application 2020 & 2033
- Table 8: India Ceramic Matrix Composites Industry Revenue (Million) Forecast, by Application 2020 & 2033
- Table 9: Japan Ceramic Matrix Composites Industry Revenue (Million) Forecast, by Application 2020 & 2033
- Table 10: South Korea Ceramic Matrix Composites Industry Revenue (Million) Forecast, by Application 2020 & 2033
- Table 11: Malaysia Ceramic Matrix Composites Industry Revenue (Million) Forecast, by Application 2020 & 2033
- Table 12: Thailand Ceramic Matrix Composites Industry Revenue (Million) Forecast, by Application 2020 & 2033
- Table 13: Indonesia Ceramic Matrix Composites Industry Revenue (Million) Forecast, by Application 2020 & 2033
- Table 14: Vietnam Ceramic Matrix Composites Industry Revenue (Million) Forecast, by Application 2020 & 2033
- Table 15: Rest of Asia Pacific Ceramic Matrix Composites Industry Revenue (Million) Forecast, by Application 2020 & 2033
- Table 16: Global Ceramic Matrix Composites Industry Revenue Million Forecast, by Product Type 2020 & 2033
- Table 17: Global Ceramic Matrix Composites Industry Revenue Million Forecast, by End-user Industry 2020 & 2033
- Table 18: Global Ceramic Matrix Composites Industry Revenue Million Forecast, by Country 2020 & 2033
- Table 19: United States Ceramic Matrix Composites Industry Revenue (Million) Forecast, by Application 2020 & 2033
- Table 20: Canada Ceramic Matrix Composites Industry Revenue (Million) Forecast, by Application 2020 & 2033
- Table 21: Mexico Ceramic Matrix Composites Industry Revenue (Million) Forecast, by Application 2020 & 2033
- Table 22: Global Ceramic Matrix Composites Industry Revenue Million Forecast, by Product Type 2020 & 2033
- Table 23: Global Ceramic Matrix Composites Industry Revenue Million Forecast, by End-user Industry 2020 & 2033
- Table 24: Global Ceramic Matrix Composites Industry Revenue Million Forecast, by Country 2020 & 2033
- Table 25: Germany Ceramic Matrix Composites Industry Revenue (Million) Forecast, by Application 2020 & 2033
- Table 26: United Kingdom Ceramic Matrix Composites Industry Revenue (Million) Forecast, by Application 2020 & 2033
- Table 27: France Ceramic Matrix Composites Industry Revenue (Million) Forecast, by Application 2020 & 2033
- Table 28: Italy Ceramic Matrix Composites Industry Revenue (Million) Forecast, by Application 2020 & 2033
- Table 29: Spain Ceramic Matrix Composites Industry Revenue (Million) Forecast, by Application 2020 & 2033
- Table 30: Turkey Ceramic Matrix Composites Industry Revenue (Million) Forecast, by Application 2020 & 2033
- Table 31: Russia Ceramic Matrix Composites Industry Revenue (Million) Forecast, by Application 2020 & 2033
- Table 32: Nordic Countries Ceramic Matrix Composites Industry Revenue (Million) Forecast, by Application 2020 & 2033
- Table 33: Rest of Europe Ceramic Matrix Composites Industry Revenue (Million) Forecast, by Application 2020 & 2033
- Table 34: Global Ceramic Matrix Composites Industry Revenue Million Forecast, by Product Type 2020 & 2033
- Table 35: Global Ceramic Matrix Composites Industry Revenue Million Forecast, by End-user Industry 2020 & 2033
- Table 36: Global Ceramic Matrix Composites Industry Revenue Million Forecast, by Country 2020 & 2033
- Table 37: Brazil Ceramic Matrix Composites Industry Revenue (Million) Forecast, by Application 2020 & 2033
- Table 38: Argentina Ceramic Matrix Composites Industry Revenue (Million) Forecast, by Application 2020 & 2033
- Table 39: Colombia Ceramic Matrix Composites Industry Revenue (Million) Forecast, by Application 2020 & 2033
- Table 40: Rest of South America Ceramic Matrix Composites Industry Revenue (Million) Forecast, by Application 2020 & 2033
- Table 41: Global Ceramic Matrix Composites Industry Revenue Million Forecast, by Product Type 2020 & 2033
- Table 42: Global Ceramic Matrix Composites Industry Revenue Million Forecast, by End-user Industry 2020 & 2033
- Table 43: Global Ceramic Matrix Composites Industry Revenue Million Forecast, by Country 2020 & 2033
- Table 44: Saudi Arabia Ceramic Matrix Composites Industry Revenue (Million) Forecast, by Application 2020 & 2033
- Table 45: Nigeria Ceramic Matrix Composites Industry Revenue (Million) Forecast, by Application 2020 & 2033
- Table 46: Qatar Ceramic Matrix Composites Industry Revenue (Million) Forecast, by Application 2020 & 2033
- Table 47: Egypt Ceramic Matrix Composites Industry Revenue (Million) Forecast, by Application 2020 & 2033
- Table 48: United Arab Emirates Ceramic Matrix Composites Industry Revenue (Million) Forecast, by Application 2020 & 2033
- Table 49: South Africa Ceramic Matrix Composites Industry Revenue (Million) Forecast, by Application 2020 & 2033
- Table 50: Rest of Middle East and Africa Ceramic Matrix Composites Industry Revenue (Million) Forecast, by Application 2020 & 2033
Frequently Asked Questions
1. What is the projected Compound Annual Growth Rate (CAGR) of the Ceramic Matrix Composites Industry?
The projected CAGR is approximately > 10.00%.
2. Which companies are prominent players in the Ceramic Matrix Composites Industry?
Key companies in the market include Rolls-Royce Plc, Ube Industries Ltd, General Electric, COI Ceramics Inc, Kyocera Corporation, 3M, Ultramet Inc *List Not Exhaustive, SGL Carbon Company, CoorsTek Inc, Lancer Systems LP, Starfire Systems Inc, CeramTec, Applied Thin Films Inc.
3. What are the main segments of the Ceramic Matrix Composites Industry?
The market segments include Product Type, End-user Industry.
4. Can you provide details about the market size?
The market size is estimated to be USD XX Million as of 2022.
5. What are some drivers contributing to market growth?
; Increasing Application of Ceramic Matrix Composites in Defense Sector; Exceptional Performance Properties at Very High Temperatures.
6. What are the notable trends driving market growth?
SIC/SIC Ceramic Matrix Composites to Drive the Market Growth.
7. Are there any restraints impacting market growth?
; Higher Cost of Production as Compared to Other Metals & Alloys; Impact of COVID-19 on the Market Studied.
8. Can you provide examples of recent developments in the market?
N/A
9. What pricing options are available for accessing the report?
Pricing options include single-user, multi-user, and enterprise licenses priced at USD 4750, USD 5250, and USD 8750 respectively.
10. Is the market size provided in terms of value or volume?
The market size is provided in terms of value, measured in Million.
11. Are there any specific market keywords associated with the report?
Yes, the market keyword associated with the report is "Ceramic Matrix Composites Industry," which aids in identifying and referencing the specific market segment covered.
12. How do I determine which pricing option suits my needs best?
The pricing options vary based on user requirements and access needs. Individual users may opt for single-user licenses, while businesses requiring broader access may choose multi-user or enterprise licenses for cost-effective access to the report.
13. Are there any additional resources or data provided in the Ceramic Matrix Composites Industry report?
While the report offers comprehensive insights, it's advisable to review the specific contents or supplementary materials provided to ascertain if additional resources or data are available.
14. How can I stay updated on further developments or reports in the Ceramic Matrix Composites Industry?
To stay informed about further developments, trends, and reports in the Ceramic Matrix Composites Industry, consider subscribing to industry newsletters, following relevant companies and organizations, or regularly checking reputable industry news sources and publications.
Methodology
Step 1 - Identification of Relevant Samples Size from Population Database


Step 2 - Approaches for Defining Global Market Size (Value, Volume* & Price*)

Note*: In applicable scenarios
Step 3 - Data Sources
Primary Research
- Web Analytics
- Survey Reports
- Research Institute
- Latest Research Reports
- Opinion Leaders
Secondary Research
- Annual Reports
- White Paper
- Latest Press Release
- Industry Association
- Paid Database
- Investor Presentations

Step 4 - Data Triangulation
Involves using different sources of information in order to increase the validity of a study
These sources are likely to be stakeholders in a program - participants, other researchers, program staff, other community members, and so on.
Then we put all data in single framework & apply various statistical tools to find out the dynamic on the market.
During the analysis stage, feedback from the stakeholder groups would be compared to determine areas of agreement as well as areas of divergence