

Key Insights
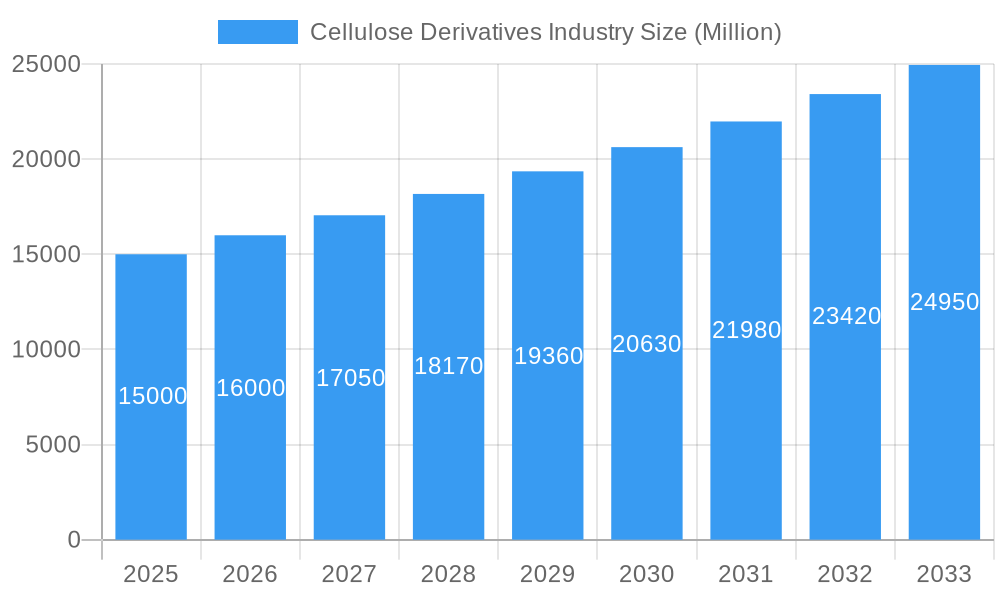
The global cellulose derivatives market is projected for substantial expansion, anticipating a Compound Annual Growth Rate (CAGR) of 6.6%. This growth, beginning from a market size of $6.73 billion in the base year 2025, is driven by key industry trends. The construction sector's escalating demand for cellulose-based products in paints, coatings, and adhesives is a primary growth catalyst. Concurrently, the cosmetics and pharmaceuticals industries are increasingly leveraging cellulose derivatives due to their biocompatibility and functional versatility. The food and beverage industry also significantly contributes to the market's overall size, utilizing these derivatives as essential thickeners, stabilizers, and emulsifiers. Technological advancements fostering the development of novel cellulose derivatives with improved biodegradability and performance characteristics are further propelling market growth. However, market expansion faces potential challenges from raw material price volatility, particularly for pulp and wood, and the increasing availability of alternative materials offering comparable functionalities.
Cellulose Derivatives Industry Market Size (In Billion)
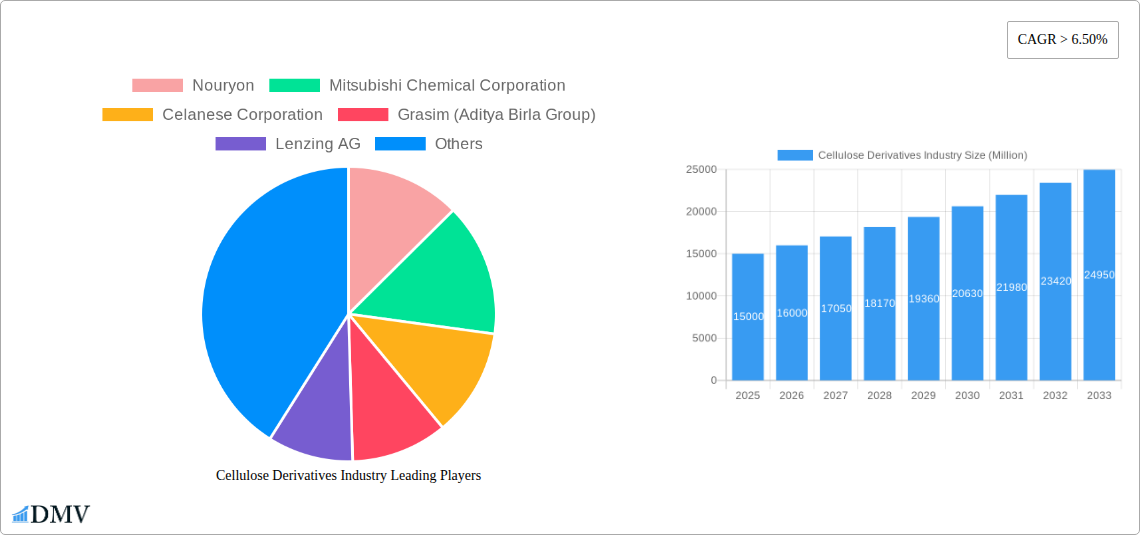
The market is segmented by chemical type (cellulose esters, cellulose ethers, regenerated cellulose) and end-user industry, including construction, cosmetics & pharmaceuticals, food & beverage, paints & coatings, plastics, textile, and others. Leading market participants such as Nouryon, Mitsubishi Chemical Corporation, and Celanese Corporation are actively influencing the market through innovation and strategic alliances. Regional market shares are notably concentrated in North America and Asia Pacific, propelled by robust economic activity and escalating industrialization.
Cellulose Derivatives Industry Company Market Share
Future market trajectory will be shaped by continuous innovation in cellulose derivative applications, particularly within high-growth segments like sustainable packaging and bioplastics. Enhancing production sustainability and cost-effectiveness will be critical for sustained market expansion. Evolving regulatory frameworks concerning environmental impact and material safety may also influence market dynamics. Emerging economies in Asia Pacific are anticipated to exhibit faster growth rates compared to mature markets in North America and Europe, driven by rising disposable incomes, heightened industrialization, and governmental support for sustainable material development. The cellulose derivatives market is thus positioned for sustained growth, presenting significant opportunities for both established and emerging players.
Cellulose Derivatives Industry: A Comprehensive Market Report (2019-2033)
This insightful report provides a detailed analysis of the global Cellulose Derivatives market, projecting a market size of XXX Million by 2033. It offers a comprehensive overview of market dynamics, growth drivers, challenges, and future opportunities, covering the period from 2019 to 2033, with 2025 as the base year. Key players like Nouryon, Mitsubishi Chemical Corporation, and Celanese Corporation are profiled, along with a thorough examination of market segments and regional variations. This report is essential for stakeholders seeking to understand and capitalize on the burgeoning opportunities within the cellulose derivatives sector.
Cellulose Derivatives Industry Market Composition & Trends
The global cellulose derivatives market, valued at XXX Million in 2025, is characterized by a moderately concentrated landscape with key players holding significant market share. Nouryon, Mitsubishi Chemical Corporation, and Celanese Corporation collectively account for approximately xx% of the market. Innovation is driven by the increasing demand for sustainable and bio-based materials, prompting significant R&D investments in modified cellulose derivatives with enhanced properties. Stringent regulatory frameworks concerning environmental impact and product safety influence market dynamics, particularly in regions like Europe and North America. The emergence of biodegradable plastics and other substitute materials poses a moderate competitive threat. End-user industries, including construction, cosmetics & pharmaceuticals, and food & beverage, are major consumers, with distinct needs driving product diversification. The market has witnessed several noteworthy M&A activities in recent years, with deal values exceeding XXX Million in total between 2019 and 2024.
- Market Share Distribution (2025): Nouryon (xx%), Mitsubishi Chemical (xx%), Celanese (xx%), Others (xx%)
- M&A Activity (2019-2024): Total deal value exceeding XXX Million.
- Key Regulatory Factors: Focus on biodegradability, toxicity, and sustainable sourcing.
- Substitute Products: Bioplastics, synthetic polymers.
Cellulose Derivatives Industry Evolution
The cellulose derivatives market has experienced consistent growth over the historical period (2019-2024), with a Compound Annual Growth Rate (CAGR) of xx%. This growth is primarily attributed to the increasing demand for sustainable materials across various end-user sectors. Technological advancements, such as the development of novel cellulose derivatives with tailored properties and improved processing techniques, have further propelled market expansion. A notable trend is the growing consumer preference for eco-friendly and biodegradable products, driving the adoption of cellulose-based alternatives to traditional materials in packaging, textiles, and other applications. Specific data points reveal a xx% increase in the demand for cellulose ethers in the construction sector between 2021 and 2024, while the adoption of regenerated cellulose fibers in the textile industry witnessed a xx% surge during the same period. This growth trajectory is expected to continue during the forecast period (2025-2033), fueled by ongoing innovations and increasing consumer awareness of sustainability issues. The market is predicted to reach XXX Million by 2033, exhibiting a CAGR of xx%.
Leading Regions, Countries, or Segments in Cellulose Derivatives Industry
North America currently dominates the cellulose derivatives market, driven by strong demand from the construction and packaging sectors. This dominance is further bolstered by robust research and development activities and favorable regulatory environments.
- Key Drivers in North America: High levels of investment in sustainable materials, stringent environmental regulations, and a strong presence of major industry players.
Europe also holds a significant market share, characterized by a focus on sustainable and bio-based products, stringent environmental regulations, and the presence of established cellulose producers like Lenzing AG. In Asia-Pacific, rapid industrialization and economic growth are fueling market expansion, with a particular surge in demand from the construction and textile industries.
- Key Drivers in Europe: Stringent environmental regulations, high consumer awareness of sustainable products, and strong presence of established players like Lenzing AG.
- Key Drivers in Asia-Pacific: Rapid economic growth, increasing urbanization, and growing demand for sustainable materials.
Amongst the chemical types, cellulose ethers currently hold the largest market share due to their versatility and wide range of applications across various sectors. The construction industry represents the largest end-user segment, driven by the use of cellulose ethers as binders, thickeners, and stabilizers in construction materials.
Cellulose Derivatives Industry Product Innovations
Recent innovations focus on developing cellulose derivatives with enhanced properties such as improved water resistance, increased strength, and better biodegradability. These advancements are achieved through chemical modifications and novel processing techniques. For instance, the introduction of hydrophobic cellulose ethers has expanded their applicability in demanding applications, while innovations in regenerated cellulose fibers have resulted in fabrics with superior softness and drape. These innovations offer unique selling propositions, such as enhanced performance, sustainability benefits, and cost-effectiveness, driving market adoption.
Propelling Factors for Cellulose Derivatives Industry Growth
The cellulose derivatives market is propelled by several factors. Firstly, the increasing demand for sustainable and bio-based materials is a significant driver, spurred by growing environmental concerns and stricter regulations. Secondly, technological advancements, such as the development of new derivatives with improved properties, are opening up new applications in diverse sectors. Finally, economic growth in developing countries is creating new market opportunities, especially in the construction and packaging industries. Specific examples include the rising popularity of biodegradable packaging and the increased adoption of cellulose-based materials in construction applications.
Obstacles in the Cellulose Derivatives Industry Market
Challenges for the market include fluctuations in raw material prices, which can significantly impact production costs and profitability. Supply chain disruptions, particularly related to the availability of key raw materials, can also hamper production and lead to price volatility. Furthermore, the market faces competitive pressure from alternative materials like synthetic polymers, and stringent environmental regulations can increase production costs. The impact of these obstacles can be quantified in terms of reduced profitability margins and potential delays in project completion.
Future Opportunities in Cellulose Derivatives Industry
The future of the cellulose derivatives market looks promising. Emerging opportunities include the development of new applications in high-growth sectors like electronics and renewable energy. Further innovations in material properties will enable the replacement of traditional materials in a wider range of applications. Finally, the growing consumer preference for sustainable products will create significant demand for cellulose-based alternatives, pushing further innovation and market growth.
Major Players in the Cellulose Derivatives Industry Ecosystem
- Nouryon
- Mitsubishi Chemical Corporation
- Celanese Corporation
- Grasim (Aditya Birla Group)
- Lenzing AG
- Futamura Chemical Co Ltd
- Ashland
- DuPont
- Dow
- Eastman Chemical Company
- Daicel Corporation
- FKuR
- Sappi Limited
- Shin-Etsu Chemical Co Ltd
- Xinjiang Zhongtai Chemical Co Ltd
- Cerdia International GmbH
Key Developments in Cellulose Derivatives Industry Industry
- 2023-Q3: Celanese Corporation announced a significant investment in expanding its cellulose acetate production capacity.
- 2022-Q4: Lenzing AG launched a new line of sustainable cellulose fibers with enhanced properties.
- 2021-Q2: Mitsubishi Chemical Corporation acquired a smaller cellulose derivatives producer, expanding its market presence. (Further developments can be added here)
Strategic Cellulose Derivatives Industry Market Forecast
The cellulose derivatives market is poised for significant growth over the forecast period (2025-2033), driven by ongoing innovations, increasing demand for sustainable materials, and expansion into new applications. The market's future success hinges on continued R&D efforts to develop novel derivatives with improved properties and cost-effectiveness. Furthermore, strategic partnerships and collaborations within the industry will be vital for overcoming challenges related to supply chain disruptions and competitive pressures, thus unlocking the market's considerable potential.
Cellulose Derivatives Industry Segmentation
-
1. Chemical Type
- 1.1. Cellulose Esters
- 1.2. Cellulose Ethers
- 1.3. Regenerated Cellulose
-
2. End-user Industry
- 2.1. Construction
- 2.2. Cosmetics & Pharmaceuricals
- 2.3. Food & Beverage
- 2.4. Paints & Coatings
- 2.5. Plastics
- 2.6. Textile
- 2.7. Other End-user Industries
Cellulose Derivatives Industry Segmentation By Geography
-
1. Asia Pacific
- 1.1. China
- 1.2. India
- 1.3. Japan
- 1.4. South Korea
- 1.5. Rest of Asia Pacific
-
2. North America
- 2.1. United States
- 2.2. Mexico
- 2.3. Canada
-
3. Europe
- 3.1. Germany
- 3.2. United Kingdom
- 3.3. Italy
- 3.4. France
- 3.5. Rest of Europe
-
4. South America
- 4.1. Brazil
- 4.2. Argentina
- 4.3. Rest of South America
-
5. Middle East & Africa
- 5.1. UAE
- 5.2. Saudi Arabia
- 5.3. South Africa
- 5.4. Rest of Middle East & Africa
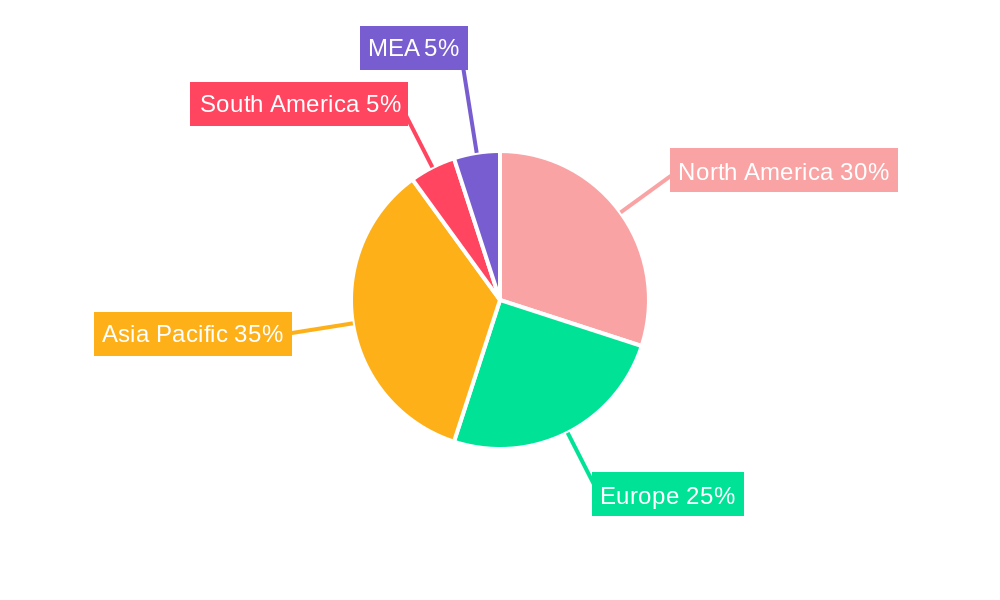
Cellulose Derivatives Industry Regional Market Share
Geographic Coverage of Cellulose Derivatives Industry
Cellulose Derivatives Industry REPORT HIGHLIGHTS
| Aspects | Details |
|---|---|
| Study Period | 2020-2034 |
| Base Year | 2025 |
| Estimated Year | 2026 |
| Forecast Period | 2026-2034 |
| Historical Period | 2020-2025 |
| Growth Rate | CAGR of 6.6% from 2020-2034 |
| Segmentation |
|
Table of Contents
- 1. Introduction
- 1.1. Research Scope
- 1.2. Market Segmentation
- 1.3. Research Objective
- 1.4. Definitions and Assumptions
- 2. Executive Summary
- 2.1. Market Snapshot
- 3. Market Dynamics
- 3.1. Market Drivers
- 3.2. Market Restrains
- 3.3. Market Trends
- 3.4. Market Opportunities
- 4. Market Factor Analysis
- 4.1. Porters Five Forces
- 4.1.1. Bargaining Power of Suppliers
- 4.1.2. Bargaining Power of Buyers
- 4.1.3. Threat of New Entrants
- 4.1.4. Threat of Substitutes
- 4.1.5. Competitive Rivalry
- 4.2. PESTEL analysis
- 4.3. BCG Analysis
- 4.3.1. Stars (High Growth, High Market Share)
- 4.3.2. Cash Cows (Low Growth, High Market Share)
- 4.3.3. Question Mark (High Growth, Low Market Share)
- 4.3.4. Dogs (Low Growth, Low Market Share)
- 4.4. Ansoff Matrix Analysis
- 4.5. Supply Chain Analysis
- 4.6. Regulatory Landscape
- 4.7. Current Market Potential and Opportunity Assessment (TAM–SAM–SOM Framework)
- 4.8. DMV Analyst Note
- 4.1. Porters Five Forces
- 5. Market Analysis, Insights and Forecast 2021-2033
- 5.1. Market Analysis, Insights and Forecast - by Chemical Type
- 5.1.1. Cellulose Esters
- 5.1.2. Cellulose Ethers
- 5.1.3. Regenerated Cellulose
- 5.2. Market Analysis, Insights and Forecast - by End-user Industry
- 5.2.1. Construction
- 5.2.2. Cosmetics & Pharmaceuricals
- 5.2.3. Food & Beverage
- 5.2.4. Paints & Coatings
- 5.2.5. Plastics
- 5.2.6. Textile
- 5.2.7. Other End-user Industries
- 5.3. Market Analysis, Insights and Forecast - by Region
- 5.3.1. Asia Pacific
- 5.3.2. North America
- 5.3.3. Europe
- 5.3.4. South America
- 5.3.5. Middle East & Africa
- 5.1. Market Analysis, Insights and Forecast - by Chemical Type
- 6. Global Cellulose Derivatives Industry Analysis, Insights and Forecast, 2021-2033
- 6.1. Market Analysis, Insights and Forecast - by Chemical Type
- 6.1.1. Cellulose Esters
- 6.1.2. Cellulose Ethers
- 6.1.3. Regenerated Cellulose
- 6.2. Market Analysis, Insights and Forecast - by End-user Industry
- 6.2.1. Construction
- 6.2.2. Cosmetics & Pharmaceuricals
- 6.2.3. Food & Beverage
- 6.2.4. Paints & Coatings
- 6.2.5. Plastics
- 6.2.6. Textile
- 6.2.7. Other End-user Industries
- 6.1. Market Analysis, Insights and Forecast - by Chemical Type
- 7. Asia Pacific Cellulose Derivatives Industry Analysis, Insights and Forecast, 2020-2032
- 7.1. Market Analysis, Insights and Forecast - by Chemical Type
- 7.1.1. Cellulose Esters
- 7.1.2. Cellulose Ethers
- 7.1.3. Regenerated Cellulose
- 7.2. Market Analysis, Insights and Forecast - by End-user Industry
- 7.2.1. Construction
- 7.2.2. Cosmetics & Pharmaceuricals
- 7.2.3. Food & Beverage
- 7.2.4. Paints & Coatings
- 7.2.5. Plastics
- 7.2.6. Textile
- 7.2.7. Other End-user Industries
- 7.1. Market Analysis, Insights and Forecast - by Chemical Type
- 8. North America Cellulose Derivatives Industry Analysis, Insights and Forecast, 2020-2032
- 8.1. Market Analysis, Insights and Forecast - by Chemical Type
- 8.1.1. Cellulose Esters
- 8.1.2. Cellulose Ethers
- 8.1.3. Regenerated Cellulose
- 8.2. Market Analysis, Insights and Forecast - by End-user Industry
- 8.2.1. Construction
- 8.2.2. Cosmetics & Pharmaceuricals
- 8.2.3. Food & Beverage
- 8.2.4. Paints & Coatings
- 8.2.5. Plastics
- 8.2.6. Textile
- 8.2.7. Other End-user Industries
- 8.1. Market Analysis, Insights and Forecast - by Chemical Type
- 9. Europe Cellulose Derivatives Industry Analysis, Insights and Forecast, 2020-2032
- 9.1. Market Analysis, Insights and Forecast - by Chemical Type
- 9.1.1. Cellulose Esters
- 9.1.2. Cellulose Ethers
- 9.1.3. Regenerated Cellulose
- 9.2. Market Analysis, Insights and Forecast - by End-user Industry
- 9.2.1. Construction
- 9.2.2. Cosmetics & Pharmaceuricals
- 9.2.3. Food & Beverage
- 9.2.4. Paints & Coatings
- 9.2.5. Plastics
- 9.2.6. Textile
- 9.2.7. Other End-user Industries
- 9.1. Market Analysis, Insights and Forecast - by Chemical Type
- 10. South America Cellulose Derivatives Industry Analysis, Insights and Forecast, 2020-2032
- 10.1. Market Analysis, Insights and Forecast - by Chemical Type
- 10.1.1. Cellulose Esters
- 10.1.2. Cellulose Ethers
- 10.1.3. Regenerated Cellulose
- 10.2. Market Analysis, Insights and Forecast - by End-user Industry
- 10.2.1. Construction
- 10.2.2. Cosmetics & Pharmaceuricals
- 10.2.3. Food & Beverage
- 10.2.4. Paints & Coatings
- 10.2.5. Plastics
- 10.2.6. Textile
- 10.2.7. Other End-user Industries
- 10.1. Market Analysis, Insights and Forecast - by Chemical Type
- 11. Middle East & Africa Cellulose Derivatives Industry Analysis, Insights and Forecast, 2020-2032
- 11.1. Market Analysis, Insights and Forecast - by Chemical Type
- 11.1.1. Cellulose Esters
- 11.1.2. Cellulose Ethers
- 11.1.3. Regenerated Cellulose
- 11.2. Market Analysis, Insights and Forecast - by End-user Industry
- 11.2.1. Construction
- 11.2.2. Cosmetics & Pharmaceuricals
- 11.2.3. Food & Beverage
- 11.2.4. Paints & Coatings
- 11.2.5. Plastics
- 11.2.6. Textile
- 11.2.7. Other End-user Industries
- 11.1. Market Analysis, Insights and Forecast - by Chemical Type
- 12. Competitive Analysis
- 12.1. Company Profiles
- 12.1.1 Nouryon
- 12.1.1.1. Company Overview
- 12.1.1.2. Products
- 12.1.1.3. Company Financials
- 12.1.1.4. SWOT Analysis
- 12.1.2 Mitsubishi Chemical Corporation
- 12.1.2.1. Company Overview
- 12.1.2.2. Products
- 12.1.2.3. Company Financials
- 12.1.2.4. SWOT Analysis
- 12.1.3 Celanese Corporation
- 12.1.3.1. Company Overview
- 12.1.3.2. Products
- 12.1.3.3. Company Financials
- 12.1.3.4. SWOT Analysis
- 12.1.4 Grasim (Aditya Birla Group)
- 12.1.4.1. Company Overview
- 12.1.4.2. Products
- 12.1.4.3. Company Financials
- 12.1.4.4. SWOT Analysis
- 12.1.5 Lenzing AG
- 12.1.5.1. Company Overview
- 12.1.5.2. Products
- 12.1.5.3. Company Financials
- 12.1.5.4. SWOT Analysis
- 12.1.6 Futamura Chemical Co Ltd
- 12.1.6.1. Company Overview
- 12.1.6.2. Products
- 12.1.6.3. Company Financials
- 12.1.6.4. SWOT Analysis
- 12.1.7 Ashland
- 12.1.7.1. Company Overview
- 12.1.7.2. Products
- 12.1.7.3. Company Financials
- 12.1.7.4. SWOT Analysis
- 12.1.8 DuPont
- 12.1.8.1. Company Overview
- 12.1.8.2. Products
- 12.1.8.3. Company Financials
- 12.1.8.4. SWOT Analysis
- 12.1.9 Dow
- 12.1.9.1. Company Overview
- 12.1.9.2. Products
- 12.1.9.3. Company Financials
- 12.1.9.4. SWOT Analysis
- 12.1.10 Eastman Chemical Company
- 12.1.10.1. Company Overview
- 12.1.10.2. Products
- 12.1.10.3. Company Financials
- 12.1.10.4. SWOT Analysis
- 12.1.11 Daicel Corporation
- 12.1.11.1. Company Overview
- 12.1.11.2. Products
- 12.1.11.3. Company Financials
- 12.1.11.4. SWOT Analysis
- 12.1.12 FKuR
- 12.1.12.1. Company Overview
- 12.1.12.2. Products
- 12.1.12.3. Company Financials
- 12.1.12.4. SWOT Analysis
- 12.1.13 Sappi Limited
- 12.1.13.1. Company Overview
- 12.1.13.2. Products
- 12.1.13.3. Company Financials
- 12.1.13.4. SWOT Analysis
- 12.1.14 Shin-Etsu Chemical Co Ltd
- 12.1.14.1. Company Overview
- 12.1.14.2. Products
- 12.1.14.3. Company Financials
- 12.1.14.4. SWOT Analysis
- 12.1.15 Xinjiang Zhongtai Chemical Co Ltd
- 12.1.15.1. Company Overview
- 12.1.15.2. Products
- 12.1.15.3. Company Financials
- 12.1.15.4. SWOT Analysis
- 12.1.16 Cerdia International GmbH
- 12.1.16.1. Company Overview
- 12.1.16.2. Products
- 12.1.16.3. Company Financials
- 12.1.16.4. SWOT Analysis
- 12.1.1 Nouryon
- 12.2. Market Entropy
- 12.2.1 Company's Key Areas Served
- 12.2.2 Recent Developments
- 12.3. Company Market Share Analysis 2025
- 12.3.1 Top 5 Companies Market Share Analysis
- 12.3.2 Top 3 Companies Market Share Analysis
- 12.4. List of Potential Customers
- 13. Research Methodology
List of Figures
- Figure 1: Global Cellulose Derivatives Industry Revenue Breakdown (billion, %) by Region 2025 & 2033
- Figure 2: Global Cellulose Derivatives Industry Volume Breakdown (K Tons, %) by Region 2025 & 2033
- Figure 3: Asia Pacific Cellulose Derivatives Industry Revenue (billion), by Chemical Type 2025 & 2033
- Figure 4: Asia Pacific Cellulose Derivatives Industry Volume (K Tons), by Chemical Type 2025 & 2033
- Figure 5: Asia Pacific Cellulose Derivatives Industry Revenue Share (%), by Chemical Type 2025 & 2033
- Figure 6: Asia Pacific Cellulose Derivatives Industry Volume Share (%), by Chemical Type 2025 & 2033
- Figure 7: Asia Pacific Cellulose Derivatives Industry Revenue (billion), by End-user Industry 2025 & 2033
- Figure 8: Asia Pacific Cellulose Derivatives Industry Volume (K Tons), by End-user Industry 2025 & 2033
- Figure 9: Asia Pacific Cellulose Derivatives Industry Revenue Share (%), by End-user Industry 2025 & 2033
- Figure 10: Asia Pacific Cellulose Derivatives Industry Volume Share (%), by End-user Industry 2025 & 2033
- Figure 11: Asia Pacific Cellulose Derivatives Industry Revenue (billion), by Country 2025 & 2033
- Figure 12: Asia Pacific Cellulose Derivatives Industry Volume (K Tons), by Country 2025 & 2033
- Figure 13: Asia Pacific Cellulose Derivatives Industry Revenue Share (%), by Country 2025 & 2033
- Figure 14: Asia Pacific Cellulose Derivatives Industry Volume Share (%), by Country 2025 & 2033
- Figure 15: North America Cellulose Derivatives Industry Revenue (billion), by Chemical Type 2025 & 2033
- Figure 16: North America Cellulose Derivatives Industry Volume (K Tons), by Chemical Type 2025 & 2033
- Figure 17: North America Cellulose Derivatives Industry Revenue Share (%), by Chemical Type 2025 & 2033
- Figure 18: North America Cellulose Derivatives Industry Volume Share (%), by Chemical Type 2025 & 2033
- Figure 19: North America Cellulose Derivatives Industry Revenue (billion), by End-user Industry 2025 & 2033
- Figure 20: North America Cellulose Derivatives Industry Volume (K Tons), by End-user Industry 2025 & 2033
- Figure 21: North America Cellulose Derivatives Industry Revenue Share (%), by End-user Industry 2025 & 2033
- Figure 22: North America Cellulose Derivatives Industry Volume Share (%), by End-user Industry 2025 & 2033
- Figure 23: North America Cellulose Derivatives Industry Revenue (billion), by Country 2025 & 2033
- Figure 24: North America Cellulose Derivatives Industry Volume (K Tons), by Country 2025 & 2033
- Figure 25: North America Cellulose Derivatives Industry Revenue Share (%), by Country 2025 & 2033
- Figure 26: North America Cellulose Derivatives Industry Volume Share (%), by Country 2025 & 2033
- Figure 27: Europe Cellulose Derivatives Industry Revenue (billion), by Chemical Type 2025 & 2033
- Figure 28: Europe Cellulose Derivatives Industry Volume (K Tons), by Chemical Type 2025 & 2033
- Figure 29: Europe Cellulose Derivatives Industry Revenue Share (%), by Chemical Type 2025 & 2033
- Figure 30: Europe Cellulose Derivatives Industry Volume Share (%), by Chemical Type 2025 & 2033
- Figure 31: Europe Cellulose Derivatives Industry Revenue (billion), by End-user Industry 2025 & 2033
- Figure 32: Europe Cellulose Derivatives Industry Volume (K Tons), by End-user Industry 2025 & 2033
- Figure 33: Europe Cellulose Derivatives Industry Revenue Share (%), by End-user Industry 2025 & 2033
- Figure 34: Europe Cellulose Derivatives Industry Volume Share (%), by End-user Industry 2025 & 2033
- Figure 35: Europe Cellulose Derivatives Industry Revenue (billion), by Country 2025 & 2033
- Figure 36: Europe Cellulose Derivatives Industry Volume (K Tons), by Country 2025 & 2033
- Figure 37: Europe Cellulose Derivatives Industry Revenue Share (%), by Country 2025 & 2033
- Figure 38: Europe Cellulose Derivatives Industry Volume Share (%), by Country 2025 & 2033
- Figure 39: South America Cellulose Derivatives Industry Revenue (billion), by Chemical Type 2025 & 2033
- Figure 40: South America Cellulose Derivatives Industry Volume (K Tons), by Chemical Type 2025 & 2033
- Figure 41: South America Cellulose Derivatives Industry Revenue Share (%), by Chemical Type 2025 & 2033
- Figure 42: South America Cellulose Derivatives Industry Volume Share (%), by Chemical Type 2025 & 2033
- Figure 43: South America Cellulose Derivatives Industry Revenue (billion), by End-user Industry 2025 & 2033
- Figure 44: South America Cellulose Derivatives Industry Volume (K Tons), by End-user Industry 2025 & 2033
- Figure 45: South America Cellulose Derivatives Industry Revenue Share (%), by End-user Industry 2025 & 2033
- Figure 46: South America Cellulose Derivatives Industry Volume Share (%), by End-user Industry 2025 & 2033
- Figure 47: South America Cellulose Derivatives Industry Revenue (billion), by Country 2025 & 2033
- Figure 48: South America Cellulose Derivatives Industry Volume (K Tons), by Country 2025 & 2033
- Figure 49: South America Cellulose Derivatives Industry Revenue Share (%), by Country 2025 & 2033
- Figure 50: South America Cellulose Derivatives Industry Volume Share (%), by Country 2025 & 2033
- Figure 51: Middle East & Africa Cellulose Derivatives Industry Revenue (billion), by Chemical Type 2025 & 2033
- Figure 52: Middle East & Africa Cellulose Derivatives Industry Volume (K Tons), by Chemical Type 2025 & 2033
- Figure 53: Middle East & Africa Cellulose Derivatives Industry Revenue Share (%), by Chemical Type 2025 & 2033
- Figure 54: Middle East & Africa Cellulose Derivatives Industry Volume Share (%), by Chemical Type 2025 & 2033
- Figure 55: Middle East & Africa Cellulose Derivatives Industry Revenue (billion), by End-user Industry 2025 & 2033
- Figure 56: Middle East & Africa Cellulose Derivatives Industry Volume (K Tons), by End-user Industry 2025 & 2033
- Figure 57: Middle East & Africa Cellulose Derivatives Industry Revenue Share (%), by End-user Industry 2025 & 2033
- Figure 58: Middle East & Africa Cellulose Derivatives Industry Volume Share (%), by End-user Industry 2025 & 2033
- Figure 59: Middle East & Africa Cellulose Derivatives Industry Revenue (billion), by Country 2025 & 2033
- Figure 60: Middle East & Africa Cellulose Derivatives Industry Volume (K Tons), by Country 2025 & 2033
- Figure 61: Middle East & Africa Cellulose Derivatives Industry Revenue Share (%), by Country 2025 & 2033
- Figure 62: Middle East & Africa Cellulose Derivatives Industry Volume Share (%), by Country 2025 & 2033
List of Tables
- Table 1: Global Cellulose Derivatives Industry Revenue billion Forecast, by Chemical Type 2020 & 2033
- Table 2: Global Cellulose Derivatives Industry Volume K Tons Forecast, by Chemical Type 2020 & 2033
- Table 3: Global Cellulose Derivatives Industry Revenue billion Forecast, by End-user Industry 2020 & 2033
- Table 4: Global Cellulose Derivatives Industry Volume K Tons Forecast, by End-user Industry 2020 & 2033
- Table 5: Global Cellulose Derivatives Industry Revenue billion Forecast, by Region 2020 & 2033
- Table 6: Global Cellulose Derivatives Industry Volume K Tons Forecast, by Region 2020 & 2033
- Table 7: Global Cellulose Derivatives Industry Revenue billion Forecast, by Chemical Type 2020 & 2033
- Table 8: Global Cellulose Derivatives Industry Volume K Tons Forecast, by Chemical Type 2020 & 2033
- Table 9: Global Cellulose Derivatives Industry Revenue billion Forecast, by End-user Industry 2020 & 2033
- Table 10: Global Cellulose Derivatives Industry Volume K Tons Forecast, by End-user Industry 2020 & 2033
- Table 11: Global Cellulose Derivatives Industry Revenue billion Forecast, by Country 2020 & 2033
- Table 12: Global Cellulose Derivatives Industry Volume K Tons Forecast, by Country 2020 & 2033
- Table 13: China Cellulose Derivatives Industry Revenue (billion) Forecast, by Application 2020 & 2033
- Table 14: China Cellulose Derivatives Industry Volume (K Tons) Forecast, by Application 2020 & 2033
- Table 15: India Cellulose Derivatives Industry Revenue (billion) Forecast, by Application 2020 & 2033
- Table 16: India Cellulose Derivatives Industry Volume (K Tons) Forecast, by Application 2020 & 2033
- Table 17: Japan Cellulose Derivatives Industry Revenue (billion) Forecast, by Application 2020 & 2033
- Table 18: Japan Cellulose Derivatives Industry Volume (K Tons) Forecast, by Application 2020 & 2033
- Table 19: South Korea Cellulose Derivatives Industry Revenue (billion) Forecast, by Application 2020 & 2033
- Table 20: South Korea Cellulose Derivatives Industry Volume (K Tons) Forecast, by Application 2020 & 2033
- Table 21: Rest of Asia Pacific Cellulose Derivatives Industry Revenue (billion) Forecast, by Application 2020 & 2033
- Table 22: Rest of Asia Pacific Cellulose Derivatives Industry Volume (K Tons) Forecast, by Application 2020 & 2033
- Table 23: Global Cellulose Derivatives Industry Revenue billion Forecast, by Chemical Type 2020 & 2033
- Table 24: Global Cellulose Derivatives Industry Volume K Tons Forecast, by Chemical Type 2020 & 2033
- Table 25: Global Cellulose Derivatives Industry Revenue billion Forecast, by End-user Industry 2020 & 2033
- Table 26: Global Cellulose Derivatives Industry Volume K Tons Forecast, by End-user Industry 2020 & 2033
- Table 27: Global Cellulose Derivatives Industry Revenue billion Forecast, by Country 2020 & 2033
- Table 28: Global Cellulose Derivatives Industry Volume K Tons Forecast, by Country 2020 & 2033
- Table 29: United States Cellulose Derivatives Industry Revenue (billion) Forecast, by Application 2020 & 2033
- Table 30: United States Cellulose Derivatives Industry Volume (K Tons) Forecast, by Application 2020 & 2033
- Table 31: Mexico Cellulose Derivatives Industry Revenue (billion) Forecast, by Application 2020 & 2033
- Table 32: Mexico Cellulose Derivatives Industry Volume (K Tons) Forecast, by Application 2020 & 2033
- Table 33: Canada Cellulose Derivatives Industry Revenue (billion) Forecast, by Application 2020 & 2033
- Table 34: Canada Cellulose Derivatives Industry Volume (K Tons) Forecast, by Application 2020 & 2033
- Table 35: Global Cellulose Derivatives Industry Revenue billion Forecast, by Chemical Type 2020 & 2033
- Table 36: Global Cellulose Derivatives Industry Volume K Tons Forecast, by Chemical Type 2020 & 2033
- Table 37: Global Cellulose Derivatives Industry Revenue billion Forecast, by End-user Industry 2020 & 2033
- Table 38: Global Cellulose Derivatives Industry Volume K Tons Forecast, by End-user Industry 2020 & 2033
- Table 39: Global Cellulose Derivatives Industry Revenue billion Forecast, by Country 2020 & 2033
- Table 40: Global Cellulose Derivatives Industry Volume K Tons Forecast, by Country 2020 & 2033
- Table 41: Germany Cellulose Derivatives Industry Revenue (billion) Forecast, by Application 2020 & 2033
- Table 42: Germany Cellulose Derivatives Industry Volume (K Tons) Forecast, by Application 2020 & 2033
- Table 43: United Kingdom Cellulose Derivatives Industry Revenue (billion) Forecast, by Application 2020 & 2033
- Table 44: United Kingdom Cellulose Derivatives Industry Volume (K Tons) Forecast, by Application 2020 & 2033
- Table 45: Italy Cellulose Derivatives Industry Revenue (billion) Forecast, by Application 2020 & 2033
- Table 46: Italy Cellulose Derivatives Industry Volume (K Tons) Forecast, by Application 2020 & 2033
- Table 47: France Cellulose Derivatives Industry Revenue (billion) Forecast, by Application 2020 & 2033
- Table 48: France Cellulose Derivatives Industry Volume (K Tons) Forecast, by Application 2020 & 2033
- Table 49: Rest of Europe Cellulose Derivatives Industry Revenue (billion) Forecast, by Application 2020 & 2033
- Table 50: Rest of Europe Cellulose Derivatives Industry Volume (K Tons) Forecast, by Application 2020 & 2033
- Table 51: Global Cellulose Derivatives Industry Revenue billion Forecast, by Chemical Type 2020 & 2033
- Table 52: Global Cellulose Derivatives Industry Volume K Tons Forecast, by Chemical Type 2020 & 2033
- Table 53: Global Cellulose Derivatives Industry Revenue billion Forecast, by End-user Industry 2020 & 2033
- Table 54: Global Cellulose Derivatives Industry Volume K Tons Forecast, by End-user Industry 2020 & 2033
- Table 55: Global Cellulose Derivatives Industry Revenue billion Forecast, by Country 2020 & 2033
- Table 56: Global Cellulose Derivatives Industry Volume K Tons Forecast, by Country 2020 & 2033
- Table 57: Brazil Cellulose Derivatives Industry Revenue (billion) Forecast, by Application 2020 & 2033
- Table 58: Brazil Cellulose Derivatives Industry Volume (K Tons) Forecast, by Application 2020 & 2033
- Table 59: Argentina Cellulose Derivatives Industry Revenue (billion) Forecast, by Application 2020 & 2033
- Table 60: Argentina Cellulose Derivatives Industry Volume (K Tons) Forecast, by Application 2020 & 2033
- Table 61: Rest of South America Cellulose Derivatives Industry Revenue (billion) Forecast, by Application 2020 & 2033
- Table 62: Rest of South America Cellulose Derivatives Industry Volume (K Tons) Forecast, by Application 2020 & 2033
- Table 63: Global Cellulose Derivatives Industry Revenue billion Forecast, by Chemical Type 2020 & 2033
- Table 64: Global Cellulose Derivatives Industry Volume K Tons Forecast, by Chemical Type 2020 & 2033
- Table 65: Global Cellulose Derivatives Industry Revenue billion Forecast, by End-user Industry 2020 & 2033
- Table 66: Global Cellulose Derivatives Industry Volume K Tons Forecast, by End-user Industry 2020 & 2033
- Table 67: Global Cellulose Derivatives Industry Revenue billion Forecast, by Country 2020 & 2033
- Table 68: Global Cellulose Derivatives Industry Volume K Tons Forecast, by Country 2020 & 2033
- Table 69: UAE Cellulose Derivatives Industry Revenue (billion) Forecast, by Application 2020 & 2033
- Table 70: UAE Cellulose Derivatives Industry Volume (K Tons) Forecast, by Application 2020 & 2033
- Table 71: Saudi Arabia Cellulose Derivatives Industry Revenue (billion) Forecast, by Application 2020 & 2033
- Table 72: Saudi Arabia Cellulose Derivatives Industry Volume (K Tons) Forecast, by Application 2020 & 2033
- Table 73: South Africa Cellulose Derivatives Industry Revenue (billion) Forecast, by Application 2020 & 2033
- Table 74: South Africa Cellulose Derivatives Industry Volume (K Tons) Forecast, by Application 2020 & 2033
- Table 75: Rest of Middle East & Africa Cellulose Derivatives Industry Revenue (billion) Forecast, by Application 2020 & 2033
- Table 76: Rest of Middle East & Africa Cellulose Derivatives Industry Volume (K Tons) Forecast, by Application 2020 & 2033
Frequently Asked Questions
1. What is the projected Compound Annual Growth Rate (CAGR) of the Cellulose Derivatives Industry?
The projected CAGR is approximately 6.6%.
2. Which companies are prominent players in the Cellulose Derivatives Industry?
Key companies in the market include Nouryon, Mitsubishi Chemical Corporation, Celanese Corporation, Grasim (Aditya Birla Group), Lenzing AG, Futamura Chemical Co Ltd, Ashland, DuPont, Dow, Eastman Chemical Company, Daicel Corporation, FKuR, Sappi Limited, Shin-Etsu Chemical Co Ltd, Xinjiang Zhongtai Chemical Co Ltd, Cerdia International GmbH.
3. What are the main segments of the Cellulose Derivatives Industry?
The market segments include Chemical Type, End-user Industry.
4. Can you provide details about the market size?
The market size is estimated to be USD 6.73 billion as of 2022.
5. What are some drivers contributing to market growth?
Increasing Demand from Pharmaceutical Industry; Increasing Use of Cellulose Ether in Building and Construction Industry; Other Drivers.
6. What are the notable trends driving market growth?
Food and Beverage Industry to Dominate the Market.
7. Are there any restraints impacting market growth?
Competition of Regenerated Cellulose Fibers from Synthetic Fibers and Other Protein-based Fibers; Other Restraints.
8. Can you provide examples of recent developments in the market?
N/A
9. What pricing options are available for accessing the report?
Pricing options include single-user, multi-user, and enterprise licenses priced at USD 4750, USD 5250, and USD 8750 respectively.
10. Is the market size provided in terms of value or volume?
The market size is provided in terms of value, measured in billion and volume, measured in K Tons.
11. Are there any specific market keywords associated with the report?
Yes, the market keyword associated with the report is "Cellulose Derivatives Industry," which aids in identifying and referencing the specific market segment covered.
12. How do I determine which pricing option suits my needs best?
The pricing options vary based on user requirements and access needs. Individual users may opt for single-user licenses, while businesses requiring broader access may choose multi-user or enterprise licenses for cost-effective access to the report.
13. Are there any additional resources or data provided in the Cellulose Derivatives Industry report?
While the report offers comprehensive insights, it's advisable to review the specific contents or supplementary materials provided to ascertain if additional resources or data are available.
14. How can I stay updated on further developments or reports in the Cellulose Derivatives Industry?
To stay informed about further developments, trends, and reports in the Cellulose Derivatives Industry, consider subscribing to industry newsletters, following relevant companies and organizations, or regularly checking reputable industry news sources and publications.
Methodology
Step 1 - Identification of Relevant Samples Size from Population Database


Step 2 - Approaches for Defining Global Market Size (Value, Volume* & Price*)

Note*: In applicable scenarios
Step 3 - Data Sources
Primary Research
- Web Analytics
- Survey Reports
- Research Institute
- Latest Research Reports
- Opinion Leaders
Secondary Research
- Annual Reports
- White Paper
- Latest Press Release
- Industry Association
- Paid Database
- Investor Presentations

Step 4 - Data Triangulation
Involves using different sources of information in order to increase the validity of a study
These sources are likely to be stakeholders in a program - participants, other researchers, program staff, other community members, and so on.
Then we put all data in single framework & apply various statistical tools to find out the dynamic on the market.
During the analysis stage, feedback from the stakeholder groups would be compared to determine areas of agreement as well as areas of divergence