

Key Insights
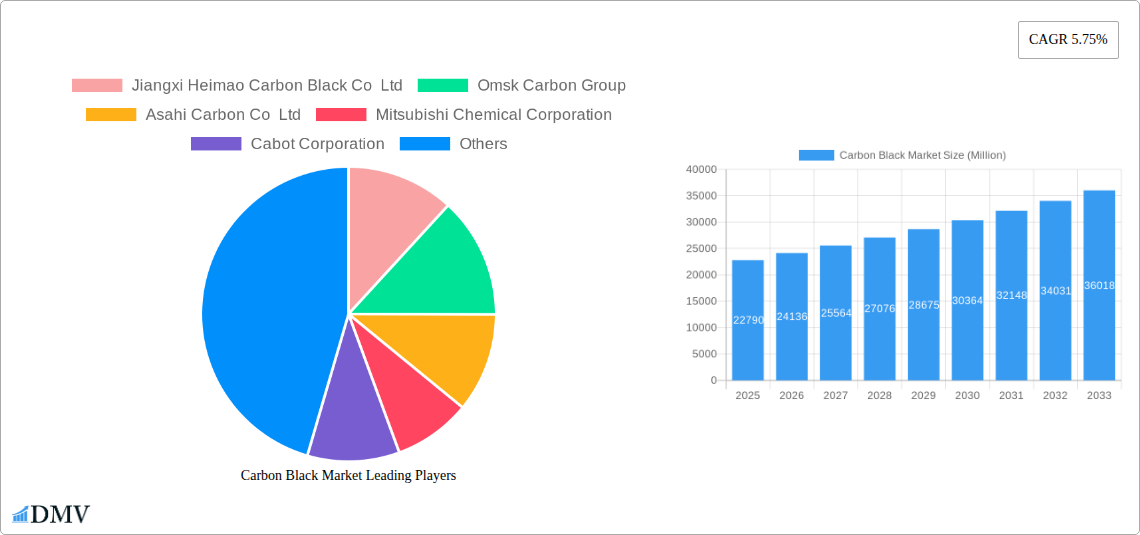
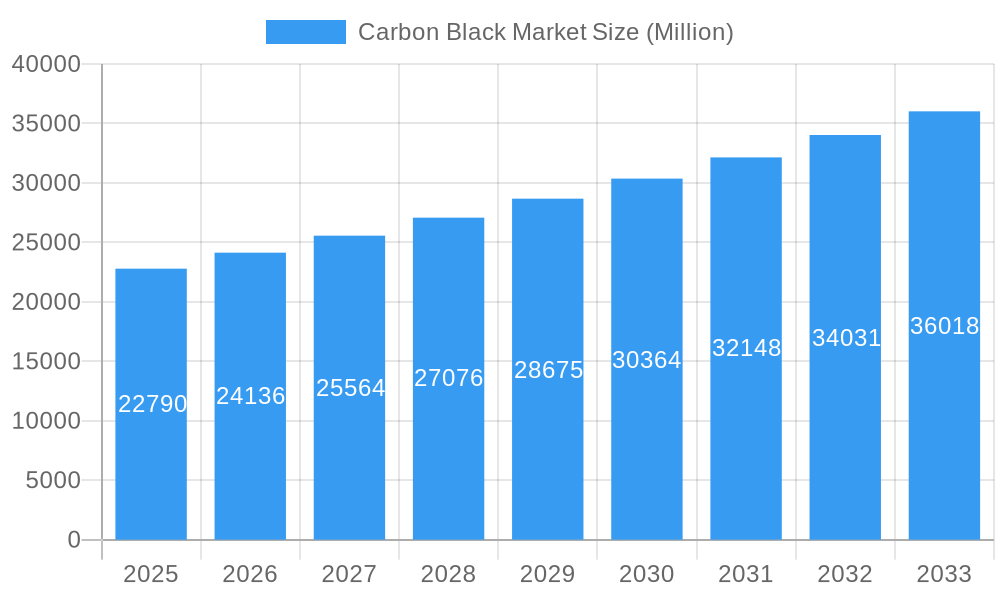
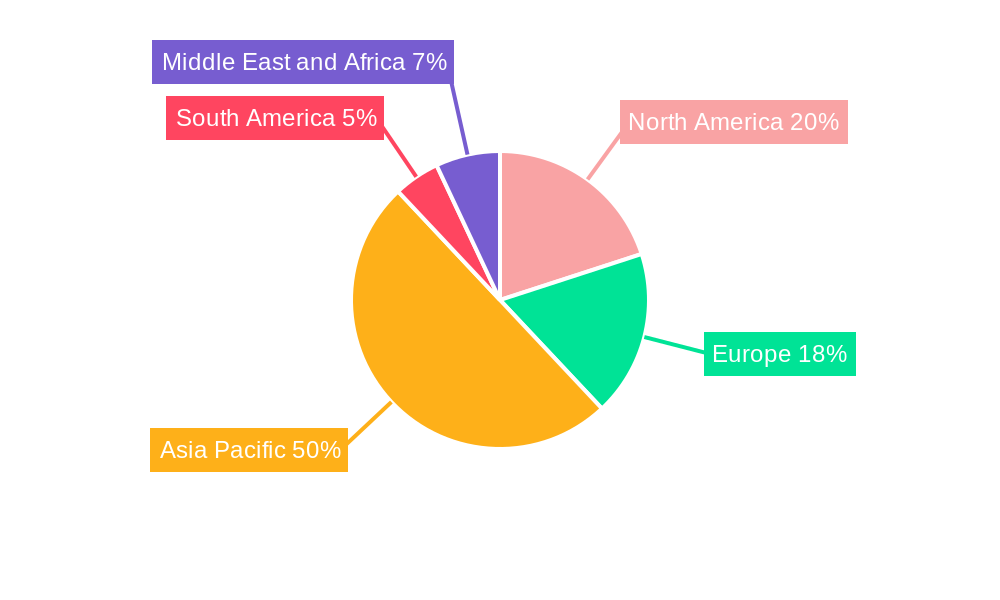
The global carbon black market, valued at $22.79 billion in 2025, is projected to experience robust growth, driven by a compound annual growth rate (CAGR) of 5.75% from 2025 to 2033. This expansion is primarily fueled by the burgeoning tire and rubber industry, where carbon black serves as a crucial reinforcing agent enhancing tire durability and performance. The increasing demand for automobiles globally, coupled with the rising adoption of high-performance tires, significantly contributes to this market segment's growth. Furthermore, the expanding plastics industry, particularly in packaging and consumer goods, fuels demand for carbon black as a pigment and UV stabilizer. Growth in the printing and coatings sectors, requiring carbon black for pigmentation and other functional properties, also boosts market expansion. While fluctuating raw material prices and environmental concerns related to carbon black production pose potential restraints, ongoing innovations in manufacturing processes aimed at improving efficiency and reducing environmental impact are mitigating these challenges. The Asia-Pacific region, particularly China and India, is expected to dominate the market due to rapid industrialization and expanding manufacturing capabilities.
Carbon Black Market Market Size (In Billion)
Specific application segments like tires and industrial rubber products maintain a significant market share, while segments such as toners and printing inks, coatings, and textile fibers are also experiencing noteworthy growth, driven by industrial expansion and evolving consumer preferences. The competitive landscape is characterized by a mix of established global players and regional manufacturers. Major players like Cabot Corporation, Birla Carbon, and Mitsubishi Chemical Corporation are investing heavily in research and development to improve product quality and explore sustainable production methods. The market’s future growth will be shaped by technological advancements, including the development of more sustainable carbon black production methods, and the increasing adoption of high-performance materials across various industries. This will necessitate continuous innovation and adaptation from market players to meet evolving demand and regulatory requirements.
Carbon Black Market Company Market Share
Carbon Black Market: A Comprehensive Report (2019-2033)
This insightful report provides a detailed analysis of the global Carbon Black Market, encompassing market size, segmentation, competitive landscape, and future growth projections from 2019 to 2033. The study period covers the historical period (2019-2024), the base year (2025), and the forecast period (2025-2033), offering a comprehensive view of market dynamics. Valuations are expressed in Millions throughout. This report is crucial for stakeholders seeking to understand the intricacies of this dynamic market and to make informed strategic decisions.
Carbon Black Market Composition & Trends
This section delves into the intricate structure of the carbon black market, analyzing its concentration, innovation drivers, regulatory landscape, substitute products, end-user profiles, and merger & acquisition (M&A) activities. We examine the market share distribution amongst key players, revealing a moderately consolidated market with several major players commanding significant shares. The total market size is estimated at XX Million in 2025.
- Market Concentration: The market exhibits moderate concentration, with the top 5 players holding an estimated XX% market share in 2025.
- Innovation Catalysts: Stringent emission regulations and the rising demand for sustainable materials are driving innovation in carbon black production, leading to the development of more environmentally friendly processes.
- Regulatory Landscape: Government regulations concerning environmental protection and emission standards significantly influence market dynamics and investment decisions.
- Substitute Products: While few direct substitutes exist, advancements in alternative materials are posing some competitive pressure.
- End-User Profiles: The primary end-users are the tire and rubber, plastics, and printing ink industries.
- M&A Activities: Over the period 2019-2024, M&A activity totaled approximately XX Million, with a majority focusing on expanding production capacity and geographic reach. Examples include (specific examples and deal values where available).
Carbon Black Market Industry Evolution
This section provides a comprehensive overview of the carbon black market's evolution, examining growth trajectories, technological advancements, and shifts in consumer demand from 2019-2033. The market has shown consistent growth driven by increasing industrial activity and automotive production. Technological advancements in production processes are expected to further enhance efficiency and reduce environmental impact.
The market experienced a Compound Annual Growth Rate (CAGR) of XX% during the period 2019-2024. This growth is attributed to increased demand from key end-use sectors and continuous technological improvements in production processes. The forecast period (2025-2033) projects a CAGR of XX%, driven by factors such as increasing vehicle production, growth in the construction industry, and rising demand for high-performance tires. Demand from developing economies, particularly in Asia, is expected to contribute significantly to this growth. Adoption of new technologies like advanced furnace black production methods is expected to reach XX% by 2033.
Leading Regions, Countries, or Segments in Carbon Black Market
This section identifies the leading regions, countries, and segments within the carbon black market. Analysis focuses on both Process Type (Furnace Black, Gas Black, Lamp Black, Thermal Black) and Application (Tires and Industrial Rubber Products, Plastics, Toners and Printing Inks, Coatings, Textile Fiber, Other Applications).
- Dominant Segment: Furnace black consistently dominates the market due to its superior properties and cost-effectiveness, accounting for approximately XX% of the market share in 2025.
- Key Drivers (By Region/Segment):
- Asia-Pacific: Rapid industrialization and automotive production growth in countries like China and India are major drivers. Government investments in infrastructure projects further fuel demand.
- North America: Demand is largely driven by the automotive and tire industries, with a focus on high-performance materials.
- Europe: Stringent environmental regulations are driving innovation towards more sustainable production methods.
- Dominant Application: The Tires and Industrial Rubber Products segment holds the largest market share, exceeding XX% in 2025, followed by Plastics.
The dominance of these regions and segments is attributable to several factors, including robust industrial growth, favorable government policies, and the presence of major manufacturers.
Carbon Black Market Product Innovations
Recent innovations focus on developing carbon blacks with improved performance characteristics, such as enhanced conductivity, dispersion, and durability. This involves creating specialized grades for specific applications, as well as enhancing the sustainability profile of production processes to reduce environmental impact. For instance, several manufacturers are investing in technologies that reduce energy consumption and emissions during production. These innovations lead to improved product performance, better cost-efficiency, and greater environmental sustainability.
Propelling Factors for Carbon Black Market Growth
Several factors drive the growth of the carbon black market. Technological advancements, such as improved production processes leading to higher quality and lower costs, are key drivers. The expanding automotive sector and increasing demand for tires and other rubber products significantly contribute to market growth. Furthermore, favorable government policies supporting infrastructure development and industrial growth further propel the market. Economic growth, particularly in developing countries, fuels this demand.
Obstacles in the Carbon Black Market
The carbon black market faces several challenges. Fluctuations in raw material prices, especially oil, impact production costs and profitability. Supply chain disruptions, especially those related to raw material sourcing and transportation, can lead to production delays and reduced availability. Stringent environmental regulations necessitate investments in cleaner production technologies, potentially increasing operational costs. Intense competition among major players also puts pressure on pricing and profitability.
Future Opportunities in Carbon Black Market
Emerging opportunities lie in the development of sustainable and high-performance carbon blacks for specialized applications. The rising demand for electric vehicles and other green technologies creates opportunities for carbon blacks with enhanced conductivity and other specialized properties. Expanding into new markets, particularly in developing economies, presents significant growth potential. Innovation in production methods to reduce environmental footprint and enhance sustainability offer further growth potential.
Major Players in the Carbon Black Market Ecosystem
- Jiangxi Heimao Carbon Black Co Ltd
- Omsk Carbon Group
- Asahi Carbon Co Ltd
- Mitsubishi Chemical Corporation
- Cabot Corporation
- Epsilon Carbon Private Limited
- NNPC Limited
- Himadri Speciality Chemical Ltd
- ADNOC Group
- Longxing Chemical Stock Co Ltd
- PCBL Limited
- International CSRC Investment Holdings Co Ltd
- Imerys SA
- Tokai Carbon Co Ltd
- OCI Company Ltd
- BKT Carbon
- Orion Engineered Carbons SA
- Birla Carbon (Aditya Birla Group)
Key Developments in Carbon Black Market Industry
- June 2023: PCBL Limited announced two expansion projects, boosting its capacity to 790,000 MTPA and incorporating 122 MW of renewable energy.
- February 2023: BKT increased its carbon black production capacity by approximately 20%, expanding its Bhuj plant to produce an additional 198 kilotons per year.
- June 2022: ADNOC Distribution signed a supply agreement with ADNOC to explore market opportunities for carbon black.
These developments highlight the ongoing investments and expansion within the carbon black industry, indicating continued growth and market dynamism.
Strategic Carbon Black Market Forecast
The carbon black market is poised for robust growth driven by sustained demand from key end-use sectors and technological advancements in production processes. Future opportunities lie in specialized applications and sustainable production methods, along with expansion into emerging markets. The market's future is bright, promising strong growth and significant value creation for stakeholders.
Carbon Black Market Segmentation
-
1. Process Type
- 1.1. Furnace Black
- 1.2. Gas Black
- 1.3. Lamp Black
- 1.4. Thermal Black
-
2. Application
- 2.1. Tires and Industrial Rubber Products
- 2.2. Plastic
- 2.3. Toners and Printing Inks
- 2.4. Coatings
- 2.5. Textile Fiber
- 2.6. Other Applications
Carbon Black Market Segmentation By Geography
-
1. Asia Pacific
- 1.1. China
- 1.2. India
- 1.3. Japan
- 1.4. South Korea
- 1.5. Rest of Asia Pacific
-
2. North America
- 2.1. United States
- 2.2. Canada
- 2.3. Mexico
-
3. Europe
- 3.1. Germany
- 3.2. United Kingdom
- 3.3. Italy
- 3.4. France
- 3.5. Rest of Europe
-
4. South America
- 4.1. Brazil
- 4.2. Argentina
- 4.3. Rest of South America
-
5. Middle East and Africa
- 5.1. Saudi Arabia
- 5.2. South Africa
- 5.3. United Arab Emirates
- 5.4. Rest of Middle East and Africa
Carbon Black Market Regional Market Share
Geographic Coverage of Carbon Black Market
Carbon Black Market REPORT HIGHLIGHTS
| Aspects | Details |
|---|---|
| Study Period | 2020-2034 |
| Base Year | 2025 |
| Estimated Year | 2026 |
| Forecast Period | 2026-2034 |
| Historical Period | 2020-2025 |
| Growth Rate | CAGR of 5.75% from 2020-2034 |
| Segmentation |
|
Table of Contents
- 1. Introduction
- 1.1. Research Scope
- 1.2. Market Segmentation
- 1.3. Research Objective
- 1.4. Definitions and Assumptions
- 2. Executive Summary
- 2.1. Market Snapshot
- 3. Market Dynamics
- 3.1. Market Drivers
- 3.2. Market Restrains
- 3.3. Market Trends
- 3.4. Market Opportunities
- 4. Market Factor Analysis
- 4.1. Porters Five Forces
- 4.1.1. Bargaining Power of Suppliers
- 4.1.2. Bargaining Power of Buyers
- 4.1.3. Threat of New Entrants
- 4.1.4. Threat of Substitutes
- 4.1.5. Competitive Rivalry
- 4.2. PESTEL analysis
- 4.3. BCG Analysis
- 4.3.1. Stars (High Growth, High Market Share)
- 4.3.2. Cash Cows (Low Growth, High Market Share)
- 4.3.3. Question Mark (High Growth, Low Market Share)
- 4.3.4. Dogs (Low Growth, Low Market Share)
- 4.4. Ansoff Matrix Analysis
- 4.5. Supply Chain Analysis
- 4.6. Regulatory Landscape
- 4.7. Current Market Potential and Opportunity Assessment (TAM–SAM–SOM Framework)
- 4.8. DMV Analyst Note
- 4.1. Porters Five Forces
- 5. Market Analysis, Insights and Forecast 2021-2033
- 5.1. Market Analysis, Insights and Forecast - by Process Type
- 5.1.1. Furnace Black
- 5.1.2. Gas Black
- 5.1.3. Lamp Black
- 5.1.4. Thermal Black
- 5.2. Market Analysis, Insights and Forecast - by Application
- 5.2.1. Tires and Industrial Rubber Products
- 5.2.2. Plastic
- 5.2.3. Toners and Printing Inks
- 5.2.4. Coatings
- 5.2.5. Textile Fiber
- 5.2.6. Other Applications
- 5.3. Market Analysis, Insights and Forecast - by Region
- 5.3.1. Asia Pacific
- 5.3.2. North America
- 5.3.3. Europe
- 5.3.4. South America
- 5.3.5. Middle East and Africa
- 5.1. Market Analysis, Insights and Forecast - by Process Type
- 6. Global Carbon Black Market Analysis, Insights and Forecast, 2021-2033
- 6.1. Market Analysis, Insights and Forecast - by Process Type
- 6.1.1. Furnace Black
- 6.1.2. Gas Black
- 6.1.3. Lamp Black
- 6.1.4. Thermal Black
- 6.2. Market Analysis, Insights and Forecast - by Application
- 6.2.1. Tires and Industrial Rubber Products
- 6.2.2. Plastic
- 6.2.3. Toners and Printing Inks
- 6.2.4. Coatings
- 6.2.5. Textile Fiber
- 6.2.6. Other Applications
- 6.1. Market Analysis, Insights and Forecast - by Process Type
- 7. Asia Pacific Carbon Black Market Analysis, Insights and Forecast, 2020-2032
- 7.1. Market Analysis, Insights and Forecast - by Process Type
- 7.1.1. Furnace Black
- 7.1.2. Gas Black
- 7.1.3. Lamp Black
- 7.1.4. Thermal Black
- 7.2. Market Analysis, Insights and Forecast - by Application
- 7.2.1. Tires and Industrial Rubber Products
- 7.2.2. Plastic
- 7.2.3. Toners and Printing Inks
- 7.2.4. Coatings
- 7.2.5. Textile Fiber
- 7.2.6. Other Applications
- 7.1. Market Analysis, Insights and Forecast - by Process Type
- 8. North America Carbon Black Market Analysis, Insights and Forecast, 2020-2032
- 8.1. Market Analysis, Insights and Forecast - by Process Type
- 8.1.1. Furnace Black
- 8.1.2. Gas Black
- 8.1.3. Lamp Black
- 8.1.4. Thermal Black
- 8.2. Market Analysis, Insights and Forecast - by Application
- 8.2.1. Tires and Industrial Rubber Products
- 8.2.2. Plastic
- 8.2.3. Toners and Printing Inks
- 8.2.4. Coatings
- 8.2.5. Textile Fiber
- 8.2.6. Other Applications
- 8.1. Market Analysis, Insights and Forecast - by Process Type
- 9. Europe Carbon Black Market Analysis, Insights and Forecast, 2020-2032
- 9.1. Market Analysis, Insights and Forecast - by Process Type
- 9.1.1. Furnace Black
- 9.1.2. Gas Black
- 9.1.3. Lamp Black
- 9.1.4. Thermal Black
- 9.2. Market Analysis, Insights and Forecast - by Application
- 9.2.1. Tires and Industrial Rubber Products
- 9.2.2. Plastic
- 9.2.3. Toners and Printing Inks
- 9.2.4. Coatings
- 9.2.5. Textile Fiber
- 9.2.6. Other Applications
- 9.1. Market Analysis, Insights and Forecast - by Process Type
- 10. South America Carbon Black Market Analysis, Insights and Forecast, 2020-2032
- 10.1. Market Analysis, Insights and Forecast - by Process Type
- 10.1.1. Furnace Black
- 10.1.2. Gas Black
- 10.1.3. Lamp Black
- 10.1.4. Thermal Black
- 10.2. Market Analysis, Insights and Forecast - by Application
- 10.2.1. Tires and Industrial Rubber Products
- 10.2.2. Plastic
- 10.2.3. Toners and Printing Inks
- 10.2.4. Coatings
- 10.2.5. Textile Fiber
- 10.2.6. Other Applications
- 10.1. Market Analysis, Insights and Forecast - by Process Type
- 11. Middle East and Africa Carbon Black Market Analysis, Insights and Forecast, 2020-2032
- 11.1. Market Analysis, Insights and Forecast - by Process Type
- 11.1.1. Furnace Black
- 11.1.2. Gas Black
- 11.1.3. Lamp Black
- 11.1.4. Thermal Black
- 11.2. Market Analysis, Insights and Forecast - by Application
- 11.2.1. Tires and Industrial Rubber Products
- 11.2.2. Plastic
- 11.2.3. Toners and Printing Inks
- 11.2.4. Coatings
- 11.2.5. Textile Fiber
- 11.2.6. Other Applications
- 11.1. Market Analysis, Insights and Forecast - by Process Type
- 12. Competitive Analysis
- 12.1. Company Profiles
- 12.1.1 Jiangxi Heimao Carbon Black Co Ltd
- 12.1.1.1. Company Overview
- 12.1.1.2. Products
- 12.1.1.3. Company Financials
- 12.1.1.4. SWOT Analysis
- 12.1.2 Omsk Carbon Group
- 12.1.2.1. Company Overview
- 12.1.2.2. Products
- 12.1.2.3. Company Financials
- 12.1.2.4. SWOT Analysis
- 12.1.3 Asahi Carbon Co Ltd
- 12.1.3.1. Company Overview
- 12.1.3.2. Products
- 12.1.3.3. Company Financials
- 12.1.3.4. SWOT Analysis
- 12.1.4 Mitsubishi Chemical Corporation
- 12.1.4.1. Company Overview
- 12.1.4.2. Products
- 12.1.4.3. Company Financials
- 12.1.4.4. SWOT Analysis
- 12.1.5 Cabot Corporation
- 12.1.5.1. Company Overview
- 12.1.5.2. Products
- 12.1.5.3. Company Financials
- 12.1.5.4. SWOT Analysis
- 12.1.6 Epsilon Carbon Private Limited
- 12.1.6.1. Company Overview
- 12.1.6.2. Products
- 12.1.6.3. Company Financials
- 12.1.6.4. SWOT Analysis
- 12.1.7 NNPC Limited
- 12.1.7.1. Company Overview
- 12.1.7.2. Products
- 12.1.7.3. Company Financials
- 12.1.7.4. SWOT Analysis
- 12.1.8 Himadri Speciality Chemical Ltd
- 12.1.8.1. Company Overview
- 12.1.8.2. Products
- 12.1.8.3. Company Financials
- 12.1.8.4. SWOT Analysis
- 12.1.9 ADNOC Group
- 12.1.9.1. Company Overview
- 12.1.9.2. Products
- 12.1.9.3. Company Financials
- 12.1.9.4. SWOT Analysis
- 12.1.10 Longxing Chemical Stock Co Ltd
- 12.1.10.1. Company Overview
- 12.1.10.2. Products
- 12.1.10.3. Company Financials
- 12.1.10.4. SWOT Analysis
- 12.1.11 PCBL Limited
- 12.1.11.1. Company Overview
- 12.1.11.2. Products
- 12.1.11.3. Company Financials
- 12.1.11.4. SWOT Analysis
- 12.1.12 International CSRC Investment Holdings Co Ltd
- 12.1.12.1. Company Overview
- 12.1.12.2. Products
- 12.1.12.3. Company Financials
- 12.1.12.4. SWOT Analysis
- 12.1.13 Imerys SA
- 12.1.13.1. Company Overview
- 12.1.13.2. Products
- 12.1.13.3. Company Financials
- 12.1.13.4. SWOT Analysis
- 12.1.14 Tokai Carbon Co Ltd*List Not Exhaustive
- 12.1.14.1. Company Overview
- 12.1.14.2. Products
- 12.1.14.3. Company Financials
- 12.1.14.4. SWOT Analysis
- 12.1.15 OCI Company Ltd
- 12.1.15.1. Company Overview
- 12.1.15.2. Products
- 12.1.15.3. Company Financials
- 12.1.15.4. SWOT Analysis
- 12.1.16 BKT Carbon
- 12.1.16.1. Company Overview
- 12.1.16.2. Products
- 12.1.16.3. Company Financials
- 12.1.16.4. SWOT Analysis
- 12.1.17 Orion Engineered Carbons SA
- 12.1.17.1. Company Overview
- 12.1.17.2. Products
- 12.1.17.3. Company Financials
- 12.1.17.4. SWOT Analysis
- 12.1.18 Birla Carbon (Aditya Birla Group)
- 12.1.18.1. Company Overview
- 12.1.18.2. Products
- 12.1.18.3. Company Financials
- 12.1.18.4. SWOT Analysis
- 12.1.1 Jiangxi Heimao Carbon Black Co Ltd
- 12.2. Market Entropy
- 12.2.1 Company's Key Areas Served
- 12.2.2 Recent Developments
- 12.3. Company Market Share Analysis 2025
- 12.3.1 Top 5 Companies Market Share Analysis
- 12.3.2 Top 3 Companies Market Share Analysis
- 12.4. List of Potential Customers
- 13. Research Methodology
List of Figures
- Figure 1: Global Carbon Black Market Revenue Breakdown (Million, %) by Region 2025 & 2033
- Figure 2: Asia Pacific Carbon Black Market Revenue (Million), by Process Type 2025 & 2033
- Figure 3: Asia Pacific Carbon Black Market Revenue Share (%), by Process Type 2025 & 2033
- Figure 4: Asia Pacific Carbon Black Market Revenue (Million), by Application 2025 & 2033
- Figure 5: Asia Pacific Carbon Black Market Revenue Share (%), by Application 2025 & 2033
- Figure 6: Asia Pacific Carbon Black Market Revenue (Million), by Country 2025 & 2033
- Figure 7: Asia Pacific Carbon Black Market Revenue Share (%), by Country 2025 & 2033
- Figure 8: North America Carbon Black Market Revenue (Million), by Process Type 2025 & 2033
- Figure 9: North America Carbon Black Market Revenue Share (%), by Process Type 2025 & 2033
- Figure 10: North America Carbon Black Market Revenue (Million), by Application 2025 & 2033
- Figure 11: North America Carbon Black Market Revenue Share (%), by Application 2025 & 2033
- Figure 12: North America Carbon Black Market Revenue (Million), by Country 2025 & 2033
- Figure 13: North America Carbon Black Market Revenue Share (%), by Country 2025 & 2033
- Figure 14: Europe Carbon Black Market Revenue (Million), by Process Type 2025 & 2033
- Figure 15: Europe Carbon Black Market Revenue Share (%), by Process Type 2025 & 2033
- Figure 16: Europe Carbon Black Market Revenue (Million), by Application 2025 & 2033
- Figure 17: Europe Carbon Black Market Revenue Share (%), by Application 2025 & 2033
- Figure 18: Europe Carbon Black Market Revenue (Million), by Country 2025 & 2033
- Figure 19: Europe Carbon Black Market Revenue Share (%), by Country 2025 & 2033
- Figure 20: South America Carbon Black Market Revenue (Million), by Process Type 2025 & 2033
- Figure 21: South America Carbon Black Market Revenue Share (%), by Process Type 2025 & 2033
- Figure 22: South America Carbon Black Market Revenue (Million), by Application 2025 & 2033
- Figure 23: South America Carbon Black Market Revenue Share (%), by Application 2025 & 2033
- Figure 24: South America Carbon Black Market Revenue (Million), by Country 2025 & 2033
- Figure 25: South America Carbon Black Market Revenue Share (%), by Country 2025 & 2033
- Figure 26: Middle East and Africa Carbon Black Market Revenue (Million), by Process Type 2025 & 2033
- Figure 27: Middle East and Africa Carbon Black Market Revenue Share (%), by Process Type 2025 & 2033
- Figure 28: Middle East and Africa Carbon Black Market Revenue (Million), by Application 2025 & 2033
- Figure 29: Middle East and Africa Carbon Black Market Revenue Share (%), by Application 2025 & 2033
- Figure 30: Middle East and Africa Carbon Black Market Revenue (Million), by Country 2025 & 2033
- Figure 31: Middle East and Africa Carbon Black Market Revenue Share (%), by Country 2025 & 2033
List of Tables
- Table 1: Global Carbon Black Market Revenue Million Forecast, by Process Type 2020 & 2033
- Table 2: Global Carbon Black Market Revenue Million Forecast, by Application 2020 & 2033
- Table 3: Global Carbon Black Market Revenue Million Forecast, by Region 2020 & 2033
- Table 4: Global Carbon Black Market Revenue Million Forecast, by Process Type 2020 & 2033
- Table 5: Global Carbon Black Market Revenue Million Forecast, by Application 2020 & 2033
- Table 6: Global Carbon Black Market Revenue Million Forecast, by Country 2020 & 2033
- Table 7: China Carbon Black Market Revenue (Million) Forecast, by Application 2020 & 2033
- Table 8: India Carbon Black Market Revenue (Million) Forecast, by Application 2020 & 2033
- Table 9: Japan Carbon Black Market Revenue (Million) Forecast, by Application 2020 & 2033
- Table 10: South Korea Carbon Black Market Revenue (Million) Forecast, by Application 2020 & 2033
- Table 11: Rest of Asia Pacific Carbon Black Market Revenue (Million) Forecast, by Application 2020 & 2033
- Table 12: Global Carbon Black Market Revenue Million Forecast, by Process Type 2020 & 2033
- Table 13: Global Carbon Black Market Revenue Million Forecast, by Application 2020 & 2033
- Table 14: Global Carbon Black Market Revenue Million Forecast, by Country 2020 & 2033
- Table 15: United States Carbon Black Market Revenue (Million) Forecast, by Application 2020 & 2033
- Table 16: Canada Carbon Black Market Revenue (Million) Forecast, by Application 2020 & 2033
- Table 17: Mexico Carbon Black Market Revenue (Million) Forecast, by Application 2020 & 2033
- Table 18: Global Carbon Black Market Revenue Million Forecast, by Process Type 2020 & 2033
- Table 19: Global Carbon Black Market Revenue Million Forecast, by Application 2020 & 2033
- Table 20: Global Carbon Black Market Revenue Million Forecast, by Country 2020 & 2033
- Table 21: Germany Carbon Black Market Revenue (Million) Forecast, by Application 2020 & 2033
- Table 22: United Kingdom Carbon Black Market Revenue (Million) Forecast, by Application 2020 & 2033
- Table 23: Italy Carbon Black Market Revenue (Million) Forecast, by Application 2020 & 2033
- Table 24: France Carbon Black Market Revenue (Million) Forecast, by Application 2020 & 2033
- Table 25: Rest of Europe Carbon Black Market Revenue (Million) Forecast, by Application 2020 & 2033
- Table 26: Global Carbon Black Market Revenue Million Forecast, by Process Type 2020 & 2033
- Table 27: Global Carbon Black Market Revenue Million Forecast, by Application 2020 & 2033
- Table 28: Global Carbon Black Market Revenue Million Forecast, by Country 2020 & 2033
- Table 29: Brazil Carbon Black Market Revenue (Million) Forecast, by Application 2020 & 2033
- Table 30: Argentina Carbon Black Market Revenue (Million) Forecast, by Application 2020 & 2033
- Table 31: Rest of South America Carbon Black Market Revenue (Million) Forecast, by Application 2020 & 2033
- Table 32: Global Carbon Black Market Revenue Million Forecast, by Process Type 2020 & 2033
- Table 33: Global Carbon Black Market Revenue Million Forecast, by Application 2020 & 2033
- Table 34: Global Carbon Black Market Revenue Million Forecast, by Country 2020 & 2033
- Table 35: Saudi Arabia Carbon Black Market Revenue (Million) Forecast, by Application 2020 & 2033
- Table 36: South Africa Carbon Black Market Revenue (Million) Forecast, by Application 2020 & 2033
- Table 37: United Arab Emirates Carbon Black Market Revenue (Million) Forecast, by Application 2020 & 2033
- Table 38: Rest of Middle East and Africa Carbon Black Market Revenue (Million) Forecast, by Application 2020 & 2033
Frequently Asked Questions
1. What is the projected Compound Annual Growth Rate (CAGR) of the Carbon Black Market?
The projected CAGR is approximately 5.75%.
2. Which companies are prominent players in the Carbon Black Market?
Key companies in the market include Jiangxi Heimao Carbon Black Co Ltd, Omsk Carbon Group, Asahi Carbon Co Ltd, Mitsubishi Chemical Corporation, Cabot Corporation, Epsilon Carbon Private Limited, NNPC Limited, Himadri Speciality Chemical Ltd, ADNOC Group, Longxing Chemical Stock Co Ltd, PCBL Limited, International CSRC Investment Holdings Co Ltd, Imerys SA, Tokai Carbon Co Ltd*List Not Exhaustive, OCI Company Ltd, BKT Carbon, Orion Engineered Carbons SA, Birla Carbon (Aditya Birla Group).
3. What are the main segments of the Carbon Black Market?
The market segments include Process Type, Application.
4. Can you provide details about the market size?
The market size is estimated to be USD 22.79 Million as of 2022.
5. What are some drivers contributing to market growth?
Increasing Market Penetration of Specialty Black; Growing Applications in the Batteries Segment.
6. What are the notable trends driving market growth?
Increasing Application of Tires and Industrial Rubber Products.
7. Are there any restraints impacting market growth?
Increasing Investments for Recovered Carbon Black; Volatility in Prices of Raw Materials.
8. Can you provide examples of recent developments in the market?
June 2023: PCBL Limited initiated two growth projects which incorporate the new plant expansion in Chennai, Tamil Nadu, and an existing plant project at Mundra, Gujarat. This expansion is divided into two stages, and the first stage of the specialty chemical line is expected to be put into operation by the first quarter of the fiscal year 2023-24. As a result, the overall manufacturing capacity of the company is estimated to reach 790,000 MTPA and 122 MW of renewable energy.
9. What pricing options are available for accessing the report?
Pricing options include single-user, multi-user, and enterprise licenses priced at USD 4750, USD 5250, and USD 8750 respectively.
10. Is the market size provided in terms of value or volume?
The market size is provided in terms of value, measured in Million.
11. Are there any specific market keywords associated with the report?
Yes, the market keyword associated with the report is "Carbon Black Market," which aids in identifying and referencing the specific market segment covered.
12. How do I determine which pricing option suits my needs best?
The pricing options vary based on user requirements and access needs. Individual users may opt for single-user licenses, while businesses requiring broader access may choose multi-user or enterprise licenses for cost-effective access to the report.
13. Are there any additional resources or data provided in the Carbon Black Market report?
While the report offers comprehensive insights, it's advisable to review the specific contents or supplementary materials provided to ascertain if additional resources or data are available.
14. How can I stay updated on further developments or reports in the Carbon Black Market?
To stay informed about further developments, trends, and reports in the Carbon Black Market, consider subscribing to industry newsletters, following relevant companies and organizations, or regularly checking reputable industry news sources and publications.
Methodology
Step 1 - Identification of Relevant Samples Size from Population Database


Step 2 - Approaches for Defining Global Market Size (Value, Volume* & Price*)

Note*: In applicable scenarios
Step 3 - Data Sources
Primary Research
- Web Analytics
- Survey Reports
- Research Institute
- Latest Research Reports
- Opinion Leaders
Secondary Research
- Annual Reports
- White Paper
- Latest Press Release
- Industry Association
- Paid Database
- Investor Presentations

Step 4 - Data Triangulation
Involves using different sources of information in order to increase the validity of a study
These sources are likely to be stakeholders in a program - participants, other researchers, program staff, other community members, and so on.
Then we put all data in single framework & apply various statistical tools to find out the dynamic on the market.
During the analysis stage, feedback from the stakeholder groups would be compared to determine areas of agreement as well as areas of divergence