

Key Insights
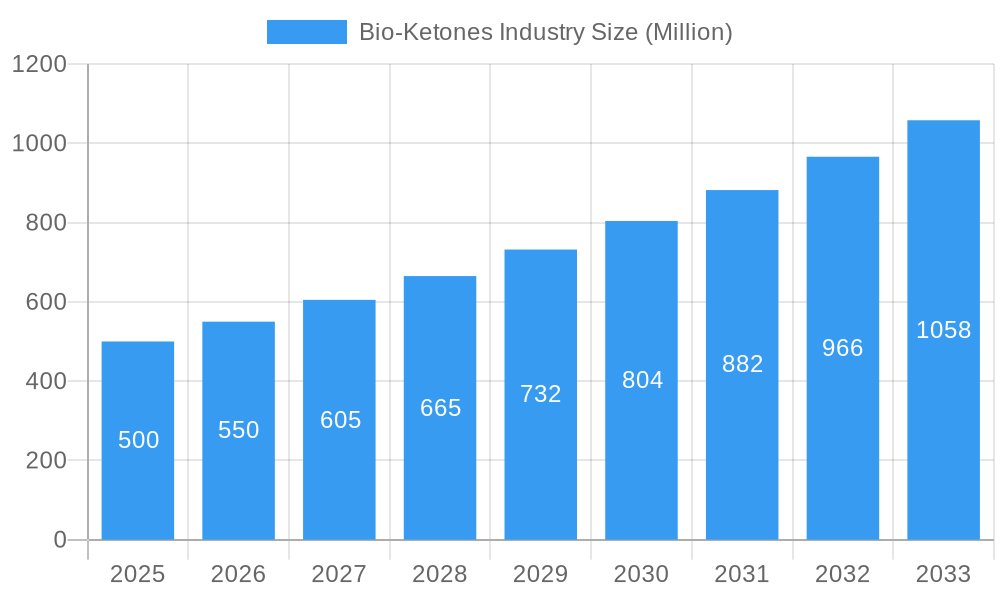
The bio-ketones market is poised for significant expansion, driven by escalating demand for sustainable, naturally derived ingredients across diverse industries. The market is projected to achieve a Compound Annual Growth Rate (CAGR) of 5.9%, expanding from a market size of 24.25 billion in the base year 2025. This growth is propelled by several factors: increasing consumer preference for natural and healthy products in the food and beverage sector, the rising utilization of bio-based materials in cosmetics and personal care, and the growing adoption of bio-ketones as eco-friendly alternatives in industrial applications. The market is segmented by type, including acetoacetate and beta-hydroxybutyrate; application, such as food & beverage, cosmetics, pharmaceuticals, and industrial chemicals; and by geography. Key industry players, including Bio Brands LLC, Caldic B.V., Eastman Chemical Company, and Genomatica Inc., are actively shaping market dynamics through innovation and strategic collaborations. Key challenges include higher production costs compared to petrochemical alternatives and the necessity for continued research and development to enhance efficiency and reduce expenses. The forecast period (2025-2033) anticipates sustained growth, with emerging applications and technological advancements likely to foster further market segmentation.
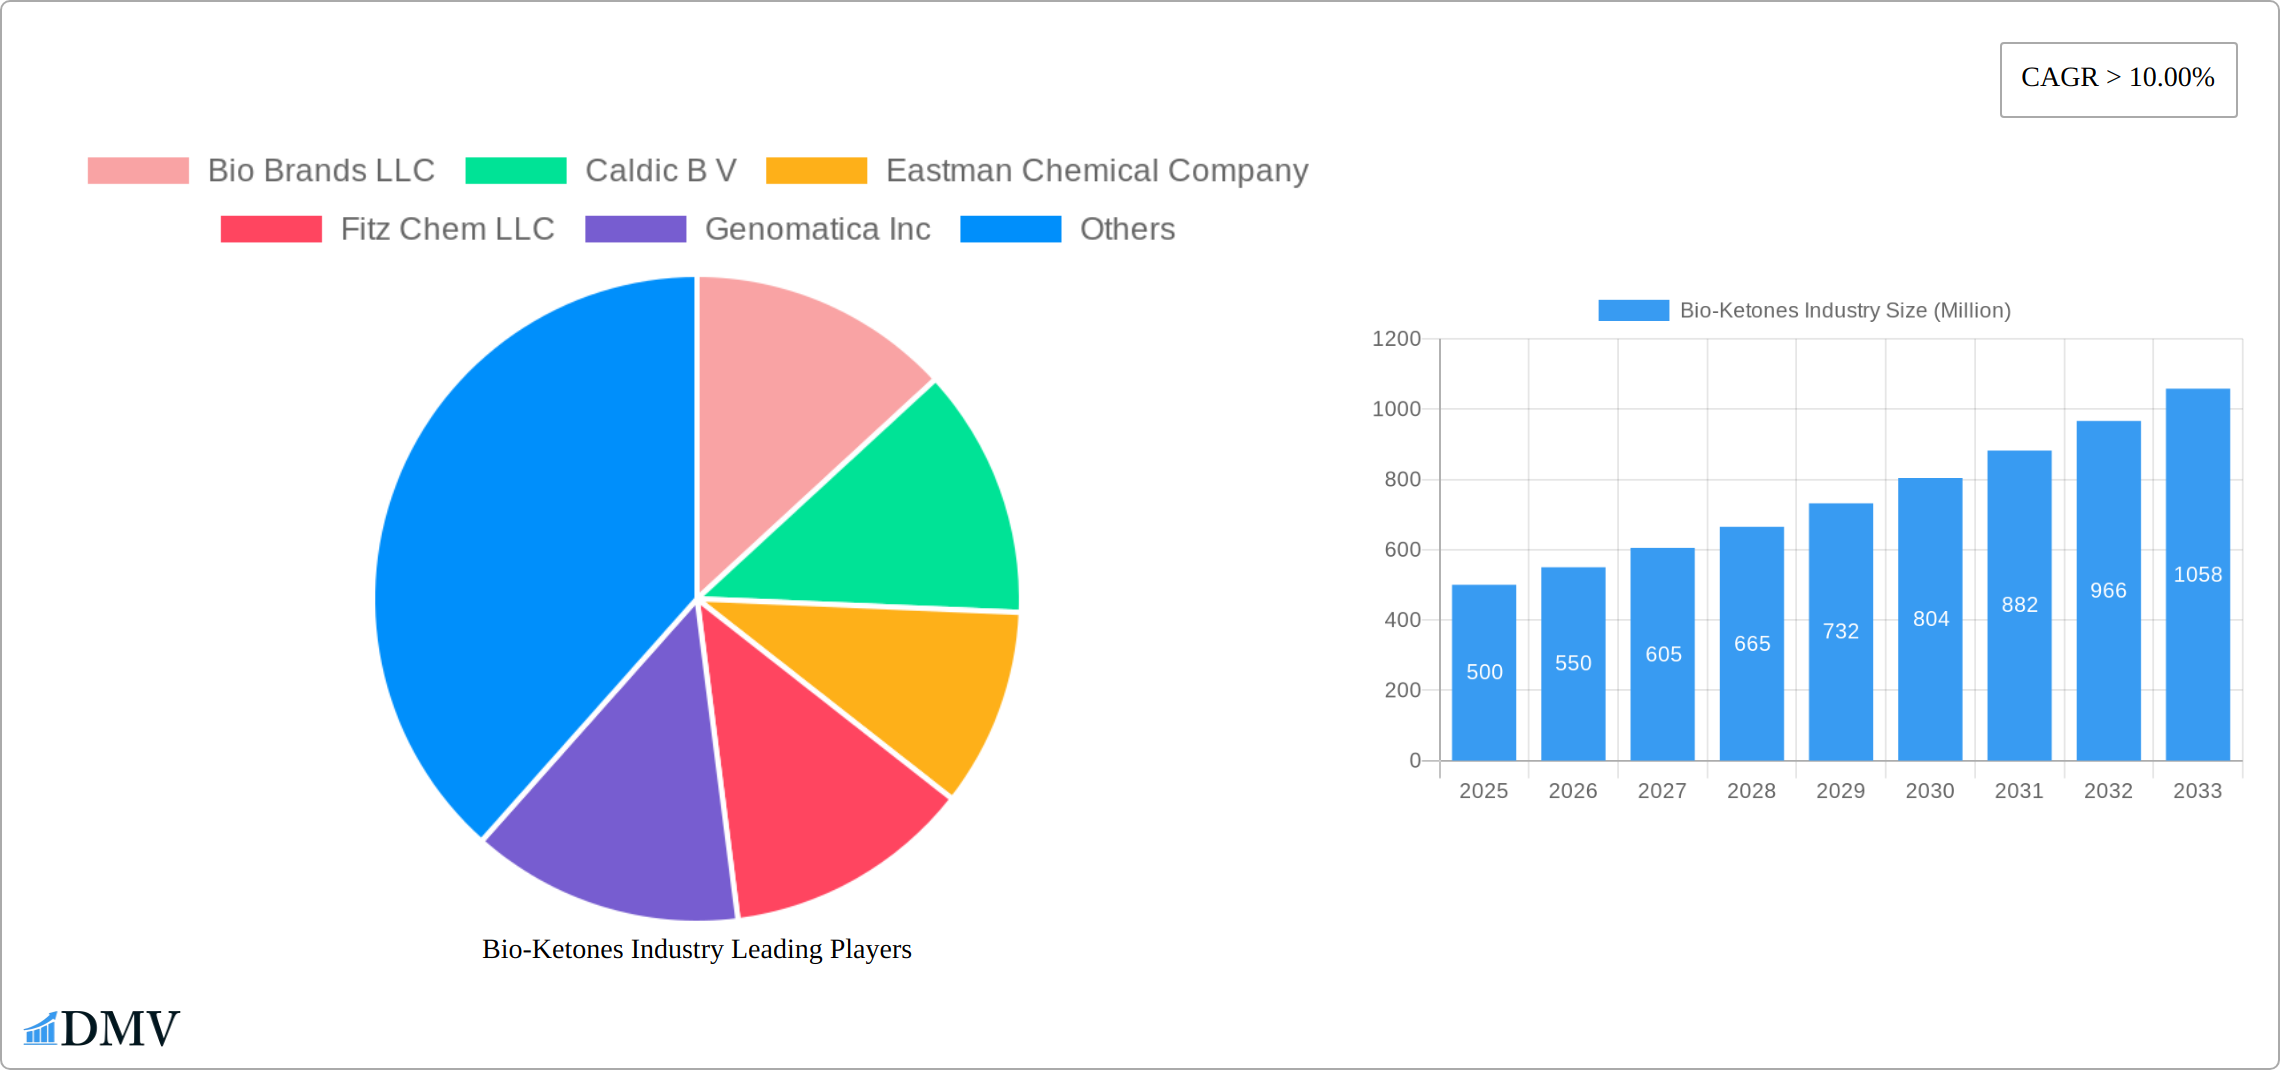
Bio-Ketones Industry Market Size (In Billion)
Advancements in biotechnology are expected to further influence the bio-ketones market, leading to improved production processes and reduced costs. Government initiatives promoting sustainability are also anticipated to stimulate market growth. Expanded penetration into new applications, particularly in emerging economies, presents considerable opportunities for expansion. However, potential market restraints include volatility in raw material pricing and a competitive landscape featuring both established chemical corporations and nascent biotechnology firms. Continuous innovation and strategic partnerships will be crucial for companies to maintain competitive advantage and secure substantial market share. A comprehensive regional analysis would illuminate variations in market penetration across different geographical areas, influenced by regional consumer preferences and regulatory frameworks.
Bio-Ketones Industry Company Market Share
Bio-Ketones Industry Market Report: 2019-2033 - A Comprehensive Analysis
This insightful report provides a comprehensive analysis of the Bio-Ketones industry, offering a detailed overview of market dynamics, key players, and future growth prospects. Covering the period from 2019 to 2033, with a base year of 2025 and a forecast period from 2025 to 2033, this report is essential for stakeholders seeking to understand and capitalize on opportunities within this rapidly evolving sector. The global Bio-Ketones market is projected to reach xx Million by 2033, exhibiting a robust CAGR of xx% during the forecast period.
Bio-Ketones Industry Market Composition & Trends
This section delves into the competitive landscape of the Bio-Ketones market, analyzing market concentration, innovation drivers, regulatory frameworks, substitute products, end-user profiles, and merger & acquisition (M&A) activities. The market is currently characterized by a moderately concentrated structure, with key players like Bio Brands LLC, Eastman Chemical Company, and Genomatica Inc. holding significant market share. However, the emergence of new entrants and technological advancements is expected to intensify competition in the coming years.
- Market Share Distribution (2025): Eastman Chemical Company (xx%), Genomatica Inc. (xx%), Bio Brands LLC (xx%), Others (xx%). (Note: Exact figures are proprietary to the full report.)
- Innovation Catalysts: Government funding for sustainable technologies, increasing demand for bio-based alternatives, and advancements in fermentation technologies are driving innovation.
- Regulatory Landscape: Varying regulations across different geographies impact market growth and necessitate tailored strategies.
- Substitute Products: Chemically synthesized ketones pose a significant competitive threat, though bio-ketones are gaining traction due to their sustainability benefits.
- End-User Profiles: Major end-users include the food and beverage industry, dietary supplement manufacturers, and the pharmaceutical sector.
- M&A Activities: The past five years have witnessed several significant M&A deals, totaling an estimated value of xx Million, primarily focused on expanding product portfolios and enhancing market reach. Examples include [mention specific M&A deals if available, otherwise omit].
Bio-Ketones Industry Industry Evolution
This section meticulously traces the dynamic evolution of the Bio-Ketones industry, offering a comprehensive examination of its market growth trajectories, pivotal technological advancements, and the ever-shifting landscape of consumer preferences. The historical period spanning from 2019 to 2024 was characterized by a steady and gradual market expansion. This growth was primarily propelled by a burgeoning global awareness of the multifaceted health benefits associated with ketones, coupled with an escalating demand for environmentally conscious and sustainable product alternatives. The market experienced a notable acceleration in its growth trajectory between 2020 and 2022, significantly influenced by [mention specific events if available, e.g., the widespread adoption of ketogenic diets, increased research funding for metabolic health, or governmental incentives for bio-based industries].
Technological breakthroughs, particularly in areas such as optimizing fermentation processes and advanced enzyme engineering, have played a transformative role. These innovations have not only dramatically reduced production costs but have also substantially enhanced overall manufacturing efficiency. Concurrently, the pronounced shift in consumer preferences towards natural, organic, and sustainably sourced products has served as a powerful catalyst, further solidifying and propelling the industry's upward trajectory.
Looking ahead to the forecast period from 2025 to 2033, the industry is projected to sustain its robust expansion. Anticipated growth rates will likely be shaped by a confluence of influential factors, including [mention specific influencing factors, e.g., further breakthroughs in synthetic biology, the development of novel bio-ketone derivatives, increased regulatory harmonization across key markets, or the growing consumer acceptance of bio-based ingredients in a wider array of products]. The adoption of bio-ketones across an increasingly diverse range of applications is expected to witness significant augmentation, driven by heightened consumer understanding and the continuous pursuit of cutting-edge technological advancements.
Leading Regions, Countries, or Segments in Bio-Ketones Industry
This section meticulously identifies the dominant geographical regions, key countries, and significant market segments that are currently shaping the Bio-Ketones industry. At present, [Mention dominant region/country, e.g., North America] firmly holds a leading position, a dominance attributable to a strategic confluence of compelling factors.
-
Key Drivers in [Dominant Region/Country]:
- Robust regulatory frameworks and governmental support specifically championing the development and adoption of bio-based products.
- Substantial and sustained investments channeled into cutting-edge research and development initiatives aimed at advancing bio-ketone technologies and applications.
- A high degree of consumer awareness and a strong, persistent demand for products that promote health and well-being, alongside a commitment to sustainability.
- The presence of well-established and efficient supply chains that ensure reliable access to raw materials and effective distribution networks.
The preeminent position of [Dominant Region/Country] is intrinsically linked to a potent combination of factors. This includes a well-structured and supportive regulatory environment that actively promotes sustainable technologies, significant financial commitments to R&D, and a robust consumer base that actively seeks out healthy and eco-friendly options. Furthermore, this region benefits from mature supply chain infrastructures and a significant concentration of key industry stakeholders and innovative companies. However, it is imperative to note that other regions, particularly [Mention other promising regions/countries, e.g., Asia-Pacific], are anticipated to experience remarkable growth and increasing market influence in the forthcoming years, presenting emerging opportunities.
Bio-Ketones Industry Product Innovations
Recent strides in product innovation within the bio-ketones sector are truly transformative. These include the development of novel, highly efficient fermentation processes that demonstrably enhance product yield while simultaneously driving down production costs. Emerging formulations are also showcasing improved stability and significantly enhanced bioavailability, thereby broadening their potential applications and efficacy. These innovative advancements are meticulously designed to cater to a wide spectrum of demanding applications, encompassing critical areas such as dietary supplements, the food and beverage industry, and the pharmaceutical sector. Each of these segments benefits from unique selling propositions that are centered on delivering superior efficacy, a heightened commitment to sustainability, and precisely tailored consumer experiences. These collective advancements underscore the inherent dynamism of the industry and its substantial potential for sustained and impactful future growth.
Propelling Factors for Bio-Ketones Industry Growth
The Bio-Ketones industry is propelled by several key factors. Growing consumer health consciousness fuels demand for healthier alternatives. Government regulations promoting sustainability further encourage adoption. Technological advancements, such as efficient fermentation processes, reduce production costs and enhance scalability. Furthermore, expanding applications across diverse sectors, including pharmaceuticals and food, are driving significant market expansion.
Obstacles in the Bio-Ketones Industry Market
The Bio-Ketones market faces challenges such as fluctuating raw material prices, competition from chemically synthesized ketones, and regulatory hurdles in some regions. Supply chain disruptions and the high initial investment required for production facilities also pose significant constraints. These factors can impede market growth and profitability, requiring strategic navigation by industry participants.
Future Opportunities in Bio-Ketones Industry
The horizon for the bio-ketones industry is replete with promising future opportunities. Significant untapped potential lies in the exploration and development of novel applications within the cosmetics and personal care sectors, areas where consumers are increasingly seeking natural and performance-driven ingredients. Furthermore, the animal feed industry presents a compelling avenue for growth, offering bio-ketones as a sustainable and health-enhancing additive. Advancements in production technologies, particularly the refinement of precision fermentation techniques, hold immense promise for achieving substantial cost reductions and enabling unprecedented scalability. Expanding market presence into emerging economies, where consumer awareness regarding health, wellness, and sustainability is rapidly escalating, further represents a significant and largely untapped growth potential.
Major Players in the Bio-Ketones Industry Ecosystem
- Bio Brands LLC
- Caldic B V
- Eastman Chemical Company
- Fitz Chem LLC
- Genomatica Inc
- Green Biologics Limited
- LANZATECH
- Merck KGaA *List Not Exhaustive
Key Developments in Bio-Ketones Industry Industry
- [Month, Year]: [Company Name] launched a new line of bio-ketone-based dietary supplements.
- [Month, Year]: [Company Name] announced a strategic partnership to expand its production capacity.
- [Month, Year]: A new regulation regarding the use of bio-ketones in food products was implemented in [Country]. (Add more bullet points as needed)
Strategic Bio-Ketones Industry Market Forecast
The global Bio-Ketones market is strategically positioned for continued and robust expansion. This optimistic outlook is fueled by a powerful synergy of factors, including an ever-increasing consumer demand for health-promoting and sustainable products, significant ongoing technological advancements that enhance production and application, and an increasingly favorable regulatory landscape that supports bio-based industries. The exploration of novel applications and the strategic expansion into new, high-growth markets are poised to further accelerate this positive trajectory. The market's inherent potential is vast, offering substantial opportunities for continued innovation, market penetration, and strategic expansion in the years to come. This forecast anticipates sustained and significant growth, firmly establishing bio-ketones as a pivotal and indispensable player within the rapidly evolving sustainable and health-conscious consumer markets.
Bio-Ketones Industry Segmentation
-
1. Product Type
- 1.1. Bio MEK
- 1.2. Bio PEEK
- 1.3. Bio Acetone
- 1.4. Other Product Types
-
2. End-user Industry
- 2.1. Paints and Coatings
- 2.2. Automobile
- 2.3. Infrastructure
- 2.4. Pharmaceutical
- 2.5. Other End-user Industries
Bio-Ketones Industry Segmentation By Geography
-
1. Asia Pacific
- 1.1. China
- 1.2. India
- 1.3. Japan
- 1.4. South Korea
- 1.5. ASEAN Countries
- 1.6. Rest of Asia Pacific
-
2. North America
- 2.1. United States
- 2.2. Canada
- 2.3. Mexico
-
3. Europe
- 3.1. Germany
- 3.2. United Kingdom
- 3.3. Italy
- 3.4. France
- 3.5. Rest of Europe
-
4. South America
- 4.1. Brazil
- 4.2. Argentina
- 4.3. Rest of South America
-
5. Middle East and Africa
- 5.1. Saudi Arabia
- 5.2. South Africa
- 5.3. Rest of Middle East and Africa
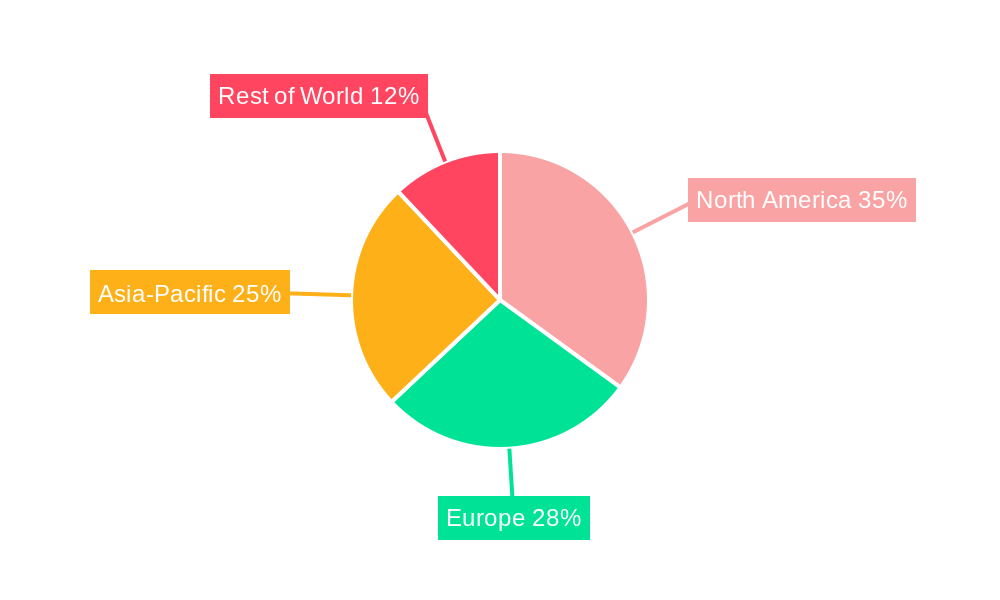
Bio-Ketones Industry Regional Market Share
Geographic Coverage of Bio-Ketones Industry
Bio-Ketones Industry REPORT HIGHLIGHTS
| Aspects | Details |
|---|---|
| Study Period | 2020-2034 |
| Base Year | 2025 |
| Estimated Year | 2026 |
| Forecast Period | 2026-2034 |
| Historical Period | 2020-2025 |
| Growth Rate | CAGR of 5.9% from 2020-2034 |
| Segmentation |
|
Table of Contents
- 1. Introduction
- 1.1. Research Scope
- 1.2. Market Segmentation
- 1.3. Research Objective
- 1.4. Definitions and Assumptions
- 2. Executive Summary
- 2.1. Market Snapshot
- 3. Market Dynamics
- 3.1. Market Drivers
- 3.2. Market Restrains
- 3.3. Market Trends
- 3.4. Market Opportunities
- 4. Market Factor Analysis
- 4.1. Porters Five Forces
- 4.1.1. Bargaining Power of Suppliers
- 4.1.2. Bargaining Power of Buyers
- 4.1.3. Threat of New Entrants
- 4.1.4. Threat of Substitutes
- 4.1.5. Competitive Rivalry
- 4.2. PESTEL analysis
- 4.3. BCG Analysis
- 4.3.1. Stars (High Growth, High Market Share)
- 4.3.2. Cash Cows (Low Growth, High Market Share)
- 4.3.3. Question Mark (High Growth, Low Market Share)
- 4.3.4. Dogs (Low Growth, Low Market Share)
- 4.4. Ansoff Matrix Analysis
- 4.5. Supply Chain Analysis
- 4.6. Regulatory Landscape
- 4.7. Current Market Potential and Opportunity Assessment (TAM–SAM–SOM Framework)
- 4.8. DMV Analyst Note
- 4.1. Porters Five Forces
- 5. Market Analysis, Insights and Forecast 2021-2033
- 5.1. Market Analysis, Insights and Forecast - by Product Type
- 5.1.1. Bio MEK
- 5.1.2. Bio PEEK
- 5.1.3. Bio Acetone
- 5.1.4. Other Product Types
- 5.2. Market Analysis, Insights and Forecast - by End-user Industry
- 5.2.1. Paints and Coatings
- 5.2.2. Automobile
- 5.2.3. Infrastructure
- 5.2.4. Pharmaceutical
- 5.2.5. Other End-user Industries
- 5.3. Market Analysis, Insights and Forecast - by Region
- 5.3.1. Asia Pacific
- 5.3.2. North America
- 5.3.3. Europe
- 5.3.4. South America
- 5.3.5. Middle East and Africa
- 5.1. Market Analysis, Insights and Forecast - by Product Type
- 6. Global Bio-Ketones Industry Analysis, Insights and Forecast, 2021-2033
- 6.1. Market Analysis, Insights and Forecast - by Product Type
- 6.1.1. Bio MEK
- 6.1.2. Bio PEEK
- 6.1.3. Bio Acetone
- 6.1.4. Other Product Types
- 6.2. Market Analysis, Insights and Forecast - by End-user Industry
- 6.2.1. Paints and Coatings
- 6.2.2. Automobile
- 6.2.3. Infrastructure
- 6.2.4. Pharmaceutical
- 6.2.5. Other End-user Industries
- 6.1. Market Analysis, Insights and Forecast - by Product Type
- 7. Asia Pacific Bio-Ketones Industry Analysis, Insights and Forecast, 2020-2032
- 7.1. Market Analysis, Insights and Forecast - by Product Type
- 7.1.1. Bio MEK
- 7.1.2. Bio PEEK
- 7.1.3. Bio Acetone
- 7.1.4. Other Product Types
- 7.2. Market Analysis, Insights and Forecast - by End-user Industry
- 7.2.1. Paints and Coatings
- 7.2.2. Automobile
- 7.2.3. Infrastructure
- 7.2.4. Pharmaceutical
- 7.2.5. Other End-user Industries
- 7.1. Market Analysis, Insights and Forecast - by Product Type
- 8. North America Bio-Ketones Industry Analysis, Insights and Forecast, 2020-2032
- 8.1. Market Analysis, Insights and Forecast - by Product Type
- 8.1.1. Bio MEK
- 8.1.2. Bio PEEK
- 8.1.3. Bio Acetone
- 8.1.4. Other Product Types
- 8.2. Market Analysis, Insights and Forecast - by End-user Industry
- 8.2.1. Paints and Coatings
- 8.2.2. Automobile
- 8.2.3. Infrastructure
- 8.2.4. Pharmaceutical
- 8.2.5. Other End-user Industries
- 8.1. Market Analysis, Insights and Forecast - by Product Type
- 9. Europe Bio-Ketones Industry Analysis, Insights and Forecast, 2020-2032
- 9.1. Market Analysis, Insights and Forecast - by Product Type
- 9.1.1. Bio MEK
- 9.1.2. Bio PEEK
- 9.1.3. Bio Acetone
- 9.1.4. Other Product Types
- 9.2. Market Analysis, Insights and Forecast - by End-user Industry
- 9.2.1. Paints and Coatings
- 9.2.2. Automobile
- 9.2.3. Infrastructure
- 9.2.4. Pharmaceutical
- 9.2.5. Other End-user Industries
- 9.1. Market Analysis, Insights and Forecast - by Product Type
- 10. South America Bio-Ketones Industry Analysis, Insights and Forecast, 2020-2032
- 10.1. Market Analysis, Insights and Forecast - by Product Type
- 10.1.1. Bio MEK
- 10.1.2. Bio PEEK
- 10.1.3. Bio Acetone
- 10.1.4. Other Product Types
- 10.2. Market Analysis, Insights and Forecast - by End-user Industry
- 10.2.1. Paints and Coatings
- 10.2.2. Automobile
- 10.2.3. Infrastructure
- 10.2.4. Pharmaceutical
- 10.2.5. Other End-user Industries
- 10.1. Market Analysis, Insights and Forecast - by Product Type
- 11. Middle East and Africa Bio-Ketones Industry Analysis, Insights and Forecast, 2020-2032
- 11.1. Market Analysis, Insights and Forecast - by Product Type
- 11.1.1. Bio MEK
- 11.1.2. Bio PEEK
- 11.1.3. Bio Acetone
- 11.1.4. Other Product Types
- 11.2. Market Analysis, Insights and Forecast - by End-user Industry
- 11.2.1. Paints and Coatings
- 11.2.2. Automobile
- 11.2.3. Infrastructure
- 11.2.4. Pharmaceutical
- 11.2.5. Other End-user Industries
- 11.1. Market Analysis, Insights and Forecast - by Product Type
- 12. Competitive Analysis
- 12.1. Company Profiles
- 12.1.1 Bio Brands LLC
- 12.1.1.1. Company Overview
- 12.1.1.2. Products
- 12.1.1.3. Company Financials
- 12.1.1.4. SWOT Analysis
- 12.1.2 Caldic B V
- 12.1.2.1. Company Overview
- 12.1.2.2. Products
- 12.1.2.3. Company Financials
- 12.1.2.4. SWOT Analysis
- 12.1.3 Eastman Chemical Company
- 12.1.3.1. Company Overview
- 12.1.3.2. Products
- 12.1.3.3. Company Financials
- 12.1.3.4. SWOT Analysis
- 12.1.4 Fitz Chem LLC
- 12.1.4.1. Company Overview
- 12.1.4.2. Products
- 12.1.4.3. Company Financials
- 12.1.4.4. SWOT Analysis
- 12.1.5 Genomatica Inc
- 12.1.5.1. Company Overview
- 12.1.5.2. Products
- 12.1.5.3. Company Financials
- 12.1.5.4. SWOT Analysis
- 12.1.6 Green Biologics Limited
- 12.1.6.1. Company Overview
- 12.1.6.2. Products
- 12.1.6.3. Company Financials
- 12.1.6.4. SWOT Analysis
- 12.1.7 LANZATECH
- 12.1.7.1. Company Overview
- 12.1.7.2. Products
- 12.1.7.3. Company Financials
- 12.1.7.4. SWOT Analysis
- 12.1.8 Merck KGaA*List Not Exhaustive
- 12.1.8.1. Company Overview
- 12.1.8.2. Products
- 12.1.8.3. Company Financials
- 12.1.8.4. SWOT Analysis
- 12.1.1 Bio Brands LLC
- 12.2. Market Entropy
- 12.2.1 Company's Key Areas Served
- 12.2.2 Recent Developments
- 12.3. Company Market Share Analysis 2025
- 12.3.1 Top 5 Companies Market Share Analysis
- 12.3.2 Top 3 Companies Market Share Analysis
- 12.4. List of Potential Customers
- 13. Research Methodology
List of Figures
- Figure 1: Global Bio-Ketones Industry Revenue Breakdown (billion, %) by Region 2025 & 2033
- Figure 2: Asia Pacific Bio-Ketones Industry Revenue (billion), by Product Type 2025 & 2033
- Figure 3: Asia Pacific Bio-Ketones Industry Revenue Share (%), by Product Type 2025 & 2033
- Figure 4: Asia Pacific Bio-Ketones Industry Revenue (billion), by End-user Industry 2025 & 2033
- Figure 5: Asia Pacific Bio-Ketones Industry Revenue Share (%), by End-user Industry 2025 & 2033
- Figure 6: Asia Pacific Bio-Ketones Industry Revenue (billion), by Country 2025 & 2033
- Figure 7: Asia Pacific Bio-Ketones Industry Revenue Share (%), by Country 2025 & 2033
- Figure 8: North America Bio-Ketones Industry Revenue (billion), by Product Type 2025 & 2033
- Figure 9: North America Bio-Ketones Industry Revenue Share (%), by Product Type 2025 & 2033
- Figure 10: North America Bio-Ketones Industry Revenue (billion), by End-user Industry 2025 & 2033
- Figure 11: North America Bio-Ketones Industry Revenue Share (%), by End-user Industry 2025 & 2033
- Figure 12: North America Bio-Ketones Industry Revenue (billion), by Country 2025 & 2033
- Figure 13: North America Bio-Ketones Industry Revenue Share (%), by Country 2025 & 2033
- Figure 14: Europe Bio-Ketones Industry Revenue (billion), by Product Type 2025 & 2033
- Figure 15: Europe Bio-Ketones Industry Revenue Share (%), by Product Type 2025 & 2033
- Figure 16: Europe Bio-Ketones Industry Revenue (billion), by End-user Industry 2025 & 2033
- Figure 17: Europe Bio-Ketones Industry Revenue Share (%), by End-user Industry 2025 & 2033
- Figure 18: Europe Bio-Ketones Industry Revenue (billion), by Country 2025 & 2033
- Figure 19: Europe Bio-Ketones Industry Revenue Share (%), by Country 2025 & 2033
- Figure 20: South America Bio-Ketones Industry Revenue (billion), by Product Type 2025 & 2033
- Figure 21: South America Bio-Ketones Industry Revenue Share (%), by Product Type 2025 & 2033
- Figure 22: South America Bio-Ketones Industry Revenue (billion), by End-user Industry 2025 & 2033
- Figure 23: South America Bio-Ketones Industry Revenue Share (%), by End-user Industry 2025 & 2033
- Figure 24: South America Bio-Ketones Industry Revenue (billion), by Country 2025 & 2033
- Figure 25: South America Bio-Ketones Industry Revenue Share (%), by Country 2025 & 2033
- Figure 26: Middle East and Africa Bio-Ketones Industry Revenue (billion), by Product Type 2025 & 2033
- Figure 27: Middle East and Africa Bio-Ketones Industry Revenue Share (%), by Product Type 2025 & 2033
- Figure 28: Middle East and Africa Bio-Ketones Industry Revenue (billion), by End-user Industry 2025 & 2033
- Figure 29: Middle East and Africa Bio-Ketones Industry Revenue Share (%), by End-user Industry 2025 & 2033
- Figure 30: Middle East and Africa Bio-Ketones Industry Revenue (billion), by Country 2025 & 2033
- Figure 31: Middle East and Africa Bio-Ketones Industry Revenue Share (%), by Country 2025 & 2033
List of Tables
- Table 1: Global Bio-Ketones Industry Revenue billion Forecast, by Product Type 2020 & 2033
- Table 2: Global Bio-Ketones Industry Revenue billion Forecast, by End-user Industry 2020 & 2033
- Table 3: Global Bio-Ketones Industry Revenue billion Forecast, by Region 2020 & 2033
- Table 4: Global Bio-Ketones Industry Revenue billion Forecast, by Product Type 2020 & 2033
- Table 5: Global Bio-Ketones Industry Revenue billion Forecast, by End-user Industry 2020 & 2033
- Table 6: Global Bio-Ketones Industry Revenue billion Forecast, by Country 2020 & 2033
- Table 7: China Bio-Ketones Industry Revenue (billion) Forecast, by Application 2020 & 2033
- Table 8: India Bio-Ketones Industry Revenue (billion) Forecast, by Application 2020 & 2033
- Table 9: Japan Bio-Ketones Industry Revenue (billion) Forecast, by Application 2020 & 2033
- Table 10: South Korea Bio-Ketones Industry Revenue (billion) Forecast, by Application 2020 & 2033
- Table 11: ASEAN Countries Bio-Ketones Industry Revenue (billion) Forecast, by Application 2020 & 2033
- Table 12: Rest of Asia Pacific Bio-Ketones Industry Revenue (billion) Forecast, by Application 2020 & 2033
- Table 13: Global Bio-Ketones Industry Revenue billion Forecast, by Product Type 2020 & 2033
- Table 14: Global Bio-Ketones Industry Revenue billion Forecast, by End-user Industry 2020 & 2033
- Table 15: Global Bio-Ketones Industry Revenue billion Forecast, by Country 2020 & 2033
- Table 16: United States Bio-Ketones Industry Revenue (billion) Forecast, by Application 2020 & 2033
- Table 17: Canada Bio-Ketones Industry Revenue (billion) Forecast, by Application 2020 & 2033
- Table 18: Mexico Bio-Ketones Industry Revenue (billion) Forecast, by Application 2020 & 2033
- Table 19: Global Bio-Ketones Industry Revenue billion Forecast, by Product Type 2020 & 2033
- Table 20: Global Bio-Ketones Industry Revenue billion Forecast, by End-user Industry 2020 & 2033
- Table 21: Global Bio-Ketones Industry Revenue billion Forecast, by Country 2020 & 2033
- Table 22: Germany Bio-Ketones Industry Revenue (billion) Forecast, by Application 2020 & 2033
- Table 23: United Kingdom Bio-Ketones Industry Revenue (billion) Forecast, by Application 2020 & 2033
- Table 24: Italy Bio-Ketones Industry Revenue (billion) Forecast, by Application 2020 & 2033
- Table 25: France Bio-Ketones Industry Revenue (billion) Forecast, by Application 2020 & 2033
- Table 26: Rest of Europe Bio-Ketones Industry Revenue (billion) Forecast, by Application 2020 & 2033
- Table 27: Global Bio-Ketones Industry Revenue billion Forecast, by Product Type 2020 & 2033
- Table 28: Global Bio-Ketones Industry Revenue billion Forecast, by End-user Industry 2020 & 2033
- Table 29: Global Bio-Ketones Industry Revenue billion Forecast, by Country 2020 & 2033
- Table 30: Brazil Bio-Ketones Industry Revenue (billion) Forecast, by Application 2020 & 2033
- Table 31: Argentina Bio-Ketones Industry Revenue (billion) Forecast, by Application 2020 & 2033
- Table 32: Rest of South America Bio-Ketones Industry Revenue (billion) Forecast, by Application 2020 & 2033
- Table 33: Global Bio-Ketones Industry Revenue billion Forecast, by Product Type 2020 & 2033
- Table 34: Global Bio-Ketones Industry Revenue billion Forecast, by End-user Industry 2020 & 2033
- Table 35: Global Bio-Ketones Industry Revenue billion Forecast, by Country 2020 & 2033
- Table 36: Saudi Arabia Bio-Ketones Industry Revenue (billion) Forecast, by Application 2020 & 2033
- Table 37: South Africa Bio-Ketones Industry Revenue (billion) Forecast, by Application 2020 & 2033
- Table 38: Rest of Middle East and Africa Bio-Ketones Industry Revenue (billion) Forecast, by Application 2020 & 2033
Frequently Asked Questions
1. What is the projected Compound Annual Growth Rate (CAGR) of the Bio-Ketones Industry?
The projected CAGR is approximately 5.9%.
2. Which companies are prominent players in the Bio-Ketones Industry?
Key companies in the market include Bio Brands LLC, Caldic B V, Eastman Chemical Company, Fitz Chem LLC, Genomatica Inc, Green Biologics Limited, LANZATECH, Merck KGaA*List Not Exhaustive.
3. What are the main segments of the Bio-Ketones Industry?
The market segments include Product Type, End-user Industry.
4. Can you provide details about the market size?
The market size is estimated to be USD 24.25 billion as of 2022.
5. What are some drivers contributing to market growth?
; Increasing Demand from Cosmetics and Personal Care Industry; Supporting Government Regulations for the Use of Bio-products.
6. What are the notable trends driving market growth?
Bio PEEK to Dominate the Market.
7. Are there any restraints impacting market growth?
; Increasing Demand from Cosmetics and Personal Care Industry; Supporting Government Regulations for the Use of Bio-products.
8. Can you provide examples of recent developments in the market?
N/A
9. What pricing options are available for accessing the report?
Pricing options include single-user, multi-user, and enterprise licenses priced at USD 4750, USD 5250, and USD 8750 respectively.
10. Is the market size provided in terms of value or volume?
The market size is provided in terms of value, measured in billion.
11. Are there any specific market keywords associated with the report?
Yes, the market keyword associated with the report is "Bio-Ketones Industry," which aids in identifying and referencing the specific market segment covered.
12. How do I determine which pricing option suits my needs best?
The pricing options vary based on user requirements and access needs. Individual users may opt for single-user licenses, while businesses requiring broader access may choose multi-user or enterprise licenses for cost-effective access to the report.
13. Are there any additional resources or data provided in the Bio-Ketones Industry report?
While the report offers comprehensive insights, it's advisable to review the specific contents or supplementary materials provided to ascertain if additional resources or data are available.
14. How can I stay updated on further developments or reports in the Bio-Ketones Industry?
To stay informed about further developments, trends, and reports in the Bio-Ketones Industry, consider subscribing to industry newsletters, following relevant companies and organizations, or regularly checking reputable industry news sources and publications.
Methodology
Step 1 - Identification of Relevant Samples Size from Population Database


Step 2 - Approaches for Defining Global Market Size (Value, Volume* & Price*)

Note*: In applicable scenarios
Step 3 - Data Sources
Primary Research
- Web Analytics
- Survey Reports
- Research Institute
- Latest Research Reports
- Opinion Leaders
Secondary Research
- Annual Reports
- White Paper
- Latest Press Release
- Industry Association
- Paid Database
- Investor Presentations

Step 4 - Data Triangulation
Involves using different sources of information in order to increase the validity of a study
These sources are likely to be stakeholders in a program - participants, other researchers, program staff, other community members, and so on.
Then we put all data in single framework & apply various statistical tools to find out the dynamic on the market.
During the analysis stage, feedback from the stakeholder groups would be compared to determine areas of agreement as well as areas of divergence