

Key Insights
The global bio-based resins market is experiencing substantial expansion, propelled by increasing environmental consciousness and rigorous regulations against petroleum-based plastics. The market, valued at approximately $1.4 billion in 2025, is projected to grow at a Compound Annual Growth Rate (CAGR) of 9% from 2025 to 2033. Key growth drivers include the escalating demand for sustainable and eco-friendly materials across sectors like packaging, textiles, and automotive, alongside technological advancements enhancing performance and cost-effectiveness of bio-based resins. The packaging segment leads, driven by consumer preference for biodegradable and compostable solutions. Other significant applications include sustainable textiles and lightweight, eco-friendly automotive components. Despite challenges such as higher costs and the need for further material property enhancements, the market's positive long-term trajectory is supported by favorable government policies and corporate sustainability initiatives.
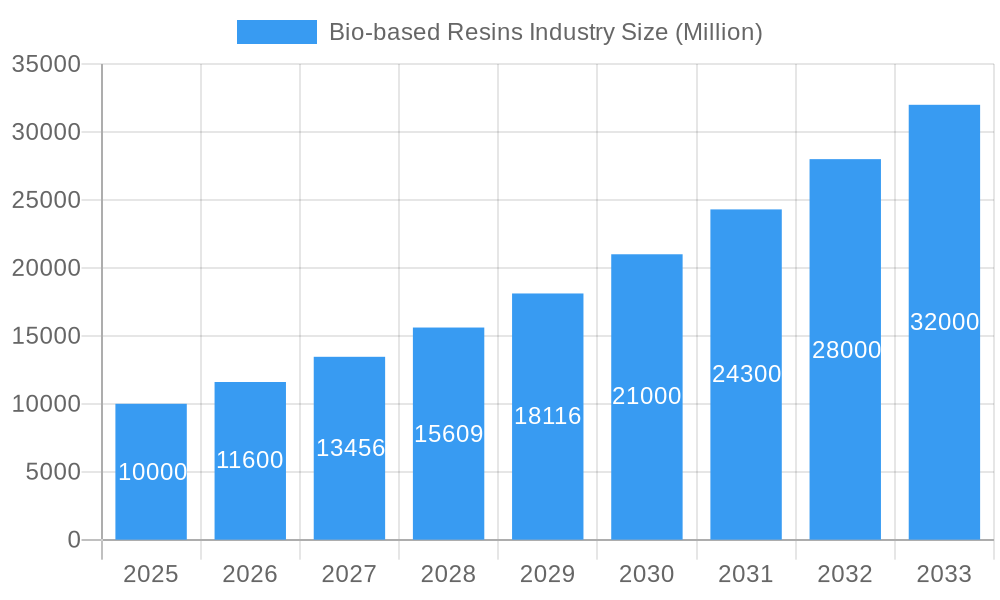
Bio-based Resins Industry Market Size (In Billion)
Market growth is further segmented by resin type. Polylactic acid (PLA) and biodegradable starch blends currently dominate due to established applications and production infrastructure. However, polyhydroxyalkanoate (PHA) and bio-polyethylene (Bio-PE) are gaining momentum owing to their unique properties and expanding use cases. Geographically, North America and Europe hold significant market shares, driven by stringent environmental regulations and high consumer awareness. The Asia Pacific region is poised for rapid growth, fueled by industrialization and rising demand for sustainable materials in emerging economies. Leading market players include established chemical companies like Novamont, Arkema, and BASF, alongside specialized bio-based resin manufacturers. The competitive landscape is characterized by ongoing innovation, strategic collaborations, and mergers and acquisitions aimed at portfolio expansion and market penetration.
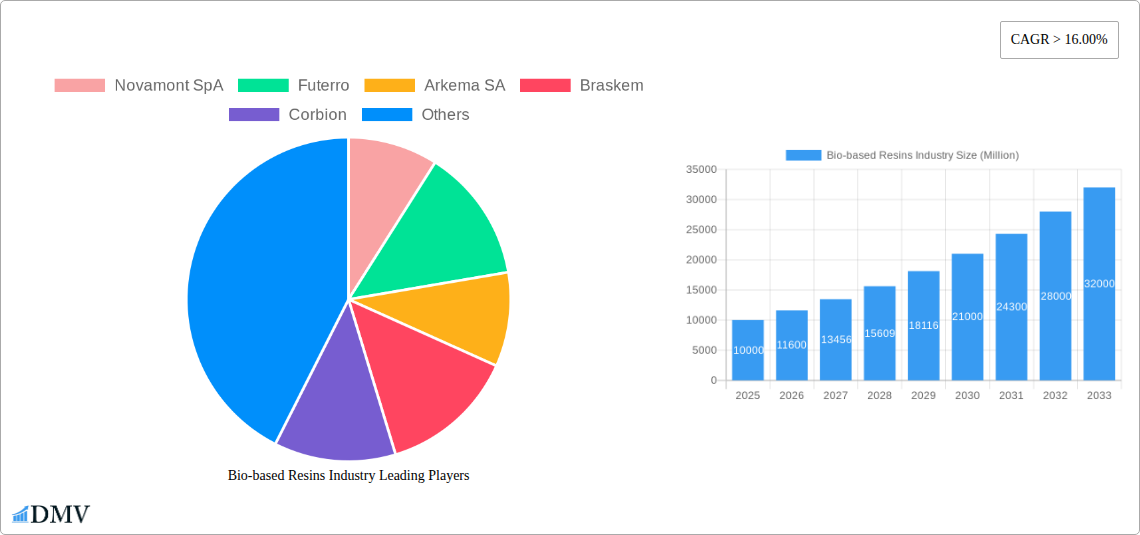
Bio-based Resins Industry Company Market Share
Bio-based Resins Industry Market Report: 2019-2033
This comprehensive report provides an in-depth analysis of the bio-based resins market, projecting significant growth from USD xx Million in 2025 to USD xx Million by 2033. It covers market trends, leading players, technological advancements, and future opportunities within the industry. Ideal for investors, manufacturers, and researchers seeking a clear understanding of this rapidly evolving sector. The report utilizes data from 2019-2024 (Historical Period) and projects to 2033 (Forecast Period), with 2025 serving as both the Base Year and Estimated Year.
Bio-based Resins Industry Market Composition & Trends
The bio-based resins market is characterized by moderate concentration, with key players such as Novamont SpA, Futerro, Arkema SA, Braskem, Corbion, BASF SE, Trinseo, and others holding significant market share. Market share distribution in 2025 is estimated as follows: Novamont SpA (xx%), Arkema SA (xx%), BASF SE (xx%), with remaining share distributed among other players. Innovation is driven by the increasing demand for sustainable materials and stringent environmental regulations. The regulatory landscape, including policies promoting bio-based materials, significantly influences market growth. Substitute products such as traditional petroleum-based resins pose a competitive challenge, though their environmental impact is a key differentiator. End-users span diverse sectors, including packaging, textiles, and automotive, with packaging currently dominating the market. M&A activity within the sector has been relatively moderate in recent years, with a total estimated deal value of USD xx Million in the period 2019-2024.
- Market Concentration: Moderately concentrated with a few major players holding significant market share.
- Innovation Catalysts: Growing demand for sustainable alternatives, stringent environmental regulations.
- Regulatory Landscape: Favorable policies promoting bio-based materials are a key driver.
- Substitute Products: Traditional petroleum-based resins pose a competitive threat.
- End-User Profile: Diverse sectors including packaging, textiles, automotive, and consumer goods.
- M&A Activity: Moderate activity with an estimated USD xx Million in deal value (2019-2024).
Bio-based Resins Industry Evolution
The bio-based resins market has witnessed substantial growth over the past few years, fueled by increasing consumer awareness of environmental sustainability and the rising demand for eco-friendly products. The market is projected to experience a compound annual growth rate (CAGR) of xx% from 2025 to 2033. Technological advancements, particularly in bio-polymer synthesis and processing techniques, are enabling the production of high-performance bio-based resins that compete effectively with their petroleum-based counterparts. The shift in consumer preferences towards sustainable and biodegradable products is a crucial factor pushing the industry's growth. The adoption rate of bio-based resins in various applications is steadily increasing, with significant growth observed in the packaging and consumer goods sectors. The market is further shaped by ongoing research and development efforts focused on improving the performance characteristics of bio-based resins, such as enhancing their strength, durability, and processability, while maintaining their biodegradability and sustainability. The market is seeing a growing preference for higher-performing bio-based resins in key applications, thus driving growth and innovation.
Leading Regions, Countries, or Segments in Bio-based Resins Industry
The bio-based resins market exhibits significant regional variations. Currently, [Region Name] dominates, driven by factors such as strong government support, well-established infrastructure, and a large consumer base. Within specific resin types, Polylactic Acid (PLA) holds the largest market share among bio-based resins, followed by biodegradable starch blends. In applications, the packaging industry leads in terms of consumption, owing to the growing demand for eco-friendly alternatives.
Key Drivers:
- Strong government support and incentives for sustainable materials.
- Well-established infrastructure for manufacturing and distribution.
- High consumer demand for eco-friendly products.
- High investment in R&D for enhanced performance characteristics.
Dominance Factors:
- Abundant renewable feedstock availability.
- High concentration of key market players.
- Favorable regulatory environment.
Bio-based Resins Industry Product Innovations
Recent innovations focus on enhancing the performance and cost-effectiveness of bio-based resins. New formulations boast improved mechanical properties, heat resistance, and water resistance, broadening their applicability in diverse sectors. The incorporation of nanomaterials and advanced processing techniques contribute to these improvements. Several companies are developing unique selling propositions by focusing on specific functionalities or certifications (e.g., compostability standards) for their products.
Propelling Factors for Bio-based Resins Industry Growth
Several factors are driving the expansion of the bio-based resins market. Technological advancements continue to improve the performance and affordability of these resins. Government regulations promoting sustainability and reducing reliance on fossil fuels significantly stimulate market growth. Furthermore, growing consumer demand for eco-friendly products is a powerful force, pushing companies to innovate and offer sustainable alternatives. The economic incentives associated with reduced environmental impact and enhanced brand image also contribute to market growth.
Obstacles in the Bio-based Resins Industry Market
Despite promising growth, challenges persist. Regulatory hurdles and inconsistencies across different regions create complexities for manufacturers. Supply chain disruptions, particularly in the sourcing of renewable feedstock, can impact production and stability. Competitive pressures from traditional petroleum-based resins, which often remain cheaper, remain a considerable challenge, and cost-competitiveness remains a significant factor in wider adoption. These hurdles, though substantial, are not insurmountable and are being addressed through technological innovation and supportive regulatory frameworks.
Future Opportunities in Bio-based Resins Industry
Future opportunities lie in exploring new applications for bio-based resins, such as advanced bioplastics, in emerging markets such as sustainable packaging for food and cosmetics. The development of novel bio-based resins with enhanced functionalities, addressing currently unmet market needs, presents a significant opportunity. Expanding into new markets (e.g., bio-based construction materials) and adapting to the evolving consumer preferences for increasingly sustainable products will play a significant role in market expansion.
Major Players in the Bio-based Resins Industry Ecosystem
- Novamont SpA
- Futerro
- Arkema SA
- Braskem
- Corbion
- BASF SE
- Trinseo
- Biotec
- Yield10 Bioscience Inc
- DuPont
- Minima
- Natureworks LLC
- Danimer Scientific
Key Developments in Bio-based Resins Industry Industry
- 2022 Q4: Arkema SA announces a new bio-based resin production facility.
- 2023 Q1: BASF SE and Novamont SpA enter into a strategic partnership to develop new bio-based materials.
- 2024 Q2: New regulations in [Country Name] boost demand for bio-based resins in packaging.
- (Further developments to be added based on data availability)
Strategic Bio-based Resins Industry Market Forecast
The bio-based resins market is poised for substantial growth, propelled by increasing environmental awareness, supportive government policies, and technological advancements. The predicted CAGR of xx% over the forecast period (2025-2033) reflects considerable optimism regarding the market's future. Continued innovation, focused on cost reduction and performance enhancement, will be critical to achieving the projected growth. Expansion into new markets and diversification of applications will be crucial in realizing the market's full potential.
Bio-based Resins Industry Segmentation
-
1. Type
- 1.1. Biodegradable Starch Blends
- 1.2. Polylactic Acid (PLA)
- 1.3. Bio-polyethylene Terephthalate (Bio-PET)
- 1.4. Polyhydroxyalkanoate (PHA)
- 1.5. Bio-polyethylene (Bio-PE)
- 1.6. Biodegradable Polyesters
- 1.7. Other Types
-
2. Application
-
2.1. Packaging
- 2.1.1. Rigid
- 2.1.2. Flexible
- 2.2. Textiles
- 2.3. Consumer Goods
- 2.4. Automotive and Transportation
- 2.5. Agriculture and Horticulture
- 2.6. Building and Construction
- 2.7. Electrical and Electronics
- 2.8. Other Applications
-
2.1. Packaging
Bio-based Resins Industry Segmentation By Geography
-
1. Asia Pacific
- 1.1. China
- 1.2. India
- 1.3. Japan
- 1.4. South Korea
- 1.5. Rest of Asia Pacific
-
2. North America
- 2.1. United States
- 2.2. Canada
- 2.3. Mexico
-
3. Europe
- 3.1. Germany
- 3.2. United Kingdom
- 3.3. France
- 3.4. Italy
- 3.5. Rest of Europe
-
4. South America
- 4.1. Brazil
- 4.2. Argentina
- 4.3. Rest of South America
- 5. Middle East
-
6. Saudi Arabia
- 6.1. South Africa
- 6.2. Rest of Middle East
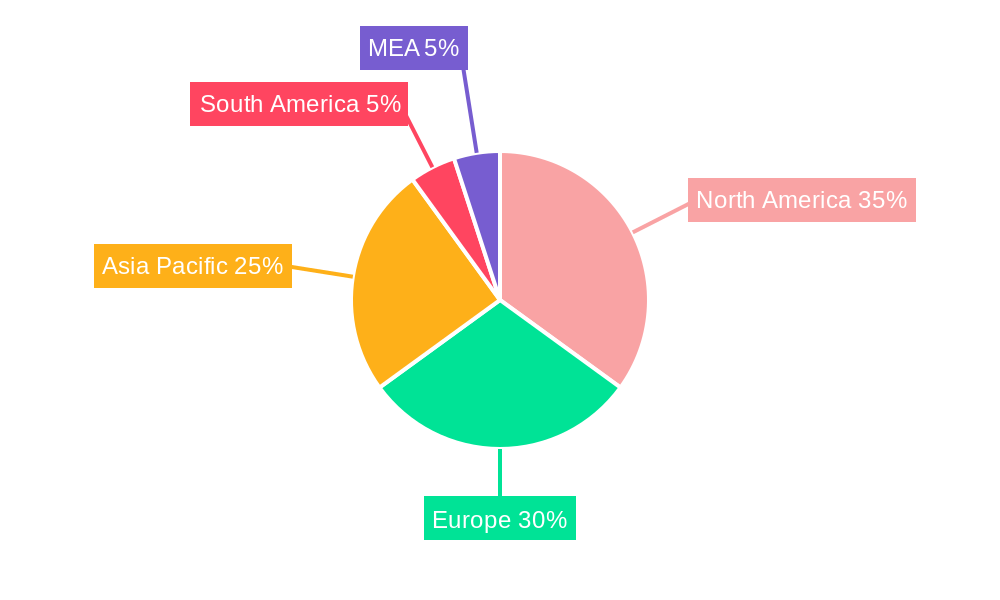
Bio-based Resins Industry Regional Market Share
Geographic Coverage of Bio-based Resins Industry
Bio-based Resins Industry REPORT HIGHLIGHTS
| Aspects | Details |
|---|---|
| Study Period | 2020-2034 |
| Base Year | 2025 |
| Estimated Year | 2026 |
| Forecast Period | 2026-2034 |
| Historical Period | 2020-2025 |
| Growth Rate | CAGR of 9% from 2020-2034 |
| Segmentation |
|
Table of Contents
- 1. Introduction
- 1.1. Research Scope
- 1.2. Market Segmentation
- 1.3. Research Objective
- 1.4. Definitions and Assumptions
- 2. Executive Summary
- 2.1. Market Snapshot
- 3. Market Dynamics
- 3.1. Market Drivers
- 3.2. Market Restrains
- 3.3. Market Trends
- 3.4. Market Opportunities
- 4. Market Factor Analysis
- 4.1. Porters Five Forces
- 4.1.1. Bargaining Power of Suppliers
- 4.1.2. Bargaining Power of Buyers
- 4.1.3. Threat of New Entrants
- 4.1.4. Threat of Substitutes
- 4.1.5. Competitive Rivalry
- 4.2. PESTEL analysis
- 4.3. BCG Analysis
- 4.3.1. Stars (High Growth, High Market Share)
- 4.3.2. Cash Cows (Low Growth, High Market Share)
- 4.3.3. Question Mark (High Growth, Low Market Share)
- 4.3.4. Dogs (Low Growth, Low Market Share)
- 4.4. Ansoff Matrix Analysis
- 4.5. Supply Chain Analysis
- 4.6. Regulatory Landscape
- 4.7. Current Market Potential and Opportunity Assessment (TAM–SAM–SOM Framework)
- 4.8. DMV Analyst Note
- 4.1. Porters Five Forces
- 5. Market Analysis, Insights and Forecast 2021-2033
- 5.1. Market Analysis, Insights and Forecast - by Type
- 5.1.1. Biodegradable Starch Blends
- 5.1.2. Polylactic Acid (PLA)
- 5.1.3. Bio-polyethylene Terephthalate (Bio-PET)
- 5.1.4. Polyhydroxyalkanoate (PHA)
- 5.1.5. Bio-polyethylene (Bio-PE)
- 5.1.6. Biodegradable Polyesters
- 5.1.7. Other Types
- 5.2. Market Analysis, Insights and Forecast - by Application
- 5.2.1. Packaging
- 5.2.1.1. Rigid
- 5.2.1.2. Flexible
- 5.2.2. Textiles
- 5.2.3. Consumer Goods
- 5.2.4. Automotive and Transportation
- 5.2.5. Agriculture and Horticulture
- 5.2.6. Building and Construction
- 5.2.7. Electrical and Electronics
- 5.2.8. Other Applications
- 5.2.1. Packaging
- 5.3. Market Analysis, Insights and Forecast - by Region
- 5.3.1. Asia Pacific
- 5.3.2. North America
- 5.3.3. Europe
- 5.3.4. South America
- 5.3.5. Middle East
- 5.3.6. Saudi Arabia
- 5.1. Market Analysis, Insights and Forecast - by Type
- 6. Global Bio-based Resins Industry Analysis, Insights and Forecast, 2021-2033
- 6.1. Market Analysis, Insights and Forecast - by Type
- 6.1.1. Biodegradable Starch Blends
- 6.1.2. Polylactic Acid (PLA)
- 6.1.3. Bio-polyethylene Terephthalate (Bio-PET)
- 6.1.4. Polyhydroxyalkanoate (PHA)
- 6.1.5. Bio-polyethylene (Bio-PE)
- 6.1.6. Biodegradable Polyesters
- 6.1.7. Other Types
- 6.2. Market Analysis, Insights and Forecast - by Application
- 6.2.1. Packaging
- 6.2.1.1. Rigid
- 6.2.1.2. Flexible
- 6.2.2. Textiles
- 6.2.3. Consumer Goods
- 6.2.4. Automotive and Transportation
- 6.2.5. Agriculture and Horticulture
- 6.2.6. Building and Construction
- 6.2.7. Electrical and Electronics
- 6.2.8. Other Applications
- 6.2.1. Packaging
- 6.1. Market Analysis, Insights and Forecast - by Type
- 7. Asia Pacific Bio-based Resins Industry Analysis, Insights and Forecast, 2020-2032
- 7.1. Market Analysis, Insights and Forecast - by Type
- 7.1.1. Biodegradable Starch Blends
- 7.1.2. Polylactic Acid (PLA)
- 7.1.3. Bio-polyethylene Terephthalate (Bio-PET)
- 7.1.4. Polyhydroxyalkanoate (PHA)
- 7.1.5. Bio-polyethylene (Bio-PE)
- 7.1.6. Biodegradable Polyesters
- 7.1.7. Other Types
- 7.2. Market Analysis, Insights and Forecast - by Application
- 7.2.1. Packaging
- 7.2.1.1. Rigid
- 7.2.1.2. Flexible
- 7.2.2. Textiles
- 7.2.3. Consumer Goods
- 7.2.4. Automotive and Transportation
- 7.2.5. Agriculture and Horticulture
- 7.2.6. Building and Construction
- 7.2.7. Electrical and Electronics
- 7.2.8. Other Applications
- 7.2.1. Packaging
- 7.1. Market Analysis, Insights and Forecast - by Type
- 8. North America Bio-based Resins Industry Analysis, Insights and Forecast, 2020-2032
- 8.1. Market Analysis, Insights and Forecast - by Type
- 8.1.1. Biodegradable Starch Blends
- 8.1.2. Polylactic Acid (PLA)
- 8.1.3. Bio-polyethylene Terephthalate (Bio-PET)
- 8.1.4. Polyhydroxyalkanoate (PHA)
- 8.1.5. Bio-polyethylene (Bio-PE)
- 8.1.6. Biodegradable Polyesters
- 8.1.7. Other Types
- 8.2. Market Analysis, Insights and Forecast - by Application
- 8.2.1. Packaging
- 8.2.1.1. Rigid
- 8.2.1.2. Flexible
- 8.2.2. Textiles
- 8.2.3. Consumer Goods
- 8.2.4. Automotive and Transportation
- 8.2.5. Agriculture and Horticulture
- 8.2.6. Building and Construction
- 8.2.7. Electrical and Electronics
- 8.2.8. Other Applications
- 8.2.1. Packaging
- 8.1. Market Analysis, Insights and Forecast - by Type
- 9. Europe Bio-based Resins Industry Analysis, Insights and Forecast, 2020-2032
- 9.1. Market Analysis, Insights and Forecast - by Type
- 9.1.1. Biodegradable Starch Blends
- 9.1.2. Polylactic Acid (PLA)
- 9.1.3. Bio-polyethylene Terephthalate (Bio-PET)
- 9.1.4. Polyhydroxyalkanoate (PHA)
- 9.1.5. Bio-polyethylene (Bio-PE)
- 9.1.6. Biodegradable Polyesters
- 9.1.7. Other Types
- 9.2. Market Analysis, Insights and Forecast - by Application
- 9.2.1. Packaging
- 9.2.1.1. Rigid
- 9.2.1.2. Flexible
- 9.2.2. Textiles
- 9.2.3. Consumer Goods
- 9.2.4. Automotive and Transportation
- 9.2.5. Agriculture and Horticulture
- 9.2.6. Building and Construction
- 9.2.7. Electrical and Electronics
- 9.2.8. Other Applications
- 9.2.1. Packaging
- 9.1. Market Analysis, Insights and Forecast - by Type
- 10. South America Bio-based Resins Industry Analysis, Insights and Forecast, 2020-2032
- 10.1. Market Analysis, Insights and Forecast - by Type
- 10.1.1. Biodegradable Starch Blends
- 10.1.2. Polylactic Acid (PLA)
- 10.1.3. Bio-polyethylene Terephthalate (Bio-PET)
- 10.1.4. Polyhydroxyalkanoate (PHA)
- 10.1.5. Bio-polyethylene (Bio-PE)
- 10.1.6. Biodegradable Polyesters
- 10.1.7. Other Types
- 10.2. Market Analysis, Insights and Forecast - by Application
- 10.2.1. Packaging
- 10.2.1.1. Rigid
- 10.2.1.2. Flexible
- 10.2.2. Textiles
- 10.2.3. Consumer Goods
- 10.2.4. Automotive and Transportation
- 10.2.5. Agriculture and Horticulture
- 10.2.6. Building and Construction
- 10.2.7. Electrical and Electronics
- 10.2.8. Other Applications
- 10.2.1. Packaging
- 10.1. Market Analysis, Insights and Forecast - by Type
- 11. Middle East Bio-based Resins Industry Analysis, Insights and Forecast, 2020-2032
- 11.1. Market Analysis, Insights and Forecast - by Type
- 11.1.1. Biodegradable Starch Blends
- 11.1.2. Polylactic Acid (PLA)
- 11.1.3. Bio-polyethylene Terephthalate (Bio-PET)
- 11.1.4. Polyhydroxyalkanoate (PHA)
- 11.1.5. Bio-polyethylene (Bio-PE)
- 11.1.6. Biodegradable Polyesters
- 11.1.7. Other Types
- 11.2. Market Analysis, Insights and Forecast - by Application
- 11.2.1. Packaging
- 11.2.1.1. Rigid
- 11.2.1.2. Flexible
- 11.2.2. Textiles
- 11.2.3. Consumer Goods
- 11.2.4. Automotive and Transportation
- 11.2.5. Agriculture and Horticulture
- 11.2.6. Building and Construction
- 11.2.7. Electrical and Electronics
- 11.2.8. Other Applications
- 11.2.1. Packaging
- 11.1. Market Analysis, Insights and Forecast - by Type
- 12. Saudi Arabia Bio-based Resins Industry Analysis, Insights and Forecast, 2020-2032
- 12.1. Market Analysis, Insights and Forecast - by Type
- 12.1.1. Biodegradable Starch Blends
- 12.1.2. Polylactic Acid (PLA)
- 12.1.3. Bio-polyethylene Terephthalate (Bio-PET)
- 12.1.4. Polyhydroxyalkanoate (PHA)
- 12.1.5. Bio-polyethylene (Bio-PE)
- 12.1.6. Biodegradable Polyesters
- 12.1.7. Other Types
- 12.2. Market Analysis, Insights and Forecast - by Application
- 12.2.1. Packaging
- 12.2.1.1. Rigid
- 12.2.1.2. Flexible
- 12.2.2. Textiles
- 12.2.3. Consumer Goods
- 12.2.4. Automotive and Transportation
- 12.2.5. Agriculture and Horticulture
- 12.2.6. Building and Construction
- 12.2.7. Electrical and Electronics
- 12.2.8. Other Applications
- 12.2.1. Packaging
- 12.1. Market Analysis, Insights and Forecast - by Type
- 13. Competitive Analysis
- 13.1. Company Profiles
- 13.1.1 Novamont SpA
- 13.1.1.1. Company Overview
- 13.1.1.2. Products
- 13.1.1.3. Company Financials
- 13.1.1.4. SWOT Analysis
- 13.1.2 Futerro
- 13.1.2.1. Company Overview
- 13.1.2.2. Products
- 13.1.2.3. Company Financials
- 13.1.2.4. SWOT Analysis
- 13.1.3 Arkema SA
- 13.1.3.1. Company Overview
- 13.1.3.2. Products
- 13.1.3.3. Company Financials
- 13.1.3.4. SWOT Analysis
- 13.1.4 Braskem
- 13.1.4.1. Company Overview
- 13.1.4.2. Products
- 13.1.4.3. Company Financials
- 13.1.4.4. SWOT Analysis
- 13.1.5 Corbion
- 13.1.5.1. Company Overview
- 13.1.5.2. Products
- 13.1.5.3. Company Financials
- 13.1.5.4. SWOT Analysis
- 13.1.6 BASF SE
- 13.1.6.1. Company Overview
- 13.1.6.2. Products
- 13.1.6.3. Company Financials
- 13.1.6.4. SWOT Analysis
- 13.1.7 Trinseo
- 13.1.7.1. Company Overview
- 13.1.7.2. Products
- 13.1.7.3. Company Financials
- 13.1.7.4. SWOT Analysis
- 13.1.8 Biotec
- 13.1.8.1. Company Overview
- 13.1.8.2. Products
- 13.1.8.3. Company Financials
- 13.1.8.4. SWOT Analysis
- 13.1.9 Yield10 Bioscience Inc
- 13.1.9.1. Company Overview
- 13.1.9.2. Products
- 13.1.9.3. Company Financials
- 13.1.9.4. SWOT Analysis
- 13.1.10 DuPont
- 13.1.10.1. Company Overview
- 13.1.10.2. Products
- 13.1.10.3. Company Financials
- 13.1.10.4. SWOT Analysis
- 13.1.11 Minima
- 13.1.11.1. Company Overview
- 13.1.11.2. Products
- 13.1.11.3. Company Financials
- 13.1.11.4. SWOT Analysis
- 13.1.12 Natureworks LLC
- 13.1.12.1. Company Overview
- 13.1.12.2. Products
- 13.1.12.3. Company Financials
- 13.1.12.4. SWOT Analysis
- 13.1.13 Danimer Scientific
- 13.1.13.1. Company Overview
- 13.1.13.2. Products
- 13.1.13.3. Company Financials
- 13.1.13.4. SWOT Analysis
- 13.1.1 Novamont SpA
- 13.2. Market Entropy
- 13.2.1 Company's Key Areas Served
- 13.2.2 Recent Developments
- 13.3. Company Market Share Analysis 2025
- 13.3.1 Top 5 Companies Market Share Analysis
- 13.3.2 Top 3 Companies Market Share Analysis
- 13.4. List of Potential Customers
- 14. Research Methodology
List of Figures
- Figure 1: Global Bio-based Resins Industry Revenue Breakdown (billion, %) by Region 2025 & 2033
- Figure 2: Global Bio-based Resins Industry Volume Breakdown (K Tons, %) by Region 2025 & 2033
- Figure 3: Asia Pacific Bio-based Resins Industry Revenue (billion), by Type 2025 & 2033
- Figure 4: Asia Pacific Bio-based Resins Industry Volume (K Tons), by Type 2025 & 2033
- Figure 5: Asia Pacific Bio-based Resins Industry Revenue Share (%), by Type 2025 & 2033
- Figure 6: Asia Pacific Bio-based Resins Industry Volume Share (%), by Type 2025 & 2033
- Figure 7: Asia Pacific Bio-based Resins Industry Revenue (billion), by Application 2025 & 2033
- Figure 8: Asia Pacific Bio-based Resins Industry Volume (K Tons), by Application 2025 & 2033
- Figure 9: Asia Pacific Bio-based Resins Industry Revenue Share (%), by Application 2025 & 2033
- Figure 10: Asia Pacific Bio-based Resins Industry Volume Share (%), by Application 2025 & 2033
- Figure 11: Asia Pacific Bio-based Resins Industry Revenue (billion), by Country 2025 & 2033
- Figure 12: Asia Pacific Bio-based Resins Industry Volume (K Tons), by Country 2025 & 2033
- Figure 13: Asia Pacific Bio-based Resins Industry Revenue Share (%), by Country 2025 & 2033
- Figure 14: Asia Pacific Bio-based Resins Industry Volume Share (%), by Country 2025 & 2033
- Figure 15: North America Bio-based Resins Industry Revenue (billion), by Type 2025 & 2033
- Figure 16: North America Bio-based Resins Industry Volume (K Tons), by Type 2025 & 2033
- Figure 17: North America Bio-based Resins Industry Revenue Share (%), by Type 2025 & 2033
- Figure 18: North America Bio-based Resins Industry Volume Share (%), by Type 2025 & 2033
- Figure 19: North America Bio-based Resins Industry Revenue (billion), by Application 2025 & 2033
- Figure 20: North America Bio-based Resins Industry Volume (K Tons), by Application 2025 & 2033
- Figure 21: North America Bio-based Resins Industry Revenue Share (%), by Application 2025 & 2033
- Figure 22: North America Bio-based Resins Industry Volume Share (%), by Application 2025 & 2033
- Figure 23: North America Bio-based Resins Industry Revenue (billion), by Country 2025 & 2033
- Figure 24: North America Bio-based Resins Industry Volume (K Tons), by Country 2025 & 2033
- Figure 25: North America Bio-based Resins Industry Revenue Share (%), by Country 2025 & 2033
- Figure 26: North America Bio-based Resins Industry Volume Share (%), by Country 2025 & 2033
- Figure 27: Europe Bio-based Resins Industry Revenue (billion), by Type 2025 & 2033
- Figure 28: Europe Bio-based Resins Industry Volume (K Tons), by Type 2025 & 2033
- Figure 29: Europe Bio-based Resins Industry Revenue Share (%), by Type 2025 & 2033
- Figure 30: Europe Bio-based Resins Industry Volume Share (%), by Type 2025 & 2033
- Figure 31: Europe Bio-based Resins Industry Revenue (billion), by Application 2025 & 2033
- Figure 32: Europe Bio-based Resins Industry Volume (K Tons), by Application 2025 & 2033
- Figure 33: Europe Bio-based Resins Industry Revenue Share (%), by Application 2025 & 2033
- Figure 34: Europe Bio-based Resins Industry Volume Share (%), by Application 2025 & 2033
- Figure 35: Europe Bio-based Resins Industry Revenue (billion), by Country 2025 & 2033
- Figure 36: Europe Bio-based Resins Industry Volume (K Tons), by Country 2025 & 2033
- Figure 37: Europe Bio-based Resins Industry Revenue Share (%), by Country 2025 & 2033
- Figure 38: Europe Bio-based Resins Industry Volume Share (%), by Country 2025 & 2033
- Figure 39: South America Bio-based Resins Industry Revenue (billion), by Type 2025 & 2033
- Figure 40: South America Bio-based Resins Industry Volume (K Tons), by Type 2025 & 2033
- Figure 41: South America Bio-based Resins Industry Revenue Share (%), by Type 2025 & 2033
- Figure 42: South America Bio-based Resins Industry Volume Share (%), by Type 2025 & 2033
- Figure 43: South America Bio-based Resins Industry Revenue (billion), by Application 2025 & 2033
- Figure 44: South America Bio-based Resins Industry Volume (K Tons), by Application 2025 & 2033
- Figure 45: South America Bio-based Resins Industry Revenue Share (%), by Application 2025 & 2033
- Figure 46: South America Bio-based Resins Industry Volume Share (%), by Application 2025 & 2033
- Figure 47: South America Bio-based Resins Industry Revenue (billion), by Country 2025 & 2033
- Figure 48: South America Bio-based Resins Industry Volume (K Tons), by Country 2025 & 2033
- Figure 49: South America Bio-based Resins Industry Revenue Share (%), by Country 2025 & 2033
- Figure 50: South America Bio-based Resins Industry Volume Share (%), by Country 2025 & 2033
- Figure 51: Middle East Bio-based Resins Industry Revenue (billion), by Type 2025 & 2033
- Figure 52: Middle East Bio-based Resins Industry Volume (K Tons), by Type 2025 & 2033
- Figure 53: Middle East Bio-based Resins Industry Revenue Share (%), by Type 2025 & 2033
- Figure 54: Middle East Bio-based Resins Industry Volume Share (%), by Type 2025 & 2033
- Figure 55: Middle East Bio-based Resins Industry Revenue (billion), by Application 2025 & 2033
- Figure 56: Middle East Bio-based Resins Industry Volume (K Tons), by Application 2025 & 2033
- Figure 57: Middle East Bio-based Resins Industry Revenue Share (%), by Application 2025 & 2033
- Figure 58: Middle East Bio-based Resins Industry Volume Share (%), by Application 2025 & 2033
- Figure 59: Middle East Bio-based Resins Industry Revenue (billion), by Country 2025 & 2033
- Figure 60: Middle East Bio-based Resins Industry Volume (K Tons), by Country 2025 & 2033
- Figure 61: Middle East Bio-based Resins Industry Revenue Share (%), by Country 2025 & 2033
- Figure 62: Middle East Bio-based Resins Industry Volume Share (%), by Country 2025 & 2033
- Figure 63: Saudi Arabia Bio-based Resins Industry Revenue (billion), by Type 2025 & 2033
- Figure 64: Saudi Arabia Bio-based Resins Industry Volume (K Tons), by Type 2025 & 2033
- Figure 65: Saudi Arabia Bio-based Resins Industry Revenue Share (%), by Type 2025 & 2033
- Figure 66: Saudi Arabia Bio-based Resins Industry Volume Share (%), by Type 2025 & 2033
- Figure 67: Saudi Arabia Bio-based Resins Industry Revenue (billion), by Application 2025 & 2033
- Figure 68: Saudi Arabia Bio-based Resins Industry Volume (K Tons), by Application 2025 & 2033
- Figure 69: Saudi Arabia Bio-based Resins Industry Revenue Share (%), by Application 2025 & 2033
- Figure 70: Saudi Arabia Bio-based Resins Industry Volume Share (%), by Application 2025 & 2033
- Figure 71: Saudi Arabia Bio-based Resins Industry Revenue (billion), by Country 2025 & 2033
- Figure 72: Saudi Arabia Bio-based Resins Industry Volume (K Tons), by Country 2025 & 2033
- Figure 73: Saudi Arabia Bio-based Resins Industry Revenue Share (%), by Country 2025 & 2033
- Figure 74: Saudi Arabia Bio-based Resins Industry Volume Share (%), by Country 2025 & 2033
List of Tables
- Table 1: Global Bio-based Resins Industry Revenue billion Forecast, by Type 2020 & 2033
- Table 2: Global Bio-based Resins Industry Volume K Tons Forecast, by Type 2020 & 2033
- Table 3: Global Bio-based Resins Industry Revenue billion Forecast, by Application 2020 & 2033
- Table 4: Global Bio-based Resins Industry Volume K Tons Forecast, by Application 2020 & 2033
- Table 5: Global Bio-based Resins Industry Revenue billion Forecast, by Region 2020 & 2033
- Table 6: Global Bio-based Resins Industry Volume K Tons Forecast, by Region 2020 & 2033
- Table 7: Global Bio-based Resins Industry Revenue billion Forecast, by Type 2020 & 2033
- Table 8: Global Bio-based Resins Industry Volume K Tons Forecast, by Type 2020 & 2033
- Table 9: Global Bio-based Resins Industry Revenue billion Forecast, by Application 2020 & 2033
- Table 10: Global Bio-based Resins Industry Volume K Tons Forecast, by Application 2020 & 2033
- Table 11: Global Bio-based Resins Industry Revenue billion Forecast, by Country 2020 & 2033
- Table 12: Global Bio-based Resins Industry Volume K Tons Forecast, by Country 2020 & 2033
- Table 13: China Bio-based Resins Industry Revenue (billion) Forecast, by Application 2020 & 2033
- Table 14: China Bio-based Resins Industry Volume (K Tons) Forecast, by Application 2020 & 2033
- Table 15: India Bio-based Resins Industry Revenue (billion) Forecast, by Application 2020 & 2033
- Table 16: India Bio-based Resins Industry Volume (K Tons) Forecast, by Application 2020 & 2033
- Table 17: Japan Bio-based Resins Industry Revenue (billion) Forecast, by Application 2020 & 2033
- Table 18: Japan Bio-based Resins Industry Volume (K Tons) Forecast, by Application 2020 & 2033
- Table 19: South Korea Bio-based Resins Industry Revenue (billion) Forecast, by Application 2020 & 2033
- Table 20: South Korea Bio-based Resins Industry Volume (K Tons) Forecast, by Application 2020 & 2033
- Table 21: Rest of Asia Pacific Bio-based Resins Industry Revenue (billion) Forecast, by Application 2020 & 2033
- Table 22: Rest of Asia Pacific Bio-based Resins Industry Volume (K Tons) Forecast, by Application 2020 & 2033
- Table 23: Global Bio-based Resins Industry Revenue billion Forecast, by Type 2020 & 2033
- Table 24: Global Bio-based Resins Industry Volume K Tons Forecast, by Type 2020 & 2033
- Table 25: Global Bio-based Resins Industry Revenue billion Forecast, by Application 2020 & 2033
- Table 26: Global Bio-based Resins Industry Volume K Tons Forecast, by Application 2020 & 2033
- Table 27: Global Bio-based Resins Industry Revenue billion Forecast, by Country 2020 & 2033
- Table 28: Global Bio-based Resins Industry Volume K Tons Forecast, by Country 2020 & 2033
- Table 29: United States Bio-based Resins Industry Revenue (billion) Forecast, by Application 2020 & 2033
- Table 30: United States Bio-based Resins Industry Volume (K Tons) Forecast, by Application 2020 & 2033
- Table 31: Canada Bio-based Resins Industry Revenue (billion) Forecast, by Application 2020 & 2033
- Table 32: Canada Bio-based Resins Industry Volume (K Tons) Forecast, by Application 2020 & 2033
- Table 33: Mexico Bio-based Resins Industry Revenue (billion) Forecast, by Application 2020 & 2033
- Table 34: Mexico Bio-based Resins Industry Volume (K Tons) Forecast, by Application 2020 & 2033
- Table 35: Global Bio-based Resins Industry Revenue billion Forecast, by Type 2020 & 2033
- Table 36: Global Bio-based Resins Industry Volume K Tons Forecast, by Type 2020 & 2033
- Table 37: Global Bio-based Resins Industry Revenue billion Forecast, by Application 2020 & 2033
- Table 38: Global Bio-based Resins Industry Volume K Tons Forecast, by Application 2020 & 2033
- Table 39: Global Bio-based Resins Industry Revenue billion Forecast, by Country 2020 & 2033
- Table 40: Global Bio-based Resins Industry Volume K Tons Forecast, by Country 2020 & 2033
- Table 41: Germany Bio-based Resins Industry Revenue (billion) Forecast, by Application 2020 & 2033
- Table 42: Germany Bio-based Resins Industry Volume (K Tons) Forecast, by Application 2020 & 2033
- Table 43: United Kingdom Bio-based Resins Industry Revenue (billion) Forecast, by Application 2020 & 2033
- Table 44: United Kingdom Bio-based Resins Industry Volume (K Tons) Forecast, by Application 2020 & 2033
- Table 45: France Bio-based Resins Industry Revenue (billion) Forecast, by Application 2020 & 2033
- Table 46: France Bio-based Resins Industry Volume (K Tons) Forecast, by Application 2020 & 2033
- Table 47: Italy Bio-based Resins Industry Revenue (billion) Forecast, by Application 2020 & 2033
- Table 48: Italy Bio-based Resins Industry Volume (K Tons) Forecast, by Application 2020 & 2033
- Table 49: Rest of Europe Bio-based Resins Industry Revenue (billion) Forecast, by Application 2020 & 2033
- Table 50: Rest of Europe Bio-based Resins Industry Volume (K Tons) Forecast, by Application 2020 & 2033
- Table 51: Global Bio-based Resins Industry Revenue billion Forecast, by Type 2020 & 2033
- Table 52: Global Bio-based Resins Industry Volume K Tons Forecast, by Type 2020 & 2033
- Table 53: Global Bio-based Resins Industry Revenue billion Forecast, by Application 2020 & 2033
- Table 54: Global Bio-based Resins Industry Volume K Tons Forecast, by Application 2020 & 2033
- Table 55: Global Bio-based Resins Industry Revenue billion Forecast, by Country 2020 & 2033
- Table 56: Global Bio-based Resins Industry Volume K Tons Forecast, by Country 2020 & 2033
- Table 57: Brazil Bio-based Resins Industry Revenue (billion) Forecast, by Application 2020 & 2033
- Table 58: Brazil Bio-based Resins Industry Volume (K Tons) Forecast, by Application 2020 & 2033
- Table 59: Argentina Bio-based Resins Industry Revenue (billion) Forecast, by Application 2020 & 2033
- Table 60: Argentina Bio-based Resins Industry Volume (K Tons) Forecast, by Application 2020 & 2033
- Table 61: Rest of South America Bio-based Resins Industry Revenue (billion) Forecast, by Application 2020 & 2033
- Table 62: Rest of South America Bio-based Resins Industry Volume (K Tons) Forecast, by Application 2020 & 2033
- Table 63: Global Bio-based Resins Industry Revenue billion Forecast, by Type 2020 & 2033
- Table 64: Global Bio-based Resins Industry Volume K Tons Forecast, by Type 2020 & 2033
- Table 65: Global Bio-based Resins Industry Revenue billion Forecast, by Application 2020 & 2033
- Table 66: Global Bio-based Resins Industry Volume K Tons Forecast, by Application 2020 & 2033
- Table 67: Global Bio-based Resins Industry Revenue billion Forecast, by Country 2020 & 2033
- Table 68: Global Bio-based Resins Industry Volume K Tons Forecast, by Country 2020 & 2033
- Table 69: Global Bio-based Resins Industry Revenue billion Forecast, by Type 2020 & 2033
- Table 70: Global Bio-based Resins Industry Volume K Tons Forecast, by Type 2020 & 2033
- Table 71: Global Bio-based Resins Industry Revenue billion Forecast, by Application 2020 & 2033
- Table 72: Global Bio-based Resins Industry Volume K Tons Forecast, by Application 2020 & 2033
- Table 73: Global Bio-based Resins Industry Revenue billion Forecast, by Country 2020 & 2033
- Table 74: Global Bio-based Resins Industry Volume K Tons Forecast, by Country 2020 & 2033
- Table 75: South Africa Bio-based Resins Industry Revenue (billion) Forecast, by Application 2020 & 2033
- Table 76: South Africa Bio-based Resins Industry Volume (K Tons) Forecast, by Application 2020 & 2033
- Table 77: Rest of Middle East Bio-based Resins Industry Revenue (billion) Forecast, by Application 2020 & 2033
- Table 78: Rest of Middle East Bio-based Resins Industry Volume (K Tons) Forecast, by Application 2020 & 2033
Frequently Asked Questions
1. What is the projected Compound Annual Growth Rate (CAGR) of the Bio-based Resins Industry?
The projected CAGR is approximately 9%.
2. Which companies are prominent players in the Bio-based Resins Industry?
Key companies in the market include Novamont SpA, Futerro, Arkema SA, Braskem, Corbion, BASF SE, Trinseo, Biotec, Yield10 Bioscience Inc, DuPont, Minima, Natureworks LLC, Danimer Scientific.
3. What are the main segments of the Bio-based Resins Industry?
The market segments include Type, Application.
4. Can you provide details about the market size?
The market size is estimated to be USD 1.4 billion as of 2022.
5. What are some drivers contributing to market growth?
; Environmental Factors Encouraging a Paradigm Shift; Surging Demand for Bioplastics in Flexible Packaging.
6. What are the notable trends driving market growth?
Flexible Packaging Segment to Dominate the Market Demand.
7. Are there any restraints impacting market growth?
; Lack of Awareness and High Cost Association; Availability of Cheaper Alternatives.
8. Can you provide examples of recent developments in the market?
N/A
9. What pricing options are available for accessing the report?
Pricing options include single-user, multi-user, and enterprise licenses priced at USD 4750, USD 5250, and USD 8750 respectively.
10. Is the market size provided in terms of value or volume?
The market size is provided in terms of value, measured in billion and volume, measured in K Tons.
11. Are there any specific market keywords associated with the report?
Yes, the market keyword associated with the report is "Bio-based Resins Industry," which aids in identifying and referencing the specific market segment covered.
12. How do I determine which pricing option suits my needs best?
The pricing options vary based on user requirements and access needs. Individual users may opt for single-user licenses, while businesses requiring broader access may choose multi-user or enterprise licenses for cost-effective access to the report.
13. Are there any additional resources or data provided in the Bio-based Resins Industry report?
While the report offers comprehensive insights, it's advisable to review the specific contents or supplementary materials provided to ascertain if additional resources or data are available.
14. How can I stay updated on further developments or reports in the Bio-based Resins Industry?
To stay informed about further developments, trends, and reports in the Bio-based Resins Industry, consider subscribing to industry newsletters, following relevant companies and organizations, or regularly checking reputable industry news sources and publications.
Methodology
Step 1 - Identification of Relevant Samples Size from Population Database


Step 2 - Approaches for Defining Global Market Size (Value, Volume* & Price*)

Note*: In applicable scenarios
Step 3 - Data Sources
Primary Research
- Web Analytics
- Survey Reports
- Research Institute
- Latest Research Reports
- Opinion Leaders
Secondary Research
- Annual Reports
- White Paper
- Latest Press Release
- Industry Association
- Paid Database
- Investor Presentations

Step 4 - Data Triangulation
Involves using different sources of information in order to increase the validity of a study
These sources are likely to be stakeholders in a program - participants, other researchers, program staff, other community members, and so on.
Then we put all data in single framework & apply various statistical tools to find out the dynamic on the market.
During the analysis stage, feedback from the stakeholder groups would be compared to determine areas of agreement as well as areas of divergence