

Key Insights
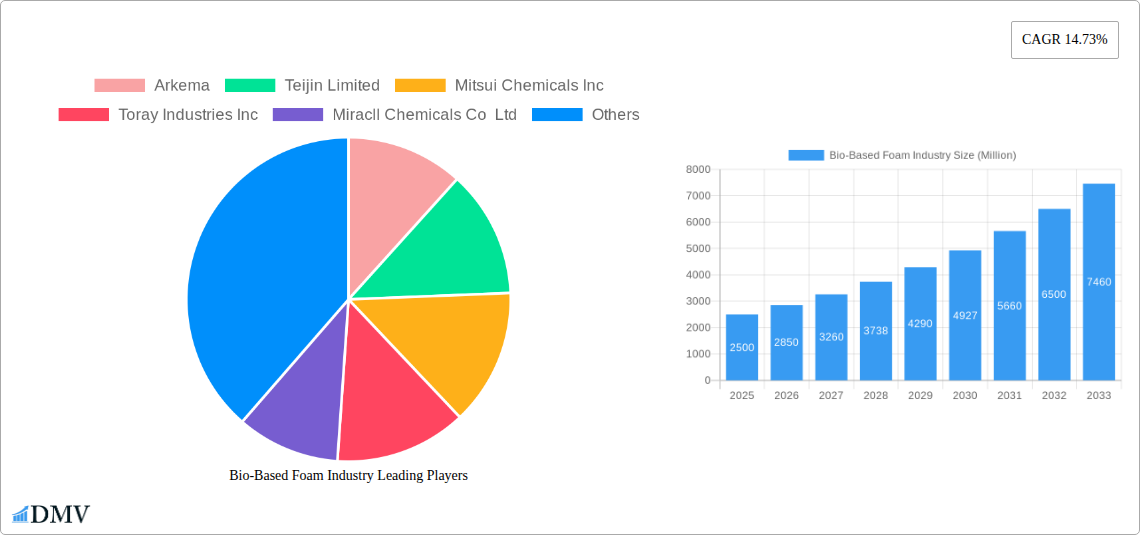
The bio-based foam market is experiencing robust growth, driven by increasing environmental concerns and stringent regulations surrounding traditional petroleum-based foams. The market's Compound Annual Growth Rate (CAGR) of 14.73% from 2019-2024 indicates significant expansion, projected to continue into the forecast period (2025-2033). Key drivers include the rising demand for sustainable and eco-friendly materials across various end-use industries, including packaging, furniture, and transportation. Consumers are increasingly seeking products with reduced carbon footprints, creating a strong market pull for bio-based alternatives. Furthermore, advancements in bio-based polyurethane technology are leading to improved foam properties, such as enhanced durability and performance, making them competitive with conventional options. While challenges remain, such as higher initial production costs compared to petroleum-based foams and the need for further research and development to achieve consistent quality across various applications, the long-term growth outlook remains positive.
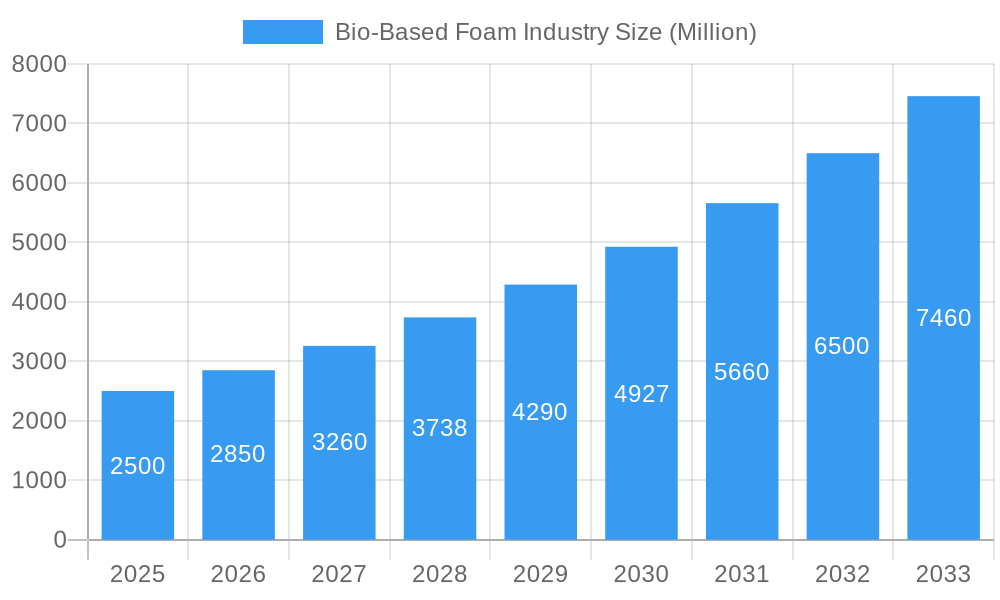
Bio-Based Foam Industry Market Size (In Billion)
Segment-wise, the applications of bio-based foams are diverse, spanning from flexible foams for cushioning and insulation to rigid foams used in construction. The strong growth is distributed across several end-user industries; the transportation sector is a key market due to the automotive industry's push for lightweight, sustainable materials. Similarly, the furniture and bedding sector leverages the comfort and eco-friendly aspects of bio-based foams. The geographical distribution of the market shows strong presence across North America, Europe, and Asia-Pacific, with China and the US leading the demand. Major players such as Arkema, BASF, and Huntsman are investing heavily in R&D and expanding their production capacities to meet the rising global demand. This competitive landscape fosters innovation and ensures the consistent development of superior bio-based foam products.
Bio-Based Foam Industry Company Market Share
Bio-Based Foam Industry: A Comprehensive Market Report (2019-2033)
This insightful report provides a detailed analysis of the Bio-Based Foam industry, projecting a market value exceeding $XX Million by 2033. The study covers the historical period (2019-2024), the base year (2025), and forecasts until 2033, offering a comprehensive view of market dynamics, growth drivers, and challenges. Key players like Arkema, Teijin Limited, Mitsui Chemicals Inc, and BASF SE are profiled, along with a deep dive into key segments like foams, coatings, and adhesives. This report is essential for stakeholders seeking strategic insights and investment opportunities in this rapidly evolving market.
Bio-Based Foam Industry Market Composition & Trends
The Bio-Based Foam market is characterized by moderate concentration, with several major players holding significant market share. Arkema, BASF SE, and Covestro AG collectively account for approximately XX% of the global market. Market share distribution is expected to evolve due to ongoing M&A activities and the emergence of innovative bio-based solutions. The total value of M&A deals within the industry during the historical period reached approximately $XX Million. Innovation is driven by stringent environmental regulations, the increasing demand for sustainable materials, and the development of high-performance bio-based polymers. Key substitute products include conventional petroleum-based foams, but their market share is steadily decreasing due to growing environmental concerns. End-user industries vary significantly, with Transportation, Construction, and Packaging being the most prominent, accounting for a combined XX% of market demand.
- Market Concentration: Moderately concentrated, with top players holding XX% market share.
- Innovation Catalysts: Stringent environmental regulations, demand for sustainable materials, advancements in bio-based polymer technology.
- Regulatory Landscape: Increasingly stringent regulations favoring bio-based materials.
- Substitute Products: Conventional petroleum-based foams.
- End-User Profiles: Transportation, Construction, Packaging, Footwear & Textile, Furniture & Bedding, Electronics, Biomedical, and Fertilizer industries.
- M&A Activities: Total value of M&A deals (2019-2024): $XX Million
Bio-Based Foam Industry Industry Evolution
The Bio-Based Foam industry has witnessed substantial growth over the past five years, with a Compound Annual Growth Rate (CAGR) of approximately XX% during the historical period (2019-2024). This growth is primarily fueled by increasing consumer awareness of environmental issues and a growing preference for eco-friendly products. Technological advancements, including the development of novel bio-based polymers with enhanced performance characteristics, are further propelling market expansion. The adoption rate of bio-based foams in various end-user applications is steadily increasing, driven by favorable government policies and incentives promoting sustainability. We project a CAGR of XX% during the forecast period (2025-2033), resulting in a market size exceeding $XX Million by 2033. This growth trajectory is expected to continue, driven by ongoing technological innovations and an intensifying focus on environmental sustainability across various industries. Shifting consumer demands towards eco-conscious products also serve as a major catalyst for this expansion.
Leading Regions, Countries, or Segments in Bio-Based Foam Industry
North America currently holds the leading position in the bio-based foam market, driven by strong regulatory support for sustainable materials and significant investments in research and development. Within applications, the Foams segment dominates, representing approximately XX% of the total market value, followed by Coatings and Adhesives & Sealants. In end-user industries, the Transportation and Construction sectors are leading the adoption of bio-based foams due to their lightweight and insulating properties.
- Key Drivers for North America Dominance: Strong regulatory support for sustainable materials, significant R&D investments, and established manufacturing infrastructure.
- Key Drivers for Foams Segment Dominance: Versatility, cost-effectiveness, and wide range of applications.
- Key Drivers for Transportation Sector Dominance: Growing demand for lightweight and fuel-efficient vehicles, improved insulation properties, and increasing awareness of sustainability in the automotive industry.
- Key Drivers for Construction Sector Dominance: Need for energy-efficient buildings, improved insulation properties, and increasing emphasis on sustainable construction practices.
Bio-Based Foam Industry Product Innovations
Recent innovations have focused on enhancing the performance characteristics of bio-based foams, including improved thermal insulation, increased strength, and better water resistance. New bio-based polyurethane formulations are being developed, offering superior properties compared to their petroleum-based counterparts. These advancements are driving the adoption of bio-based foams in diverse applications, expanding market penetration beyond traditional segments. Unique selling propositions include improved sustainability profiles, reduced environmental impact, and enhanced performance in specific applications.
Propelling Factors for Bio-Based Foam Industry Growth
The growth of the bio-based foam industry is propelled by several factors. Firstly, increasing environmental regulations are pushing companies towards sustainable alternatives to traditional petroleum-based foams. Secondly, the rising consumer demand for eco-friendly products drives market growth. Thirdly, technological advancements in bio-based polymer synthesis are leading to cost-effective and high-performance materials. Finally, government incentives and subsidies are encouraging wider adoption of bio-based foams across various sectors.
Obstacles in the Bio-Based Foam Industry Market
Despite its growth potential, the bio-based foam industry faces challenges. The higher initial cost of bio-based foams compared to conventional alternatives is a significant barrier to wider adoption. Supply chain disruptions and fluctuations in raw material prices can also impact production costs and profitability. Furthermore, intense competition from established players in the traditional foam market presents a continuous challenge.
Future Opportunities in Bio-Based Foam Industry
Significant opportunities exist for the bio-based foam industry. Emerging applications in packaging, biomedical devices, and advanced construction materials offer substantial growth potential. Technological advancements focusing on improving performance characteristics and reducing production costs will further expand market reach. The increasing focus on circular economy principles opens avenues for innovative recycling and reuse strategies, creating new market opportunities.
Major Players in the Bio-Based Foam Industry Ecosystem
- Arkema
- Teijin Limited
- Mitsui Chemicals Inc
- Toray Industries Inc
- Miracll Chemicals Co Ltd
- BASF SE
- Huntsman International LLC
- Woodbridge
- Stahl Holdings BV
- The Lubrizol Corporation
- Covestro AG
Key Developments in Bio-Based Foam Industry Industry
- October 2022: Carbon's EPU 44 won the 2022 Polyurethane Innovation Award, highlighting advancements in bio-based polyurethane technology.
- November 2022: Covestro AG and Coleitec formed a strategic partnership to accelerate the development of polyurethane composite materials, signifying increased industry collaboration.
Strategic Bio-Based Foam Industry Market Forecast
The bio-based foam market is poised for significant growth, driven by increasing demand for sustainable materials, technological advancements, and favorable regulatory landscapes. Future opportunities lie in expanding into new applications and further improving the performance characteristics of bio-based foams to compete effectively with traditional alternatives. The market is expected to experience robust growth, exceeding $XX Million by 2033, presenting lucrative opportunities for investors and industry players.
Bio-Based Foam Industry Segmentation
-
1. Application
- 1.1. Foams
- 1.2. Coatings
- 1.3. Adhesive and Sealants
- 1.4. Other Ap
-
2. End-user Industry
- 2.1. Transportation
- 2.2. Footwear and Textile
- 2.3. Construction
- 2.4. Packaging
- 2.5. Furniture and Bedding
- 2.6. Electronics
- 2.7. Other En
Bio-Based Foam Industry Segmentation By Geography
-
1. Asia Pacific
- 1.1. China
- 1.2. India
- 1.3. Japan
- 1.4. South Korea
- 1.5. Rest of Asia Pacific
-
2. North America
- 2.1. United States
- 2.2. Canada
- 2.3. Mexico
-
3. Europe
- 3.1. Germany
- 3.2. United Kingdom
- 3.3. Italy
- 3.4. France
- 3.5. Spain
- 3.6. Rest of Europe
-
4. Rest of the World
- 4.1. Brazil
- 4.2. Saudi Arabia
- 4.3. South Africa
- 4.4. Rest of the Countries
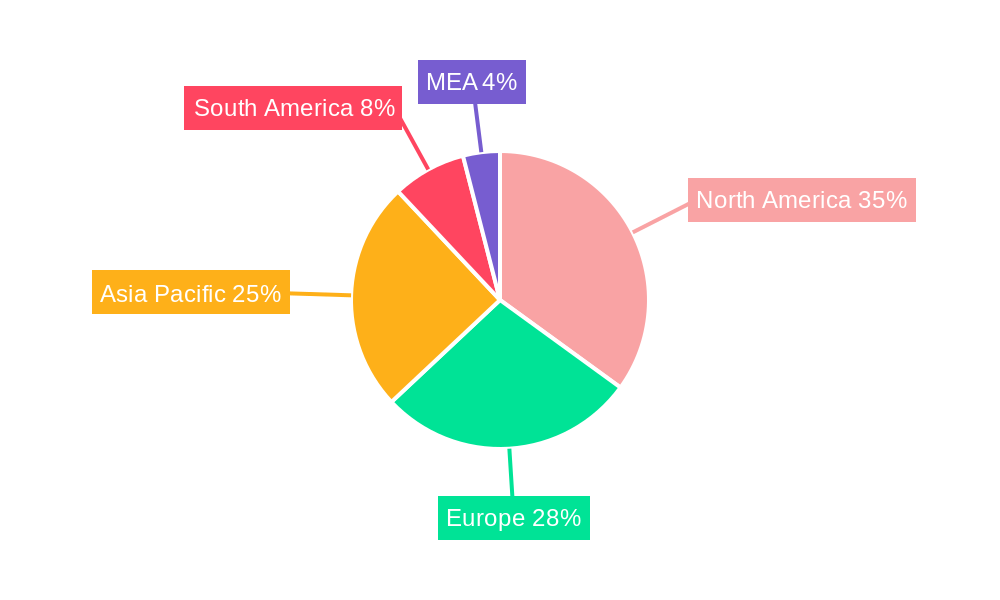
Bio-Based Foam Industry Regional Market Share
Geographic Coverage of Bio-Based Foam Industry
Bio-Based Foam Industry REPORT HIGHLIGHTS
| Aspects | Details |
|---|---|
| Study Period | 2020-2034 |
| Base Year | 2025 |
| Estimated Year | 2026 |
| Forecast Period | 2026-2034 |
| Historical Period | 2020-2025 |
| Growth Rate | CAGR of 5.9% from 2020-2034 |
| Segmentation |
|
Table of Contents
- 1. Introduction
- 1.1. Research Scope
- 1.2. Market Segmentation
- 1.3. Research Methodology
- 1.4. Definitions and Assumptions
- 2. Executive Summary
- 2.1. Introduction
- 3. Market Dynamics
- 3.1. Introduction
- 3.2. Market Drivers
- 3.2.1. Increasing Demand from the Construction Industry in Developing Countries; Growing Demand from Electronic Appliance Manufacturing.; Other Drivers
- 3.3. Market Restrains
- 3.3.1. High Cost of Bio-based Materials; Other Restraints
- 3.4. Market Trends
- 3.4.1. Increasing Demand from the Transportation Industry
- 4. Market Factor Analysis
- 4.1. Porters Five Forces
- 4.2. Supply/Value Chain
- 4.3. PESTEL analysis
- 4.4. Market Entropy
- 4.5. Patent/Trademark Analysis
- 5. Global Bio-Based Foam Industry Analysis, Insights and Forecast, 2020-2032
- 5.1. Market Analysis, Insights and Forecast - by Application
- 5.1.1. Foams
- 5.1.2. Coatings
- 5.1.3. Adhesive and Sealants
- 5.1.4. Other Ap
- 5.2. Market Analysis, Insights and Forecast - by End-user Industry
- 5.2.1. Transportation
- 5.2.2. Footwear and Textile
- 5.2.3. Construction
- 5.2.4. Packaging
- 5.2.5. Furniture and Bedding
- 5.2.6. Electronics
- 5.2.7. Other En
- 5.3. Market Analysis, Insights and Forecast - by Region
- 5.3.1. Asia Pacific
- 5.3.2. North America
- 5.3.3. Europe
- 5.3.4. Rest of the World
- 5.1. Market Analysis, Insights and Forecast - by Application
- 6. Asia Pacific Bio-Based Foam Industry Analysis, Insights and Forecast, 2020-2032
- 6.1. Market Analysis, Insights and Forecast - by Application
- 6.1.1. Foams
- 6.1.2. Coatings
- 6.1.3. Adhesive and Sealants
- 6.1.4. Other Ap
- 6.2. Market Analysis, Insights and Forecast - by End-user Industry
- 6.2.1. Transportation
- 6.2.2. Footwear and Textile
- 6.2.3. Construction
- 6.2.4. Packaging
- 6.2.5. Furniture and Bedding
- 6.2.6. Electronics
- 6.2.7. Other En
- 6.1. Market Analysis, Insights and Forecast - by Application
- 7. North America Bio-Based Foam Industry Analysis, Insights and Forecast, 2020-2032
- 7.1. Market Analysis, Insights and Forecast - by Application
- 7.1.1. Foams
- 7.1.2. Coatings
- 7.1.3. Adhesive and Sealants
- 7.1.4. Other Ap
- 7.2. Market Analysis, Insights and Forecast - by End-user Industry
- 7.2.1. Transportation
- 7.2.2. Footwear and Textile
- 7.2.3. Construction
- 7.2.4. Packaging
- 7.2.5. Furniture and Bedding
- 7.2.6. Electronics
- 7.2.7. Other En
- 7.1. Market Analysis, Insights and Forecast - by Application
- 8. Europe Bio-Based Foam Industry Analysis, Insights and Forecast, 2020-2032
- 8.1. Market Analysis, Insights and Forecast - by Application
- 8.1.1. Foams
- 8.1.2. Coatings
- 8.1.3. Adhesive and Sealants
- 8.1.4. Other Ap
- 8.2. Market Analysis, Insights and Forecast - by End-user Industry
- 8.2.1. Transportation
- 8.2.2. Footwear and Textile
- 8.2.3. Construction
- 8.2.4. Packaging
- 8.2.5. Furniture and Bedding
- 8.2.6. Electronics
- 8.2.7. Other En
- 8.1. Market Analysis, Insights and Forecast - by Application
- 9. Rest of the World Bio-Based Foam Industry Analysis, Insights and Forecast, 2020-2032
- 9.1. Market Analysis, Insights and Forecast - by Application
- 9.1.1. Foams
- 9.1.2. Coatings
- 9.1.3. Adhesive and Sealants
- 9.1.4. Other Ap
- 9.2. Market Analysis, Insights and Forecast - by End-user Industry
- 9.2.1. Transportation
- 9.2.2. Footwear and Textile
- 9.2.3. Construction
- 9.2.4. Packaging
- 9.2.5. Furniture and Bedding
- 9.2.6. Electronics
- 9.2.7. Other En
- 9.1. Market Analysis, Insights and Forecast - by Application
- 10. Competitive Analysis
- 10.1. Global Market Share Analysis 2025
- 10.2. Company Profiles
- 10.2.1 Arkema
- 10.2.1.1. Overview
- 10.2.1.2. Products
- 10.2.1.3. SWOT Analysis
- 10.2.1.4. Recent Developments
- 10.2.1.5. Financials (Based on Availability)
- 10.2.2 Teijin Limited
- 10.2.2.1. Overview
- 10.2.2.2. Products
- 10.2.2.3. SWOT Analysis
- 10.2.2.4. Recent Developments
- 10.2.2.5. Financials (Based on Availability)
- 10.2.3 Mitsui Chemicals Inc
- 10.2.3.1. Overview
- 10.2.3.2. Products
- 10.2.3.3. SWOT Analysis
- 10.2.3.4. Recent Developments
- 10.2.3.5. Financials (Based on Availability)
- 10.2.4 Toray Industries Inc
- 10.2.4.1. Overview
- 10.2.4.2. Products
- 10.2.4.3. SWOT Analysis
- 10.2.4.4. Recent Developments
- 10.2.4.5. Financials (Based on Availability)
- 10.2.5 Miracll Chemicals Co Ltd
- 10.2.5.1. Overview
- 10.2.5.2. Products
- 10.2.5.3. SWOT Analysis
- 10.2.5.4. Recent Developments
- 10.2.5.5. Financials (Based on Availability)
- 10.2.6 BASF SE
- 10.2.6.1. Overview
- 10.2.6.2. Products
- 10.2.6.3. SWOT Analysis
- 10.2.6.4. Recent Developments
- 10.2.6.5. Financials (Based on Availability)
- 10.2.7 Huntsman International LLC
- 10.2.7.1. Overview
- 10.2.7.2. Products
- 10.2.7.3. SWOT Analysis
- 10.2.7.4. Recent Developments
- 10.2.7.5. Financials (Based on Availability)
- 10.2.8 Woodbridge
- 10.2.8.1. Overview
- 10.2.8.2. Products
- 10.2.8.3. SWOT Analysis
- 10.2.8.4. Recent Developments
- 10.2.8.5. Financials (Based on Availability)
- 10.2.9 Stahl Holdings BV
- 10.2.9.1. Overview
- 10.2.9.2. Products
- 10.2.9.3. SWOT Analysis
- 10.2.9.4. Recent Developments
- 10.2.9.5. Financials (Based on Availability)
- 10.2.10 The Lubrizol Corporation
- 10.2.10.1. Overview
- 10.2.10.2. Products
- 10.2.10.3. SWOT Analysis
- 10.2.10.4. Recent Developments
- 10.2.10.5. Financials (Based on Availability)
- 10.2.11 Covestro AG
- 10.2.11.1. Overview
- 10.2.11.2. Products
- 10.2.11.3. SWOT Analysis
- 10.2.11.4. Recent Developments
- 10.2.11.5. Financials (Based on Availability)
- 10.2.1 Arkema
List of Figures
- Figure 1: Global Bio-Based Foam Industry Revenue Breakdown (undefined, %) by Region 2025 & 2033
- Figure 2: Global Bio-Based Foam Industry Volume Breakdown (kilotons, %) by Region 2025 & 2033
- Figure 3: Asia Pacific Bio-Based Foam Industry Revenue (undefined), by Application 2025 & 2033
- Figure 4: Asia Pacific Bio-Based Foam Industry Volume (kilotons), by Application 2025 & 2033
- Figure 5: Asia Pacific Bio-Based Foam Industry Revenue Share (%), by Application 2025 & 2033
- Figure 6: Asia Pacific Bio-Based Foam Industry Volume Share (%), by Application 2025 & 2033
- Figure 7: Asia Pacific Bio-Based Foam Industry Revenue (undefined), by End-user Industry 2025 & 2033
- Figure 8: Asia Pacific Bio-Based Foam Industry Volume (kilotons), by End-user Industry 2025 & 2033
- Figure 9: Asia Pacific Bio-Based Foam Industry Revenue Share (%), by End-user Industry 2025 & 2033
- Figure 10: Asia Pacific Bio-Based Foam Industry Volume Share (%), by End-user Industry 2025 & 2033
- Figure 11: Asia Pacific Bio-Based Foam Industry Revenue (undefined), by Country 2025 & 2033
- Figure 12: Asia Pacific Bio-Based Foam Industry Volume (kilotons), by Country 2025 & 2033
- Figure 13: Asia Pacific Bio-Based Foam Industry Revenue Share (%), by Country 2025 & 2033
- Figure 14: Asia Pacific Bio-Based Foam Industry Volume Share (%), by Country 2025 & 2033
- Figure 15: North America Bio-Based Foam Industry Revenue (undefined), by Application 2025 & 2033
- Figure 16: North America Bio-Based Foam Industry Volume (kilotons), by Application 2025 & 2033
- Figure 17: North America Bio-Based Foam Industry Revenue Share (%), by Application 2025 & 2033
- Figure 18: North America Bio-Based Foam Industry Volume Share (%), by Application 2025 & 2033
- Figure 19: North America Bio-Based Foam Industry Revenue (undefined), by End-user Industry 2025 & 2033
- Figure 20: North America Bio-Based Foam Industry Volume (kilotons), by End-user Industry 2025 & 2033
- Figure 21: North America Bio-Based Foam Industry Revenue Share (%), by End-user Industry 2025 & 2033
- Figure 22: North America Bio-Based Foam Industry Volume Share (%), by End-user Industry 2025 & 2033
- Figure 23: North America Bio-Based Foam Industry Revenue (undefined), by Country 2025 & 2033
- Figure 24: North America Bio-Based Foam Industry Volume (kilotons), by Country 2025 & 2033
- Figure 25: North America Bio-Based Foam Industry Revenue Share (%), by Country 2025 & 2033
- Figure 26: North America Bio-Based Foam Industry Volume Share (%), by Country 2025 & 2033
- Figure 27: Europe Bio-Based Foam Industry Revenue (undefined), by Application 2025 & 2033
- Figure 28: Europe Bio-Based Foam Industry Volume (kilotons), by Application 2025 & 2033
- Figure 29: Europe Bio-Based Foam Industry Revenue Share (%), by Application 2025 & 2033
- Figure 30: Europe Bio-Based Foam Industry Volume Share (%), by Application 2025 & 2033
- Figure 31: Europe Bio-Based Foam Industry Revenue (undefined), by End-user Industry 2025 & 2033
- Figure 32: Europe Bio-Based Foam Industry Volume (kilotons), by End-user Industry 2025 & 2033
- Figure 33: Europe Bio-Based Foam Industry Revenue Share (%), by End-user Industry 2025 & 2033
- Figure 34: Europe Bio-Based Foam Industry Volume Share (%), by End-user Industry 2025 & 2033
- Figure 35: Europe Bio-Based Foam Industry Revenue (undefined), by Country 2025 & 2033
- Figure 36: Europe Bio-Based Foam Industry Volume (kilotons), by Country 2025 & 2033
- Figure 37: Europe Bio-Based Foam Industry Revenue Share (%), by Country 2025 & 2033
- Figure 38: Europe Bio-Based Foam Industry Volume Share (%), by Country 2025 & 2033
- Figure 39: Rest of the World Bio-Based Foam Industry Revenue (undefined), by Application 2025 & 2033
- Figure 40: Rest of the World Bio-Based Foam Industry Volume (kilotons), by Application 2025 & 2033
- Figure 41: Rest of the World Bio-Based Foam Industry Revenue Share (%), by Application 2025 & 2033
- Figure 42: Rest of the World Bio-Based Foam Industry Volume Share (%), by Application 2025 & 2033
- Figure 43: Rest of the World Bio-Based Foam Industry Revenue (undefined), by End-user Industry 2025 & 2033
- Figure 44: Rest of the World Bio-Based Foam Industry Volume (kilotons), by End-user Industry 2025 & 2033
- Figure 45: Rest of the World Bio-Based Foam Industry Revenue Share (%), by End-user Industry 2025 & 2033
- Figure 46: Rest of the World Bio-Based Foam Industry Volume Share (%), by End-user Industry 2025 & 2033
- Figure 47: Rest of the World Bio-Based Foam Industry Revenue (undefined), by Country 2025 & 2033
- Figure 48: Rest of the World Bio-Based Foam Industry Volume (kilotons), by Country 2025 & 2033
- Figure 49: Rest of the World Bio-Based Foam Industry Revenue Share (%), by Country 2025 & 2033
- Figure 50: Rest of the World Bio-Based Foam Industry Volume Share (%), by Country 2025 & 2033
List of Tables
- Table 1: Global Bio-Based Foam Industry Revenue undefined Forecast, by Application 2020 & 2033
- Table 2: Global Bio-Based Foam Industry Volume kilotons Forecast, by Application 2020 & 2033
- Table 3: Global Bio-Based Foam Industry Revenue undefined Forecast, by End-user Industry 2020 & 2033
- Table 4: Global Bio-Based Foam Industry Volume kilotons Forecast, by End-user Industry 2020 & 2033
- Table 5: Global Bio-Based Foam Industry Revenue undefined Forecast, by Region 2020 & 2033
- Table 6: Global Bio-Based Foam Industry Volume kilotons Forecast, by Region 2020 & 2033
- Table 7: Global Bio-Based Foam Industry Revenue undefined Forecast, by Application 2020 & 2033
- Table 8: Global Bio-Based Foam Industry Volume kilotons Forecast, by Application 2020 & 2033
- Table 9: Global Bio-Based Foam Industry Revenue undefined Forecast, by End-user Industry 2020 & 2033
- Table 10: Global Bio-Based Foam Industry Volume kilotons Forecast, by End-user Industry 2020 & 2033
- Table 11: Global Bio-Based Foam Industry Revenue undefined Forecast, by Country 2020 & 2033
- Table 12: Global Bio-Based Foam Industry Volume kilotons Forecast, by Country 2020 & 2033
- Table 13: China Bio-Based Foam Industry Revenue (undefined) Forecast, by Application 2020 & 2033
- Table 14: China Bio-Based Foam Industry Volume (kilotons) Forecast, by Application 2020 & 2033
- Table 15: India Bio-Based Foam Industry Revenue (undefined) Forecast, by Application 2020 & 2033
- Table 16: India Bio-Based Foam Industry Volume (kilotons) Forecast, by Application 2020 & 2033
- Table 17: Japan Bio-Based Foam Industry Revenue (undefined) Forecast, by Application 2020 & 2033
- Table 18: Japan Bio-Based Foam Industry Volume (kilotons) Forecast, by Application 2020 & 2033
- Table 19: South Korea Bio-Based Foam Industry Revenue (undefined) Forecast, by Application 2020 & 2033
- Table 20: South Korea Bio-Based Foam Industry Volume (kilotons) Forecast, by Application 2020 & 2033
- Table 21: Rest of Asia Pacific Bio-Based Foam Industry Revenue (undefined) Forecast, by Application 2020 & 2033
- Table 22: Rest of Asia Pacific Bio-Based Foam Industry Volume (kilotons) Forecast, by Application 2020 & 2033
- Table 23: Global Bio-Based Foam Industry Revenue undefined Forecast, by Application 2020 & 2033
- Table 24: Global Bio-Based Foam Industry Volume kilotons Forecast, by Application 2020 & 2033
- Table 25: Global Bio-Based Foam Industry Revenue undefined Forecast, by End-user Industry 2020 & 2033
- Table 26: Global Bio-Based Foam Industry Volume kilotons Forecast, by End-user Industry 2020 & 2033
- Table 27: Global Bio-Based Foam Industry Revenue undefined Forecast, by Country 2020 & 2033
- Table 28: Global Bio-Based Foam Industry Volume kilotons Forecast, by Country 2020 & 2033
- Table 29: United States Bio-Based Foam Industry Revenue (undefined) Forecast, by Application 2020 & 2033
- Table 30: United States Bio-Based Foam Industry Volume (kilotons) Forecast, by Application 2020 & 2033
- Table 31: Canada Bio-Based Foam Industry Revenue (undefined) Forecast, by Application 2020 & 2033
- Table 32: Canada Bio-Based Foam Industry Volume (kilotons) Forecast, by Application 2020 & 2033
- Table 33: Mexico Bio-Based Foam Industry Revenue (undefined) Forecast, by Application 2020 & 2033
- Table 34: Mexico Bio-Based Foam Industry Volume (kilotons) Forecast, by Application 2020 & 2033
- Table 35: Global Bio-Based Foam Industry Revenue undefined Forecast, by Application 2020 & 2033
- Table 36: Global Bio-Based Foam Industry Volume kilotons Forecast, by Application 2020 & 2033
- Table 37: Global Bio-Based Foam Industry Revenue undefined Forecast, by End-user Industry 2020 & 2033
- Table 38: Global Bio-Based Foam Industry Volume kilotons Forecast, by End-user Industry 2020 & 2033
- Table 39: Global Bio-Based Foam Industry Revenue undefined Forecast, by Country 2020 & 2033
- Table 40: Global Bio-Based Foam Industry Volume kilotons Forecast, by Country 2020 & 2033
- Table 41: Germany Bio-Based Foam Industry Revenue (undefined) Forecast, by Application 2020 & 2033
- Table 42: Germany Bio-Based Foam Industry Volume (kilotons) Forecast, by Application 2020 & 2033
- Table 43: United Kingdom Bio-Based Foam Industry Revenue (undefined) Forecast, by Application 2020 & 2033
- Table 44: United Kingdom Bio-Based Foam Industry Volume (kilotons) Forecast, by Application 2020 & 2033
- Table 45: Italy Bio-Based Foam Industry Revenue (undefined) Forecast, by Application 2020 & 2033
- Table 46: Italy Bio-Based Foam Industry Volume (kilotons) Forecast, by Application 2020 & 2033
- Table 47: France Bio-Based Foam Industry Revenue (undefined) Forecast, by Application 2020 & 2033
- Table 48: France Bio-Based Foam Industry Volume (kilotons) Forecast, by Application 2020 & 2033
- Table 49: Spain Bio-Based Foam Industry Revenue (undefined) Forecast, by Application 2020 & 2033
- Table 50: Spain Bio-Based Foam Industry Volume (kilotons) Forecast, by Application 2020 & 2033
- Table 51: Rest of Europe Bio-Based Foam Industry Revenue (undefined) Forecast, by Application 2020 & 2033
- Table 52: Rest of Europe Bio-Based Foam Industry Volume (kilotons) Forecast, by Application 2020 & 2033
- Table 53: Global Bio-Based Foam Industry Revenue undefined Forecast, by Application 2020 & 2033
- Table 54: Global Bio-Based Foam Industry Volume kilotons Forecast, by Application 2020 & 2033
- Table 55: Global Bio-Based Foam Industry Revenue undefined Forecast, by End-user Industry 2020 & 2033
- Table 56: Global Bio-Based Foam Industry Volume kilotons Forecast, by End-user Industry 2020 & 2033
- Table 57: Global Bio-Based Foam Industry Revenue undefined Forecast, by Country 2020 & 2033
- Table 58: Global Bio-Based Foam Industry Volume kilotons Forecast, by Country 2020 & 2033
- Table 59: Brazil Bio-Based Foam Industry Revenue (undefined) Forecast, by Application 2020 & 2033
- Table 60: Brazil Bio-Based Foam Industry Volume (kilotons) Forecast, by Application 2020 & 2033
- Table 61: Saudi Arabia Bio-Based Foam Industry Revenue (undefined) Forecast, by Application 2020 & 2033
- Table 62: Saudi Arabia Bio-Based Foam Industry Volume (kilotons) Forecast, by Application 2020 & 2033
- Table 63: South Africa Bio-Based Foam Industry Revenue (undefined) Forecast, by Application 2020 & 2033
- Table 64: South Africa Bio-Based Foam Industry Volume (kilotons) Forecast, by Application 2020 & 2033
- Table 65: Rest of the Countries Bio-Based Foam Industry Revenue (undefined) Forecast, by Application 2020 & 2033
- Table 66: Rest of the Countries Bio-Based Foam Industry Volume (kilotons) Forecast, by Application 2020 & 2033
Frequently Asked Questions
1. What is the projected Compound Annual Growth Rate (CAGR) of the Bio-Based Foam Industry?
The projected CAGR is approximately 5.9%.
2. Which companies are prominent players in the Bio-Based Foam Industry?
Key companies in the market include Arkema, Teijin Limited, Mitsui Chemicals Inc, Toray Industries Inc, Miracll Chemicals Co Ltd, BASF SE, Huntsman International LLC, Woodbridge, Stahl Holdings BV, The Lubrizol Corporation, Covestro AG.
3. What are the main segments of the Bio-Based Foam Industry?
The market segments include Application, End-user Industry.
4. Can you provide details about the market size?
The market size is estimated to be USD XXX N/A as of 2022.
5. What are some drivers contributing to market growth?
Increasing Demand from the Construction Industry in Developing Countries; Growing Demand from Electronic Appliance Manufacturing.; Other Drivers.
6. What are the notable trends driving market growth?
Increasing Demand from the Transportation Industry.
7. Are there any restraints impacting market growth?
High Cost of Bio-based Materials; Other Restraints.
8. Can you provide examples of recent developments in the market?
November 2022: Covestro AG, a materials supplier, and Coleitec, a Chinese high-tech company, signed a strategic partnership agreement to accelerate the application development of polyurethane (PU) composite materials and further expand their market-oriented cooperation.
9. What pricing options are available for accessing the report?
Pricing options include single-user, multi-user, and enterprise licenses priced at USD 4750, USD 5250, and USD 8750 respectively.
10. Is the market size provided in terms of value or volume?
The market size is provided in terms of value, measured in N/A and volume, measured in kilotons.
11. Are there any specific market keywords associated with the report?
Yes, the market keyword associated with the report is "Bio-Based Foam Industry," which aids in identifying and referencing the specific market segment covered.
12. How do I determine which pricing option suits my needs best?
The pricing options vary based on user requirements and access needs. Individual users may opt for single-user licenses, while businesses requiring broader access may choose multi-user or enterprise licenses for cost-effective access to the report.
13. Are there any additional resources or data provided in the Bio-Based Foam Industry report?
While the report offers comprehensive insights, it's advisable to review the specific contents or supplementary materials provided to ascertain if additional resources or data are available.
14. How can I stay updated on further developments or reports in the Bio-Based Foam Industry?
To stay informed about further developments, trends, and reports in the Bio-Based Foam Industry, consider subscribing to industry newsletters, following relevant companies and organizations, or regularly checking reputable industry news sources and publications.
Methodology
Step 1 - Identification of Relevant Samples Size from Population Database


Step 2 - Approaches for Defining Global Market Size (Value, Volume* & Price*)

Note*: In applicable scenarios
Step 3 - Data Sources
Primary Research
- Web Analytics
- Survey Reports
- Research Institute
- Latest Research Reports
- Opinion Leaders
Secondary Research
- Annual Reports
- White Paper
- Latest Press Release
- Industry Association
- Paid Database
- Investor Presentations

Step 4 - Data Triangulation
Involves using different sources of information in order to increase the validity of a study
These sources are likely to be stakeholders in a program - participants, other researchers, program staff, other community members, and so on.
Then we put all data in single framework & apply various statistical tools to find out the dynamic on the market.
During the analysis stage, feedback from the stakeholder groups would be compared to determine areas of agreement as well as areas of divergence