

Key Insights
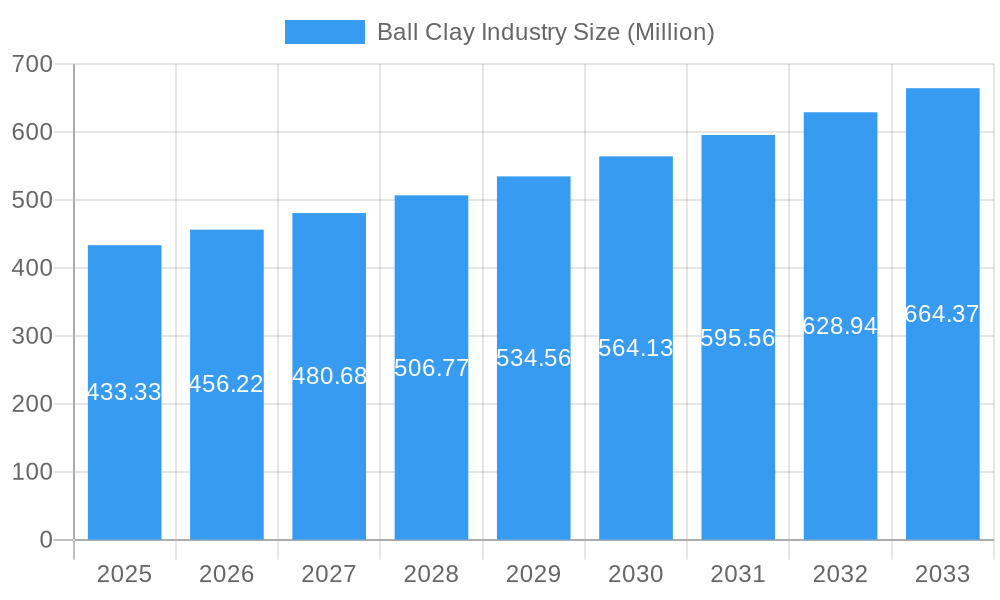
The global ball clay market, valued at $433.33 million in 2025, is projected to experience robust growth, driven by a Compound Annual Growth Rate (CAGR) of 5.07% from 2025 to 2033. This expansion is fueled by the increasing demand for ball clay in various end-use sectors, primarily the ceramics industry, encompassing both ceramic tiles and tableware, and other applications like construction ceramics and refractories. The rising construction activity globally, particularly in developing economies, significantly contributes to this growth. Furthermore, the growing popularity of sustainable and eco-friendly construction materials, which often incorporate ball clay, is further bolstering market demand. Technological advancements in ceramic manufacturing processes, leading to improved efficiency and product quality, also play a crucial role in driving market expansion.
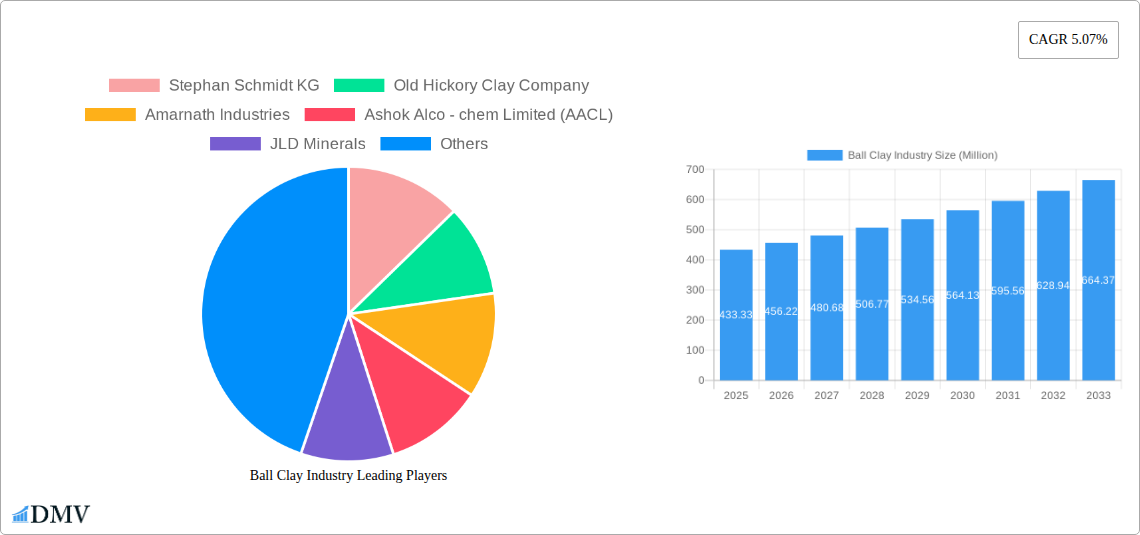
Ball Clay Industry Market Size (In Million)
However, the market faces certain restraints. Fluctuations in raw material prices, coupled with the increasing cost of energy and transportation, can impact profitability. Environmental regulations concerning mining and processing activities also pose challenges for industry players. Despite these constraints, the long-term outlook for the ball clay market remains positive, driven by sustained demand from key industries and ongoing innovation within the sector. Regional variations in market growth are expected, with Asia-Pacific potentially leading the expansion due to its rapid industrialization and significant construction activity. Companies operating in this market are focusing on strategic partnerships, technological upgrades, and geographic expansion to maintain a competitive edge and capitalize on emerging opportunities. The diverse applications of ball clay across various industries ensure its continued relevance and future growth potential.
Ball Clay Industry Company Market Share
Ball Clay Industry: Market Analysis, Trends & Forecast (2019-2033)
This comprehensive report provides an in-depth analysis of the global ball clay industry, offering invaluable insights for stakeholders seeking to understand market dynamics, future trends, and investment opportunities. The study covers the period from 2019 to 2033, with a focus on 2025 as the base and estimated year. The report analyzes market trends, competitive landscape, leading players, and future growth prospects, providing critical data for informed decision-making. The global market size in 2025 is estimated at $XX Million, projected to reach $XX Million by 2033.
Ball Clay Industry Market Composition & Trends
This section delves into the intricate structure of the ball clay market, examining market concentration, innovation drivers, regulatory landscapes, substitute products, end-user profiles, and mergers & acquisitions (M&A) activities. The market is moderately fragmented, with key players such as Imerys, Sibelco, and Gujarat Mineral Development Corporation Ltd holding significant market share. However, smaller players also contribute substantially, creating a dynamic competitive landscape.
- Market Share Distribution (2025): Imerys (25%), Sibelco (18%), Gujarat Mineral Development Corporation Ltd (10%), Others (47%). These figures are estimates.
- Innovation Catalysts: Growing demand for high-performance ceramics, advancements in processing technologies, and the development of sustainable extraction methods are key drivers of innovation.
- Regulatory Landscape: Environmental regulations regarding mining and waste disposal are increasingly stringent, influencing operational costs and strategies.
- Substitute Products: Kaolin and other clay types pose competition, though ball clay's unique properties often provide a distinct advantage in specific applications.
- End-User Profiles: The ceramic industry, encompassing tableware, tiles, and sanitaryware, dominates consumption, with other applications, including refractories and construction ceramics, exhibiting significant growth potential.
- M&A Activities: The past five years have witnessed a moderate level of M&A activity, with deal values totaling approximately $XX Million. Consolidation is anticipated to continue as larger players seek to enhance their market position and product portfolios.
Ball Clay Industry Industry Evolution
This section traces the evolutionary path of the ball clay industry, analyzing market growth trajectories, technological advancements, and evolving consumer preferences. The historical period (2019-2024) showed a Compound Annual Growth Rate (CAGR) of approximately X%, driven by increasing demand from the construction and ceramic industries. Technological advancements, such as improved processing techniques and the development of specialized ball clays for specific applications, have significantly enhanced product quality and performance. A notable shift towards sustainable mining practices and eco-friendly processing methods has emerged in recent years, aligning with the broader trend towards environmentally responsible manufacturing. The forecast period (2025-2033) projects a CAGR of approximately Y%, with continued growth driven by factors such as urbanization, rising disposable incomes, and expanding infrastructure development. Adoption rates of new technologies, such as digital mining and advanced material characterization, are expected to rise steadily. The increasing demand for high-performance, specialized ball clays for applications like advanced ceramics and 3D printing will further stimulate market expansion.
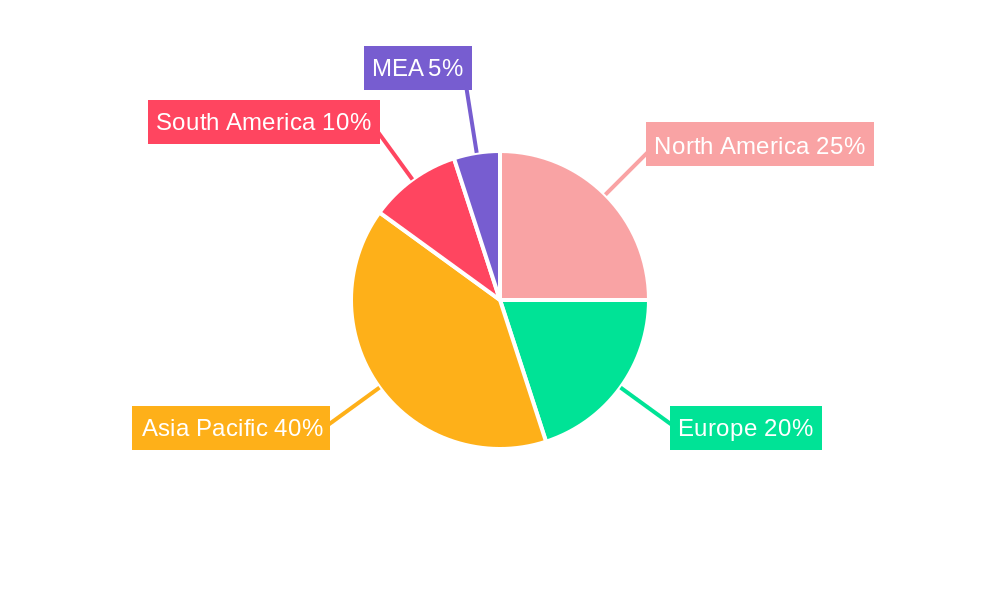
Leading Regions, Countries, or Segments in Ball Clay Industry
The Asia-Pacific region currently holds the dominant position in the ball clay market, fueled by rapid economic growth, robust infrastructure development, and a burgeoning ceramics industry. China, India, and other Southeast Asian countries are major contributors to this regional dominance.
- Key Drivers in Asia-Pacific:
- High Investment in Infrastructure: Significant investments in infrastructure projects, including housing and industrial facilities, are driving demand for construction ceramics.
- Growth of Ceramic Industry: The ceramic tile and sanitaryware industries are witnessing rapid expansion, fueling demand for ball clay.
- Supportive Government Policies: Government initiatives promoting industrial development and infrastructure investment further contribute to market growth.
The dominance of the Asia-Pacific region stems from several factors, including the high concentration of ceramic manufacturing facilities, a large and growing population base, and supportive government policies fostering industrial development. While Europe and North America maintain significant market shares, their growth rates are expected to be slower than those in the Asia-Pacific region. The construction ceramics segment is projected to witness the fastest growth, driven by sustained global urbanization and infrastructure expansion.
Ball Clay Industry Product Innovations
Recent product innovations within the ball clay industry center on enhancing performance characteristics to meet the demands of advanced ceramic applications. These innovations include the development of ball clays with improved plasticity, higher whiteness, and increased strength, catering to the needs of manufacturers seeking enhanced product quality and efficiency. This includes the use of advanced processing techniques like nano-modification to achieve finer particle sizes and improved rheological properties. These advancements offer unique selling propositions such as improved processability, reduced shrinkage, and enhanced final product performance.
Propelling Factors for Ball Clay Industry Growth
Several factors contribute to the growth trajectory of the ball clay industry. Technological advancements in mining and processing techniques have increased efficiency and reduced costs. Economic growth in emerging economies, particularly in Asia, has stimulated demand for construction materials and ceramics, thereby boosting ball clay consumption. Government regulations promoting sustainable mining practices, while posing initial challenges, are ultimately driving innovation and market consolidation towards more responsible players.
Obstacles in the Ball Clay Industry Market
Despite its growth potential, the ball clay industry faces several challenges. Fluctuations in raw material prices and supply chain disruptions can significantly impact profitability. Environmental regulations and their enforcement vary globally, leading to increased operational costs and compliance complexities. Intense competition from substitute materials and other clay types necessitates continuous innovation and value addition to maintain a competitive edge.
Future Opportunities in Ball Clay Industry
The ball clay industry is poised for growth in several areas. Expanding into new markets, particularly in regions experiencing rapid urbanization and industrialization, offers substantial potential. Technological advancements in areas such as nano-materials and 3D printing are creating new application possibilities. Emerging consumer trends emphasizing sustainability and eco-friendly products present opportunities for producers to develop and market environmentally responsible ball clays.
Major Players in the Ball Clay Industry Ecosystem
- Stephan Schmidt KG
- Old Hickory Clay Company
- Amarnath Industries
- Ashok Alco - chem Limited (AACL)
- JLD Minerals
- Imerys
- Mota Ceramic Solutions
- Modkha Marine Sdn Bhd
- Gujarat Mineral Development Corporation Ltd
- Sibelco
- Golcha Associated (Associated Soapstone Distribution Company Pvt Ltd)
Key Developments in Ball Clay Industry Industry
- 2022 Q4: Imerys announced a strategic investment in a new ball clay processing facility in [Location], enhancing its production capacity.
- 2023 Q1: Sibelco launched a new line of sustainable ball clays, focusing on reduced environmental impact during extraction and processing.
- 2023 Q3: A significant merger occurred between two smaller players in the [Region] market, leading to increased market concentration. Further details on the merger are unavailable.
Strategic Ball Clay Industry Market Forecast
The ball clay industry is projected to experience steady growth over the forecast period (2025-2033), driven by continuous demand from the construction and ceramic sectors. Technological advancements and a growing emphasis on sustainability will shape future market dynamics. Opportunities lie in developing specialized ball clays for high-performance applications and exploring new markets in emerging economies. The industry's success hinges on adapting to evolving environmental regulations and maintaining efficient supply chains.
Ball Clay Industry Segmentation
-
1. End Use
-
1.1. Ceramic
- 1.1.1. Sanitary Ware
- 1.1.2. Wall and Floor Tiles
- 1.1.3. Tableware
- 1.1.4. Bricks
- 1.1.5. Other Ce
-
1.2. Non-ceramic
- 1.2.1. Adhesives and Sealants
- 1.2.2. Rubbers and Plastics
- 1.2.3. Fertilizers and Insecticides
- 1.2.4. Other Non-ceramics
-
1.1. Ceramic
Ball Clay Industry Segmentation By Geography
-
1. Asia Pacific
- 1.1. China
- 1.2. India
- 1.3. Japan
- 1.4. South Korea
- 1.5. Rest of Asia Pacific
-
2. North America
- 2.1. United States
- 2.2. Canada
- 2.3. Mexico
-
3. Europe
- 3.1. Germany
- 3.2. United Kingdom
- 3.3. Italy
- 3.4. France
- 3.5. Spain
- 3.6. Rest of Europe
-
4. South America
- 4.1. Brazil
- 4.2. Argentina
- 4.3. Rest of South America
-
5. Middle East and Africa
- 5.1. Saudi Arabia
- 5.2. South Africa
- 5.3. Rest of Middle East and Africa
Ball Clay Industry Regional Market Share
Geographic Coverage of Ball Clay Industry
Ball Clay Industry REPORT HIGHLIGHTS
| Aspects | Details |
|---|---|
| Study Period | 2020-2034 |
| Base Year | 2025 |
| Estimated Year | 2026 |
| Forecast Period | 2026-2034 |
| Historical Period | 2020-2025 |
| Growth Rate | CAGR of 5.07% from 2020-2034 |
| Segmentation |
|
Table of Contents
- 1. Introduction
- 1.1. Research Scope
- 1.2. Market Segmentation
- 1.3. Research Objective
- 1.4. Definitions and Assumptions
- 2. Executive Summary
- 2.1. Market Snapshot
- 3. Market Dynamics
- 3.1. Market Drivers
- 3.2. Market Restrains
- 3.3. Market Trends
- 3.4. Market Opportunities
- 4. Market Factor Analysis
- 4.1. Porters Five Forces
- 4.1.1. Bargaining Power of Suppliers
- 4.1.2. Bargaining Power of Buyers
- 4.1.3. Threat of New Entrants
- 4.1.4. Threat of Substitutes
- 4.1.5. Competitive Rivalry
- 4.2. PESTEL analysis
- 4.3. BCG Analysis
- 4.3.1. Stars (High Growth, High Market Share)
- 4.3.2. Cash Cows (Low Growth, High Market Share)
- 4.3.3. Question Mark (High Growth, Low Market Share)
- 4.3.4. Dogs (Low Growth, Low Market Share)
- 4.4. Ansoff Matrix Analysis
- 4.5. Supply Chain Analysis
- 4.6. Regulatory Landscape
- 4.7. Current Market Potential and Opportunity Assessment (TAM–SAM–SOM Framework)
- 4.8. DMV Analyst Note
- 4.1. Porters Five Forces
- 5. Market Analysis, Insights and Forecast 2021-2033
- 5.1. Market Analysis, Insights and Forecast - by End Use
- 5.1.1. Ceramic
- 5.1.1.1. Sanitary Ware
- 5.1.1.2. Wall and Floor Tiles
- 5.1.1.3. Tableware
- 5.1.1.4. Bricks
- 5.1.1.5. Other Ce
- 5.1.2. Non-ceramic
- 5.1.2.1. Adhesives and Sealants
- 5.1.2.2. Rubbers and Plastics
- 5.1.2.3. Fertilizers and Insecticides
- 5.1.2.4. Other Non-ceramics
- 5.1.1. Ceramic
- 5.2. Market Analysis, Insights and Forecast - by Region
- 5.2.1. Asia Pacific
- 5.2.2. North America
- 5.2.3. Europe
- 5.2.4. South America
- 5.2.5. Middle East and Africa
- 5.1. Market Analysis, Insights and Forecast - by End Use
- 6. Global Ball Clay Industry Analysis, Insights and Forecast, 2021-2033
- 6.1. Market Analysis, Insights and Forecast - by End Use
- 6.1.1. Ceramic
- 6.1.1.1. Sanitary Ware
- 6.1.1.2. Wall and Floor Tiles
- 6.1.1.3. Tableware
- 6.1.1.4. Bricks
- 6.1.1.5. Other Ce
- 6.1.2. Non-ceramic
- 6.1.2.1. Adhesives and Sealants
- 6.1.2.2. Rubbers and Plastics
- 6.1.2.3. Fertilizers and Insecticides
- 6.1.2.4. Other Non-ceramics
- 6.1.1. Ceramic
- 6.1. Market Analysis, Insights and Forecast - by End Use
- 7. Asia Pacific Ball Clay Industry Analysis, Insights and Forecast, 2020-2032
- 7.1. Market Analysis, Insights and Forecast - by End Use
- 7.1.1. Ceramic
- 7.1.1.1. Sanitary Ware
- 7.1.1.2. Wall and Floor Tiles
- 7.1.1.3. Tableware
- 7.1.1.4. Bricks
- 7.1.1.5. Other Ce
- 7.1.2. Non-ceramic
- 7.1.2.1. Adhesives and Sealants
- 7.1.2.2. Rubbers and Plastics
- 7.1.2.3. Fertilizers and Insecticides
- 7.1.2.4. Other Non-ceramics
- 7.1.1. Ceramic
- 7.1. Market Analysis, Insights and Forecast - by End Use
- 8. North America Ball Clay Industry Analysis, Insights and Forecast, 2020-2032
- 8.1. Market Analysis, Insights and Forecast - by End Use
- 8.1.1. Ceramic
- 8.1.1.1. Sanitary Ware
- 8.1.1.2. Wall and Floor Tiles
- 8.1.1.3. Tableware
- 8.1.1.4. Bricks
- 8.1.1.5. Other Ce
- 8.1.2. Non-ceramic
- 8.1.2.1. Adhesives and Sealants
- 8.1.2.2. Rubbers and Plastics
- 8.1.2.3. Fertilizers and Insecticides
- 8.1.2.4. Other Non-ceramics
- 8.1.1. Ceramic
- 8.1. Market Analysis, Insights and Forecast - by End Use
- 9. Europe Ball Clay Industry Analysis, Insights and Forecast, 2020-2032
- 9.1. Market Analysis, Insights and Forecast - by End Use
- 9.1.1. Ceramic
- 9.1.1.1. Sanitary Ware
- 9.1.1.2. Wall and Floor Tiles
- 9.1.1.3. Tableware
- 9.1.1.4. Bricks
- 9.1.1.5. Other Ce
- 9.1.2. Non-ceramic
- 9.1.2.1. Adhesives and Sealants
- 9.1.2.2. Rubbers and Plastics
- 9.1.2.3. Fertilizers and Insecticides
- 9.1.2.4. Other Non-ceramics
- 9.1.1. Ceramic
- 9.1. Market Analysis, Insights and Forecast - by End Use
- 10. South America Ball Clay Industry Analysis, Insights and Forecast, 2020-2032
- 10.1. Market Analysis, Insights and Forecast - by End Use
- 10.1.1. Ceramic
- 10.1.1.1. Sanitary Ware
- 10.1.1.2. Wall and Floor Tiles
- 10.1.1.3. Tableware
- 10.1.1.4. Bricks
- 10.1.1.5. Other Ce
- 10.1.2. Non-ceramic
- 10.1.2.1. Adhesives and Sealants
- 10.1.2.2. Rubbers and Plastics
- 10.1.2.3. Fertilizers and Insecticides
- 10.1.2.4. Other Non-ceramics
- 10.1.1. Ceramic
- 10.1. Market Analysis, Insights and Forecast - by End Use
- 11. Middle East and Africa Ball Clay Industry Analysis, Insights and Forecast, 2020-2032
- 11.1. Market Analysis, Insights and Forecast - by End Use
- 11.1.1. Ceramic
- 11.1.1.1. Sanitary Ware
- 11.1.1.2. Wall and Floor Tiles
- 11.1.1.3. Tableware
- 11.1.1.4. Bricks
- 11.1.1.5. Other Ce
- 11.1.2. Non-ceramic
- 11.1.2.1. Adhesives and Sealants
- 11.1.2.2. Rubbers and Plastics
- 11.1.2.3. Fertilizers and Insecticides
- 11.1.2.4. Other Non-ceramics
- 11.1.1. Ceramic
- 11.1. Market Analysis, Insights and Forecast - by End Use
- 12. Competitive Analysis
- 12.1. Company Profiles
- 12.1.1 Stephan Schmidt KG
- 12.1.1.1. Company Overview
- 12.1.1.2. Products
- 12.1.1.3. Company Financials
- 12.1.1.4. SWOT Analysis
- 12.1.2 Old Hickory Clay Company
- 12.1.2.1. Company Overview
- 12.1.2.2. Products
- 12.1.2.3. Company Financials
- 12.1.2.4. SWOT Analysis
- 12.1.3 Amarnath Industries
- 12.1.3.1. Company Overview
- 12.1.3.2. Products
- 12.1.3.3. Company Financials
- 12.1.3.4. SWOT Analysis
- 12.1.4 Ashok Alco - chem Limited (AACL)
- 12.1.4.1. Company Overview
- 12.1.4.2. Products
- 12.1.4.3. Company Financials
- 12.1.4.4. SWOT Analysis
- 12.1.5 JLD Minerals
- 12.1.5.1. Company Overview
- 12.1.5.2. Products
- 12.1.5.3. Company Financials
- 12.1.5.4. SWOT Analysis
- 12.1.6 Imerys
- 12.1.6.1. Company Overview
- 12.1.6.2. Products
- 12.1.6.3. Company Financials
- 12.1.6.4. SWOT Analysis
- 12.1.7 Mota Ceramic Solutions
- 12.1.7.1. Company Overview
- 12.1.7.2. Products
- 12.1.7.3. Company Financials
- 12.1.7.4. SWOT Analysis
- 12.1.8 Modkha Marine Sdn Bhd
- 12.1.8.1. Company Overview
- 12.1.8.2. Products
- 12.1.8.3. Company Financials
- 12.1.8.4. SWOT Analysis
- 12.1.9 Gujarat Mineral Development Corporation Ltd
- 12.1.9.1. Company Overview
- 12.1.9.2. Products
- 12.1.9.3. Company Financials
- 12.1.9.4. SWOT Analysis
- 12.1.10 Sibelco
- 12.1.10.1. Company Overview
- 12.1.10.2. Products
- 12.1.10.3. Company Financials
- 12.1.10.4. SWOT Analysis
- 12.1.11 Golcha Associated (Associated Soapstone Distribution Company Pvt Ltd)
- 12.1.11.1. Company Overview
- 12.1.11.2. Products
- 12.1.11.3. Company Financials
- 12.1.11.4. SWOT Analysis
- 12.1.1 Stephan Schmidt KG
- 12.2. Market Entropy
- 12.2.1 Company's Key Areas Served
- 12.2.2 Recent Developments
- 12.3. Company Market Share Analysis 2025
- 12.3.1 Top 5 Companies Market Share Analysis
- 12.3.2 Top 3 Companies Market Share Analysis
- 12.4. List of Potential Customers
- 13. Research Methodology
List of Figures
- Figure 1: Global Ball Clay Industry Revenue Breakdown (Million, %) by Region 2025 & 2033
- Figure 2: Global Ball Clay Industry Volume Breakdown (K Tons, %) by Region 2025 & 2033
- Figure 3: Asia Pacific Ball Clay Industry Revenue (Million), by End Use 2025 & 2033
- Figure 4: Asia Pacific Ball Clay Industry Volume (K Tons), by End Use 2025 & 2033
- Figure 5: Asia Pacific Ball Clay Industry Revenue Share (%), by End Use 2025 & 2033
- Figure 6: Asia Pacific Ball Clay Industry Volume Share (%), by End Use 2025 & 2033
- Figure 7: Asia Pacific Ball Clay Industry Revenue (Million), by Country 2025 & 2033
- Figure 8: Asia Pacific Ball Clay Industry Volume (K Tons), by Country 2025 & 2033
- Figure 9: Asia Pacific Ball Clay Industry Revenue Share (%), by Country 2025 & 2033
- Figure 10: Asia Pacific Ball Clay Industry Volume Share (%), by Country 2025 & 2033
- Figure 11: North America Ball Clay Industry Revenue (Million), by End Use 2025 & 2033
- Figure 12: North America Ball Clay Industry Volume (K Tons), by End Use 2025 & 2033
- Figure 13: North America Ball Clay Industry Revenue Share (%), by End Use 2025 & 2033
- Figure 14: North America Ball Clay Industry Volume Share (%), by End Use 2025 & 2033
- Figure 15: North America Ball Clay Industry Revenue (Million), by Country 2025 & 2033
- Figure 16: North America Ball Clay Industry Volume (K Tons), by Country 2025 & 2033
- Figure 17: North America Ball Clay Industry Revenue Share (%), by Country 2025 & 2033
- Figure 18: North America Ball Clay Industry Volume Share (%), by Country 2025 & 2033
- Figure 19: Europe Ball Clay Industry Revenue (Million), by End Use 2025 & 2033
- Figure 20: Europe Ball Clay Industry Volume (K Tons), by End Use 2025 & 2033
- Figure 21: Europe Ball Clay Industry Revenue Share (%), by End Use 2025 & 2033
- Figure 22: Europe Ball Clay Industry Volume Share (%), by End Use 2025 & 2033
- Figure 23: Europe Ball Clay Industry Revenue (Million), by Country 2025 & 2033
- Figure 24: Europe Ball Clay Industry Volume (K Tons), by Country 2025 & 2033
- Figure 25: Europe Ball Clay Industry Revenue Share (%), by Country 2025 & 2033
- Figure 26: Europe Ball Clay Industry Volume Share (%), by Country 2025 & 2033
- Figure 27: South America Ball Clay Industry Revenue (Million), by End Use 2025 & 2033
- Figure 28: South America Ball Clay Industry Volume (K Tons), by End Use 2025 & 2033
- Figure 29: South America Ball Clay Industry Revenue Share (%), by End Use 2025 & 2033
- Figure 30: South America Ball Clay Industry Volume Share (%), by End Use 2025 & 2033
- Figure 31: South America Ball Clay Industry Revenue (Million), by Country 2025 & 2033
- Figure 32: South America Ball Clay Industry Volume (K Tons), by Country 2025 & 2033
- Figure 33: South America Ball Clay Industry Revenue Share (%), by Country 2025 & 2033
- Figure 34: South America Ball Clay Industry Volume Share (%), by Country 2025 & 2033
- Figure 35: Middle East and Africa Ball Clay Industry Revenue (Million), by End Use 2025 & 2033
- Figure 36: Middle East and Africa Ball Clay Industry Volume (K Tons), by End Use 2025 & 2033
- Figure 37: Middle East and Africa Ball Clay Industry Revenue Share (%), by End Use 2025 & 2033
- Figure 38: Middle East and Africa Ball Clay Industry Volume Share (%), by End Use 2025 & 2033
- Figure 39: Middle East and Africa Ball Clay Industry Revenue (Million), by Country 2025 & 2033
- Figure 40: Middle East and Africa Ball Clay Industry Volume (K Tons), by Country 2025 & 2033
- Figure 41: Middle East and Africa Ball Clay Industry Revenue Share (%), by Country 2025 & 2033
- Figure 42: Middle East and Africa Ball Clay Industry Volume Share (%), by Country 2025 & 2033
List of Tables
- Table 1: Global Ball Clay Industry Revenue Million Forecast, by End Use 2020 & 2033
- Table 2: Global Ball Clay Industry Volume K Tons Forecast, by End Use 2020 & 2033
- Table 3: Global Ball Clay Industry Revenue Million Forecast, by Region 2020 & 2033
- Table 4: Global Ball Clay Industry Volume K Tons Forecast, by Region 2020 & 2033
- Table 5: Global Ball Clay Industry Revenue Million Forecast, by End Use 2020 & 2033
- Table 6: Global Ball Clay Industry Volume K Tons Forecast, by End Use 2020 & 2033
- Table 7: Global Ball Clay Industry Revenue Million Forecast, by Country 2020 & 2033
- Table 8: Global Ball Clay Industry Volume K Tons Forecast, by Country 2020 & 2033
- Table 9: China Ball Clay Industry Revenue (Million) Forecast, by Application 2020 & 2033
- Table 10: China Ball Clay Industry Volume (K Tons) Forecast, by Application 2020 & 2033
- Table 11: India Ball Clay Industry Revenue (Million) Forecast, by Application 2020 & 2033
- Table 12: India Ball Clay Industry Volume (K Tons) Forecast, by Application 2020 & 2033
- Table 13: Japan Ball Clay Industry Revenue (Million) Forecast, by Application 2020 & 2033
- Table 14: Japan Ball Clay Industry Volume (K Tons) Forecast, by Application 2020 & 2033
- Table 15: South Korea Ball Clay Industry Revenue (Million) Forecast, by Application 2020 & 2033
- Table 16: South Korea Ball Clay Industry Volume (K Tons) Forecast, by Application 2020 & 2033
- Table 17: Rest of Asia Pacific Ball Clay Industry Revenue (Million) Forecast, by Application 2020 & 2033
- Table 18: Rest of Asia Pacific Ball Clay Industry Volume (K Tons) Forecast, by Application 2020 & 2033
- Table 19: Global Ball Clay Industry Revenue Million Forecast, by End Use 2020 & 2033
- Table 20: Global Ball Clay Industry Volume K Tons Forecast, by End Use 2020 & 2033
- Table 21: Global Ball Clay Industry Revenue Million Forecast, by Country 2020 & 2033
- Table 22: Global Ball Clay Industry Volume K Tons Forecast, by Country 2020 & 2033
- Table 23: United States Ball Clay Industry Revenue (Million) Forecast, by Application 2020 & 2033
- Table 24: United States Ball Clay Industry Volume (K Tons) Forecast, by Application 2020 & 2033
- Table 25: Canada Ball Clay Industry Revenue (Million) Forecast, by Application 2020 & 2033
- Table 26: Canada Ball Clay Industry Volume (K Tons) Forecast, by Application 2020 & 2033
- Table 27: Mexico Ball Clay Industry Revenue (Million) Forecast, by Application 2020 & 2033
- Table 28: Mexico Ball Clay Industry Volume (K Tons) Forecast, by Application 2020 & 2033
- Table 29: Global Ball Clay Industry Revenue Million Forecast, by End Use 2020 & 2033
- Table 30: Global Ball Clay Industry Volume K Tons Forecast, by End Use 2020 & 2033
- Table 31: Global Ball Clay Industry Revenue Million Forecast, by Country 2020 & 2033
- Table 32: Global Ball Clay Industry Volume K Tons Forecast, by Country 2020 & 2033
- Table 33: Germany Ball Clay Industry Revenue (Million) Forecast, by Application 2020 & 2033
- Table 34: Germany Ball Clay Industry Volume (K Tons) Forecast, by Application 2020 & 2033
- Table 35: United Kingdom Ball Clay Industry Revenue (Million) Forecast, by Application 2020 & 2033
- Table 36: United Kingdom Ball Clay Industry Volume (K Tons) Forecast, by Application 2020 & 2033
- Table 37: Italy Ball Clay Industry Revenue (Million) Forecast, by Application 2020 & 2033
- Table 38: Italy Ball Clay Industry Volume (K Tons) Forecast, by Application 2020 & 2033
- Table 39: France Ball Clay Industry Revenue (Million) Forecast, by Application 2020 & 2033
- Table 40: France Ball Clay Industry Volume (K Tons) Forecast, by Application 2020 & 2033
- Table 41: Spain Ball Clay Industry Revenue (Million) Forecast, by Application 2020 & 2033
- Table 42: Spain Ball Clay Industry Volume (K Tons) Forecast, by Application 2020 & 2033
- Table 43: Rest of Europe Ball Clay Industry Revenue (Million) Forecast, by Application 2020 & 2033
- Table 44: Rest of Europe Ball Clay Industry Volume (K Tons) Forecast, by Application 2020 & 2033
- Table 45: Global Ball Clay Industry Revenue Million Forecast, by End Use 2020 & 2033
- Table 46: Global Ball Clay Industry Volume K Tons Forecast, by End Use 2020 & 2033
- Table 47: Global Ball Clay Industry Revenue Million Forecast, by Country 2020 & 2033
- Table 48: Global Ball Clay Industry Volume K Tons Forecast, by Country 2020 & 2033
- Table 49: Brazil Ball Clay Industry Revenue (Million) Forecast, by Application 2020 & 2033
- Table 50: Brazil Ball Clay Industry Volume (K Tons) Forecast, by Application 2020 & 2033
- Table 51: Argentina Ball Clay Industry Revenue (Million) Forecast, by Application 2020 & 2033
- Table 52: Argentina Ball Clay Industry Volume (K Tons) Forecast, by Application 2020 & 2033
- Table 53: Rest of South America Ball Clay Industry Revenue (Million) Forecast, by Application 2020 & 2033
- Table 54: Rest of South America Ball Clay Industry Volume (K Tons) Forecast, by Application 2020 & 2033
- Table 55: Global Ball Clay Industry Revenue Million Forecast, by End Use 2020 & 2033
- Table 56: Global Ball Clay Industry Volume K Tons Forecast, by End Use 2020 & 2033
- Table 57: Global Ball Clay Industry Revenue Million Forecast, by Country 2020 & 2033
- Table 58: Global Ball Clay Industry Volume K Tons Forecast, by Country 2020 & 2033
- Table 59: Saudi Arabia Ball Clay Industry Revenue (Million) Forecast, by Application 2020 & 2033
- Table 60: Saudi Arabia Ball Clay Industry Volume (K Tons) Forecast, by Application 2020 & 2033
- Table 61: South Africa Ball Clay Industry Revenue (Million) Forecast, by Application 2020 & 2033
- Table 62: South Africa Ball Clay Industry Volume (K Tons) Forecast, by Application 2020 & 2033
- Table 63: Rest of Middle East and Africa Ball Clay Industry Revenue (Million) Forecast, by Application 2020 & 2033
- Table 64: Rest of Middle East and Africa Ball Clay Industry Volume (K Tons) Forecast, by Application 2020 & 2033
Frequently Asked Questions
1. What is the projected Compound Annual Growth Rate (CAGR) of the Ball Clay Industry?
The projected CAGR is approximately 5.07%.
2. Which companies are prominent players in the Ball Clay Industry?
Key companies in the market include Stephan Schmidt KG, Old Hickory Clay Company, Amarnath Industries, Ashok Alco - chem Limited (AACL), JLD Minerals, Imerys, Mota Ceramic Solutions, Modkha Marine Sdn Bhd, Gujarat Mineral Development Corporation Ltd, Sibelco, Golcha Associated (Associated Soapstone Distribution Company Pvt Ltd).
3. What are the main segments of the Ball Clay Industry?
The market segments include End Use.
4. Can you provide details about the market size?
The market size is estimated to be USD 433.33 Million as of 2022.
5. What are some drivers contributing to market growth?
Increasing Demand for Sanitary Ware in Asia-Pacific; Other Drivers.
6. What are the notable trends driving market growth?
Use of Wall and Floor Tiles in the Construction Industry.
7. Are there any restraints impacting market growth?
Availability of Substitutes for Ball Clay; Other Restraints.
8. Can you provide examples of recent developments in the market?
N/A
9. What pricing options are available for accessing the report?
Pricing options include single-user, multi-user, and enterprise licenses priced at USD 4750, USD 5250, and USD 8750 respectively.
10. Is the market size provided in terms of value or volume?
The market size is provided in terms of value, measured in Million and volume, measured in K Tons.
11. Are there any specific market keywords associated with the report?
Yes, the market keyword associated with the report is "Ball Clay Industry," which aids in identifying and referencing the specific market segment covered.
12. How do I determine which pricing option suits my needs best?
The pricing options vary based on user requirements and access needs. Individual users may opt for single-user licenses, while businesses requiring broader access may choose multi-user or enterprise licenses for cost-effective access to the report.
13. Are there any additional resources or data provided in the Ball Clay Industry report?
While the report offers comprehensive insights, it's advisable to review the specific contents or supplementary materials provided to ascertain if additional resources or data are available.
14. How can I stay updated on further developments or reports in the Ball Clay Industry?
To stay informed about further developments, trends, and reports in the Ball Clay Industry, consider subscribing to industry newsletters, following relevant companies and organizations, or regularly checking reputable industry news sources and publications.
Methodology
Step 1 - Identification of Relevant Samples Size from Population Database


Step 2 - Approaches for Defining Global Market Size (Value, Volume* & Price*)

Note*: In applicable scenarios
Step 3 - Data Sources
Primary Research
- Web Analytics
- Survey Reports
- Research Institute
- Latest Research Reports
- Opinion Leaders
Secondary Research
- Annual Reports
- White Paper
- Latest Press Release
- Industry Association
- Paid Database
- Investor Presentations

Step 4 - Data Triangulation
Involves using different sources of information in order to increase the validity of a study
These sources are likely to be stakeholders in a program - participants, other researchers, program staff, other community members, and so on.
Then we put all data in single framework & apply various statistical tools to find out the dynamic on the market.
During the analysis stage, feedback from the stakeholder groups would be compared to determine areas of agreement as well as areas of divergence