

Key Insights
The APAC scale inhibitors market is poised for significant expansion, propelled by escalating industrialization, rapid urbanization, and increasingly stringent environmental regulations across the region. Anticipated to grow at a Compound Annual Growth Rate (CAGR) of 5.1%, the market is projected to reach $3.98 billion by 2025. This growth is primarily attributed to the surging demand for effective water treatment solutions across key sectors including power generation, oil and gas, and manufacturing. Enhanced awareness of scale formation's detrimental impact on industrial equipment and operational efficiency further fuels market momentum. Key industry trends include the integration of advanced technologies, such as nanotechnology-based inhibitors, and a pronounced emphasis on sustainable and eco-friendly chemical solutions. The market is comprehensively segmented by application (e.g., oil & gas, power generation), inhibitor type (e.g., phosphonates, polyacrylates), and granular geographic breakdown within APAC. Leading market participants, including BWA Water Additives, Dow, Ecolab, and Kurita Water Industries Ltd., are actively engaged in research and development, fostering innovation and intense competition. However, potential challenges such as raw material price volatility and evolving regulatory compliance could temper growth.
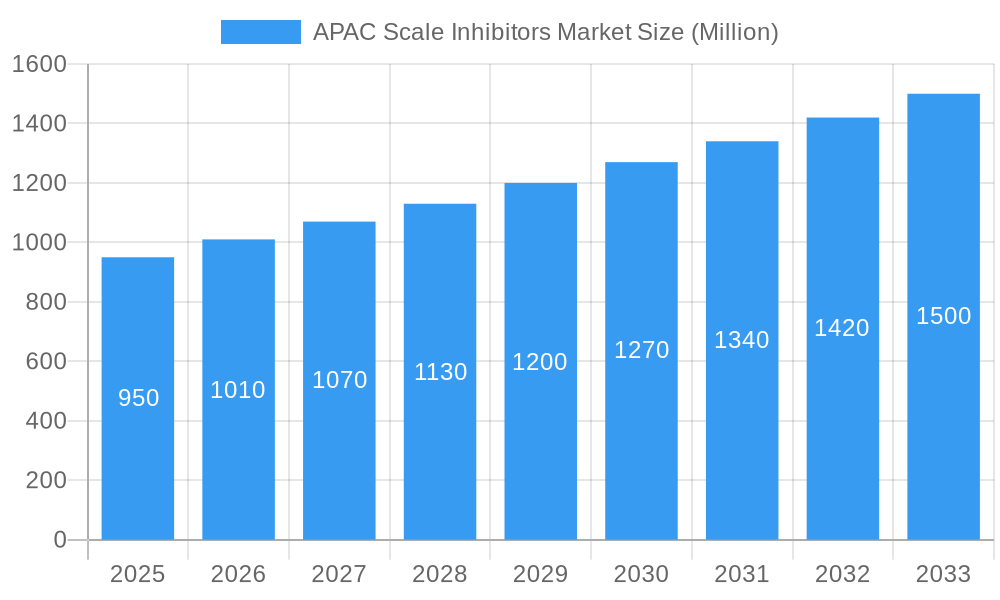
APAC Scale Inhibitors Market Market Size (In Billion)
The competitive arena features a blend of global corporations and regional specialists. Strategic alliances, mergers, acquisitions, and technological innovation are key strategies employed by companies to secure market share and diversify product offerings. Future market trajectory remains robust, supported by ongoing infrastructure development initiatives, particularly within APAC's emerging economies. The widespread adoption of sophisticated water treatment technologies, coupled with a heightened global focus on environmental sustainability, is expected to drive market growth throughout the forecast period (2025-2033). Continuous advancements in inhibitor formulations, prioritizing superior efficacy, reduced toxicity, and minimized environmental impact, will be instrumental in defining the future landscape of the APAC scale inhibitors market.
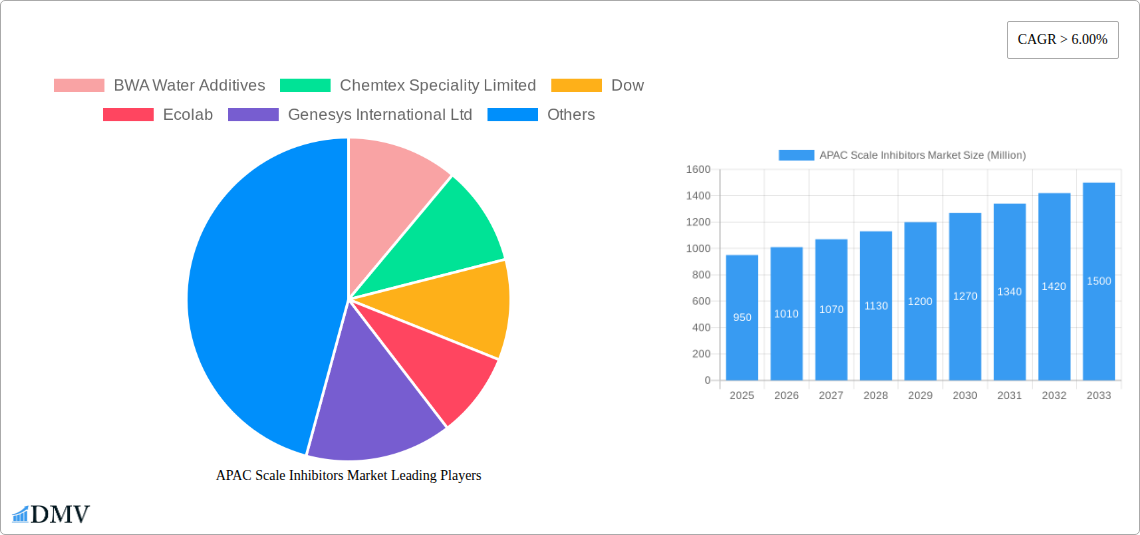
APAC Scale Inhibitors Market Company Market Share
APAC Scale Inhibitors Market: A Comprehensive Report (2019-2033)
This insightful report delivers a comprehensive analysis of the Asia-Pacific (APAC) scale inhibitors market, providing crucial data and forecasts for informed decision-making. The study covers the period 2019-2033, with 2025 as the base and estimated year. The market is poised for significant growth, driven by factors detailed within, and this report offers a granular understanding of its dynamics, key players, and future potential. The market size is projected to reach xx Million by 2033, representing a substantial increase from xx Million in 2024.
APAC Scale Inhibitors Market Composition & Trends
This section dissects the competitive landscape of the APAC scale inhibitors market, exploring market concentration, innovation drivers, regulatory frameworks, substitute products, end-user profiles, and mergers & acquisitions (M&A) activities. The market exhibits a moderately concentrated structure, with key players like Dow, Ecolab, and Kemira holding significant market share. However, smaller, specialized companies are also making inroads, particularly those focused on niche applications or eco-friendly solutions. Market share distribution in 2024 is estimated as follows: Dow (15%), Ecolab (12%), Kemira (10%), others (63%).
- Market Concentration: Moderately concentrated, with top players holding approximately 40% of the market share in 2024.
- Innovation Catalysts: Stringent environmental regulations, increasing demand for water-efficient technologies, and advancements in polymer chemistry are driving innovation.
- Regulatory Landscape: Varying regulations across APAC countries impact product formulations and market access.
- Substitute Products: Limited effective substitutes exist, making scale inhibitors crucial for various industries.
- End-User Profiles: Key end-users include power generation, oil & gas, and desalination plants.
- M&A Activities: The past five years have witnessed xx Million in M&A deals, primarily focused on expanding product portfolios and geographical reach. Specific deal values are confidential and unavailable for public disclosure.
APAC Scale Inhibitors Market Industry Evolution
The APAC scale inhibitors market has witnessed robust growth over the historical period (2019-2024), driven primarily by rising industrialization, urbanization, and increasing water scarcity. Technological advancements, particularly in the development of high-performance polymers and environmentally friendly formulations, have further fueled market expansion. The market experienced a CAGR of xx% between 2019 and 2024. Shifting consumer demands towards sustainable and cost-effective solutions are influencing product development strategies. The forecast period (2025-2033) is expected to see continued growth, albeit at a slightly moderated pace due to economic factors and potential supply chain disruptions. Adoption of advanced scale inhibitor technologies is projected to increase by xx% annually during the forecast period. Specific challenges hindering growth are addressed in the section on obstacles.
Leading Regions, Countries, or Segments in APAC Scale Inhibitors Market
China and India dominate the APAC scale inhibitors market, driven by substantial industrial growth and significant investments in infrastructure projects, particularly in power generation and water treatment.
- Key Drivers in China: Massive investments in power generation, stringent environmental regulations, and a growing emphasis on water resource management.
- Key Drivers in India: Rapid industrialization, increasing demand for clean water, and government initiatives to improve water infrastructure.
- Other Key Regions: Southeast Asia is also showing promising growth potential due to increasing industrial activity and infrastructure development. Specific growth drivers for Southeast Asia are unavailable and need further investigation.
The power generation segment accounts for the largest market share, followed by oil & gas and desalination. This dominance is attributable to the critical role of scale inhibitors in preventing equipment damage and ensuring operational efficiency in these sectors.
APAC Scale Inhibitors Market Product Innovations
Recent innovations focus on developing eco-friendly, high-performance scale inhibitors with enhanced efficacy and reduced environmental impact. These include advanced polymer formulations that offer better scale inhibition at lower dosages and reduced toxicity. Improved dispersants and chelants further enhance performance, leading to extended equipment lifespan and reduced maintenance costs. Unique selling propositions include improved sustainability profiles, enhanced performance at elevated temperatures and pressures, and tailored solutions for specific water chemistries.
Propelling Factors for APAC Scale Inhibitors Market Growth
Several factors contribute to the market's growth trajectory. Firstly, the rising demand for clean water and efficient water management solutions, coupled with stringent environmental regulations, is a major driver. Secondly, significant investments in infrastructure projects, particularly in power generation and industrial facilities, increase the demand for scale inhibitors. Thirdly, technological advancements in scale inhibitor formulations, leading to enhanced performance and environmental sustainability, further fuel market expansion.
Obstacles in the APAC Scale Inhibitors Market
The APAC scale inhibitors market faces several challenges. Fluctuations in raw material prices and potential supply chain disruptions can impact profitability and product availability. Stringent regulatory requirements and environmental concerns necessitate costly research and development efforts to ensure product compliance. Furthermore, intense competition from established players and emerging companies exerts pressure on pricing and market share. Supply chain disruptions are estimated to have impacted market growth by approximately xx% in 2022.
Future Opportunities in APAC Scale Inhibitors Market
Emerging opportunities lie in the development of innovative, sustainable scale inhibitor solutions for niche applications, such as reverse osmosis (RO) membranes and geothermal power plants. Expanding into underdeveloped regions within APAC, coupled with strategic partnerships to enhance market penetration, offers significant growth potential. The growing adoption of digital technologies for water management and predictive maintenance presents further opportunities for value creation.
Major Players in the APAC Scale Inhibitors Market Ecosystem
- BWA Water Additives
- Chemtex Speciality Limited
- Dow
- Ecolab
- Genesys International Ltd
- Ion Exchange India Limited
- Italmatch Chemicals S.p.A.
- Kemira
- King Lee Technologies
- Kurita Water Industries Ltd
- Solenis
- Suez
- Thermax Ltd *List Not Exhaustive
Key Developments in APAC Scale Inhibitors Market Industry
- Q2 2023: Dow launched a new generation of environmentally friendly scale inhibitors.
- Q4 2022: Ecolab acquired a smaller competitor, expanding its market share in Southeast Asia. Specific deal value is confidential and not available for public disclosure.
- Q1 2021: Kemira invested in a new manufacturing facility in India to meet rising demand.
Strategic APAC Scale Inhibitors Market Forecast
The APAC scale inhibitors market is projected to experience robust growth throughout the forecast period (2025-2033), driven by continuous industrial expansion, urbanization, and increasing awareness of water scarcity. Technological advancements in scale inhibitor formulations and the growing adoption of sustainable practices will further contribute to market expansion. Significant investment opportunities exist for companies that can develop and deploy innovative, environmentally friendly scale inhibitor solutions tailored to the specific needs of different industries and regions within APAC. The market's future potential remains substantial, promising considerable returns for strategic players.
APAC Scale Inhibitors Market Segmentation
-
1. Type
- 1.1. Scale & Corrosion Inhibitors
- 1.2. Coagulants & Flocculants
- 1.3. pH Boosters
- 1.4. Oxygen Scavengers
- 1.5. Others
-
2. Chemistry
- 2.1. Basic Chemicals
- 2.2. Blended/Specialty Chemicals
-
3. End-user Industry
- 3.1. Power Generation
- 3.2. Steel & Metal Industry
- 3.3. Oil Refinery
- 3.4. Chemical & Petrochemical
- 3.5. Textile & Dye Industry
- 3.6. Sugar Mill
- 3.7. Paper Mill
- 3.8. Food & Beverage
- 3.9. Institutional
- 3.10. Pharmaceutical
- 3.11. Others
-
4. Geography
- 4.1. China
- 4.2. India
- 4.3. Japan
- 4.4. South Korea
- 4.5. ASEAN Countries
- 4.6. Rest of Asia-Pacific
APAC Scale Inhibitors Market Segmentation By Geography
- 1. China
- 2. India
- 3. Japan
- 4. South Korea
- 5. ASEAN Countries
- 6. Rest of Asia Pacific
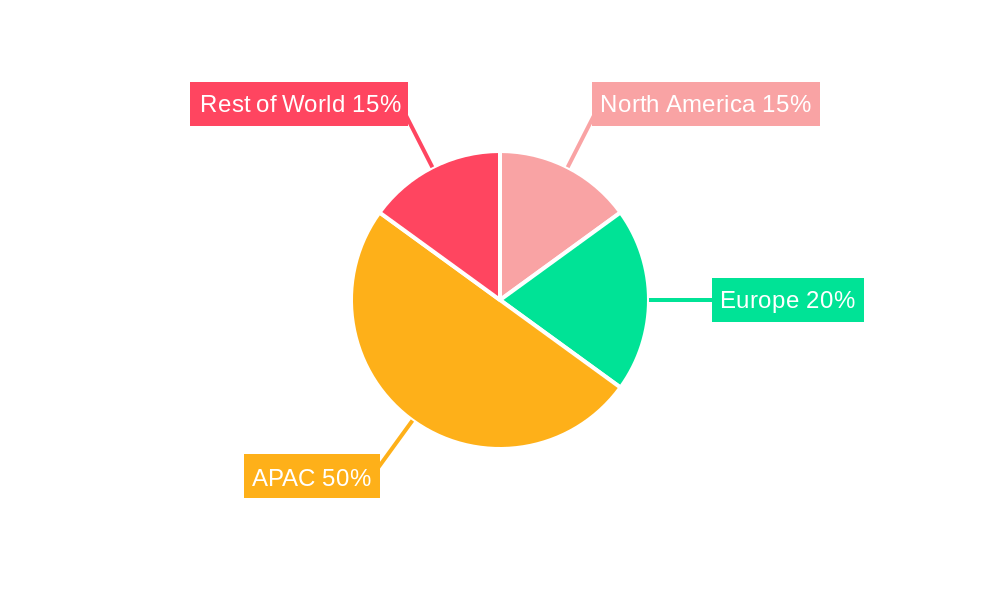
APAC Scale Inhibitors Market Regional Market Share
Geographic Coverage of APAC Scale Inhibitors Market
APAC Scale Inhibitors Market REPORT HIGHLIGHTS
| Aspects | Details |
|---|---|
| Study Period | 2020-2034 |
| Base Year | 2025 |
| Estimated Year | 2026 |
| Forecast Period | 2026-2034 |
| Historical Period | 2020-2025 |
| Growth Rate | CAGR of 5.1% from 2020-2034 |
| Segmentation |
|
Table of Contents
- 1. Introduction
- 1.1. Research Scope
- 1.2. Market Segmentation
- 1.3. Research Objective
- 1.4. Definitions and Assumptions
- 2. Executive Summary
- 2.1. Market Snapshot
- 3. Market Dynamics
- 3.1. Market Drivers
- 3.2. Market Restrains
- 3.3. Market Trends
- 3.4. Market Opportunities
- 4. Market Factor Analysis
- 4.1. Porters Five Forces
- 4.1.1. Bargaining Power of Suppliers
- 4.1.2. Bargaining Power of Buyers
- 4.1.3. Threat of New Entrants
- 4.1.4. Threat of Substitutes
- 4.1.5. Competitive Rivalry
- 4.2. PESTEL analysis
- 4.3. BCG Analysis
- 4.3.1. Stars (High Growth, High Market Share)
- 4.3.2. Cash Cows (Low Growth, High Market Share)
- 4.3.3. Question Mark (High Growth, Low Market Share)
- 4.3.4. Dogs (Low Growth, Low Market Share)
- 4.4. Ansoff Matrix Analysis
- 4.5. Supply Chain Analysis
- 4.6. Regulatory Landscape
- 4.7. Current Market Potential and Opportunity Assessment (TAM–SAM–SOM Framework)
- 4.8. DMV Analyst Note
- 4.1. Porters Five Forces
- 5. Market Analysis, Insights and Forecast 2021-2033
- 5.1. Market Analysis, Insights and Forecast - by Type
- 5.1.1. Scale & Corrosion Inhibitors
- 5.1.2. Coagulants & Flocculants
- 5.1.3. pH Boosters
- 5.1.4. Oxygen Scavengers
- 5.1.5. Others
- 5.2. Market Analysis, Insights and Forecast - by Chemistry
- 5.2.1. Basic Chemicals
- 5.2.2. Blended/Specialty Chemicals
- 5.3. Market Analysis, Insights and Forecast - by End-user Industry
- 5.3.1. Power Generation
- 5.3.2. Steel & Metal Industry
- 5.3.3. Oil Refinery
- 5.3.4. Chemical & Petrochemical
- 5.3.5. Textile & Dye Industry
- 5.3.6. Sugar Mill
- 5.3.7. Paper Mill
- 5.3.8. Food & Beverage
- 5.3.9. Institutional
- 5.3.10. Pharmaceutical
- 5.3.11. Others
- 5.4. Market Analysis, Insights and Forecast - by Geography
- 5.4.1. China
- 5.4.2. India
- 5.4.3. Japan
- 5.4.4. South Korea
- 5.4.5. ASEAN Countries
- 5.4.6. Rest of Asia-Pacific
- 5.5. Market Analysis, Insights and Forecast - by Region
- 5.5.1. China
- 5.5.2. India
- 5.5.3. Japan
- 5.5.4. South Korea
- 5.5.5. ASEAN Countries
- 5.5.6. Rest of Asia Pacific
- 5.1. Market Analysis, Insights and Forecast - by Type
- 6. Global APAC Scale Inhibitors Market Analysis, Insights and Forecast, 2021-2033
- 6.1. Market Analysis, Insights and Forecast - by Type
- 6.1.1. Scale & Corrosion Inhibitors
- 6.1.2. Coagulants & Flocculants
- 6.1.3. pH Boosters
- 6.1.4. Oxygen Scavengers
- 6.1.5. Others
- 6.2. Market Analysis, Insights and Forecast - by Chemistry
- 6.2.1. Basic Chemicals
- 6.2.2. Blended/Specialty Chemicals
- 6.3. Market Analysis, Insights and Forecast - by End-user Industry
- 6.3.1. Power Generation
- 6.3.2. Steel & Metal Industry
- 6.3.3. Oil Refinery
- 6.3.4. Chemical & Petrochemical
- 6.3.5. Textile & Dye Industry
- 6.3.6. Sugar Mill
- 6.3.7. Paper Mill
- 6.3.8. Food & Beverage
- 6.3.9. Institutional
- 6.3.10. Pharmaceutical
- 6.3.11. Others
- 6.4. Market Analysis, Insights and Forecast - by Geography
- 6.4.1. China
- 6.4.2. India
- 6.4.3. Japan
- 6.4.4. South Korea
- 6.4.5. ASEAN Countries
- 6.4.6. Rest of Asia-Pacific
- 6.1. Market Analysis, Insights and Forecast - by Type
- 7. China APAC Scale Inhibitors Market Analysis, Insights and Forecast, 2020-2032
- 7.1. Market Analysis, Insights and Forecast - by Type
- 7.1.1. Scale & Corrosion Inhibitors
- 7.1.2. Coagulants & Flocculants
- 7.1.3. pH Boosters
- 7.1.4. Oxygen Scavengers
- 7.1.5. Others
- 7.2. Market Analysis, Insights and Forecast - by Chemistry
- 7.2.1. Basic Chemicals
- 7.2.2. Blended/Specialty Chemicals
- 7.3. Market Analysis, Insights and Forecast - by End-user Industry
- 7.3.1. Power Generation
- 7.3.2. Steel & Metal Industry
- 7.3.3. Oil Refinery
- 7.3.4. Chemical & Petrochemical
- 7.3.5. Textile & Dye Industry
- 7.3.6. Sugar Mill
- 7.3.7. Paper Mill
- 7.3.8. Food & Beverage
- 7.3.9. Institutional
- 7.3.10. Pharmaceutical
- 7.3.11. Others
- 7.4. Market Analysis, Insights and Forecast - by Geography
- 7.4.1. China
- 7.4.2. India
- 7.4.3. Japan
- 7.4.4. South Korea
- 7.4.5. ASEAN Countries
- 7.4.6. Rest of Asia-Pacific
- 7.1. Market Analysis, Insights and Forecast - by Type
- 8. India APAC Scale Inhibitors Market Analysis, Insights and Forecast, 2020-2032
- 8.1. Market Analysis, Insights and Forecast - by Type
- 8.1.1. Scale & Corrosion Inhibitors
- 8.1.2. Coagulants & Flocculants
- 8.1.3. pH Boosters
- 8.1.4. Oxygen Scavengers
- 8.1.5. Others
- 8.2. Market Analysis, Insights and Forecast - by Chemistry
- 8.2.1. Basic Chemicals
- 8.2.2. Blended/Specialty Chemicals
- 8.3. Market Analysis, Insights and Forecast - by End-user Industry
- 8.3.1. Power Generation
- 8.3.2. Steel & Metal Industry
- 8.3.3. Oil Refinery
- 8.3.4. Chemical & Petrochemical
- 8.3.5. Textile & Dye Industry
- 8.3.6. Sugar Mill
- 8.3.7. Paper Mill
- 8.3.8. Food & Beverage
- 8.3.9. Institutional
- 8.3.10. Pharmaceutical
- 8.3.11. Others
- 8.4. Market Analysis, Insights and Forecast - by Geography
- 8.4.1. China
- 8.4.2. India
- 8.4.3. Japan
- 8.4.4. South Korea
- 8.4.5. ASEAN Countries
- 8.4.6. Rest of Asia-Pacific
- 8.1. Market Analysis, Insights and Forecast - by Type
- 9. Japan APAC Scale Inhibitors Market Analysis, Insights and Forecast, 2020-2032
- 9.1. Market Analysis, Insights and Forecast - by Type
- 9.1.1. Scale & Corrosion Inhibitors
- 9.1.2. Coagulants & Flocculants
- 9.1.3. pH Boosters
- 9.1.4. Oxygen Scavengers
- 9.1.5. Others
- 9.2. Market Analysis, Insights and Forecast - by Chemistry
- 9.2.1. Basic Chemicals
- 9.2.2. Blended/Specialty Chemicals
- 9.3. Market Analysis, Insights and Forecast - by End-user Industry
- 9.3.1. Power Generation
- 9.3.2. Steel & Metal Industry
- 9.3.3. Oil Refinery
- 9.3.4. Chemical & Petrochemical
- 9.3.5. Textile & Dye Industry
- 9.3.6. Sugar Mill
- 9.3.7. Paper Mill
- 9.3.8. Food & Beverage
- 9.3.9. Institutional
- 9.3.10. Pharmaceutical
- 9.3.11. Others
- 9.4. Market Analysis, Insights and Forecast - by Geography
- 9.4.1. China
- 9.4.2. India
- 9.4.3. Japan
- 9.4.4. South Korea
- 9.4.5. ASEAN Countries
- 9.4.6. Rest of Asia-Pacific
- 9.1. Market Analysis, Insights and Forecast - by Type
- 10. South Korea APAC Scale Inhibitors Market Analysis, Insights and Forecast, 2020-2032
- 10.1. Market Analysis, Insights and Forecast - by Type
- 10.1.1. Scale & Corrosion Inhibitors
- 10.1.2. Coagulants & Flocculants
- 10.1.3. pH Boosters
- 10.1.4. Oxygen Scavengers
- 10.1.5. Others
- 10.2. Market Analysis, Insights and Forecast - by Chemistry
- 10.2.1. Basic Chemicals
- 10.2.2. Blended/Specialty Chemicals
- 10.3. Market Analysis, Insights and Forecast - by End-user Industry
- 10.3.1. Power Generation
- 10.3.2. Steel & Metal Industry
- 10.3.3. Oil Refinery
- 10.3.4. Chemical & Petrochemical
- 10.3.5. Textile & Dye Industry
- 10.3.6. Sugar Mill
- 10.3.7. Paper Mill
- 10.3.8. Food & Beverage
- 10.3.9. Institutional
- 10.3.10. Pharmaceutical
- 10.3.11. Others
- 10.4. Market Analysis, Insights and Forecast - by Geography
- 10.4.1. China
- 10.4.2. India
- 10.4.3. Japan
- 10.4.4. South Korea
- 10.4.5. ASEAN Countries
- 10.4.6. Rest of Asia-Pacific
- 10.1. Market Analysis, Insights and Forecast - by Type
- 11. ASEAN Countries APAC Scale Inhibitors Market Analysis, Insights and Forecast, 2020-2032
- 11.1. Market Analysis, Insights and Forecast - by Type
- 11.1.1. Scale & Corrosion Inhibitors
- 11.1.2. Coagulants & Flocculants
- 11.1.3. pH Boosters
- 11.1.4. Oxygen Scavengers
- 11.1.5. Others
- 11.2. Market Analysis, Insights and Forecast - by Chemistry
- 11.2.1. Basic Chemicals
- 11.2.2. Blended/Specialty Chemicals
- 11.3. Market Analysis, Insights and Forecast - by End-user Industry
- 11.3.1. Power Generation
- 11.3.2. Steel & Metal Industry
- 11.3.3. Oil Refinery
- 11.3.4. Chemical & Petrochemical
- 11.3.5. Textile & Dye Industry
- 11.3.6. Sugar Mill
- 11.3.7. Paper Mill
- 11.3.8. Food & Beverage
- 11.3.9. Institutional
- 11.3.10. Pharmaceutical
- 11.3.11. Others
- 11.4. Market Analysis, Insights and Forecast - by Geography
- 11.4.1. China
- 11.4.2. India
- 11.4.3. Japan
- 11.4.4. South Korea
- 11.4.5. ASEAN Countries
- 11.4.6. Rest of Asia-Pacific
- 11.1. Market Analysis, Insights and Forecast - by Type
- 12. Rest of Asia Pacific APAC Scale Inhibitors Market Analysis, Insights and Forecast, 2020-2032
- 12.1. Market Analysis, Insights and Forecast - by Type
- 12.1.1. Scale & Corrosion Inhibitors
- 12.1.2. Coagulants & Flocculants
- 12.1.3. pH Boosters
- 12.1.4. Oxygen Scavengers
- 12.1.5. Others
- 12.2. Market Analysis, Insights and Forecast - by Chemistry
- 12.2.1. Basic Chemicals
- 12.2.2. Blended/Specialty Chemicals
- 12.3. Market Analysis, Insights and Forecast - by End-user Industry
- 12.3.1. Power Generation
- 12.3.2. Steel & Metal Industry
- 12.3.3. Oil Refinery
- 12.3.4. Chemical & Petrochemical
- 12.3.5. Textile & Dye Industry
- 12.3.6. Sugar Mill
- 12.3.7. Paper Mill
- 12.3.8. Food & Beverage
- 12.3.9. Institutional
- 12.3.10. Pharmaceutical
- 12.3.11. Others
- 12.4. Market Analysis, Insights and Forecast - by Geography
- 12.4.1. China
- 12.4.2. India
- 12.4.3. Japan
- 12.4.4. South Korea
- 12.4.5. ASEAN Countries
- 12.4.6. Rest of Asia-Pacific
- 12.1. Market Analysis, Insights and Forecast - by Type
- 13. Competitive Analysis
- 13.1. Company Profiles
- 13.1.1 BWA Water Additives
- 13.1.1.1. Company Overview
- 13.1.1.2. Products
- 13.1.1.3. Company Financials
- 13.1.1.4. SWOT Analysis
- 13.1.2 Chemtex Speciality Limited
- 13.1.2.1. Company Overview
- 13.1.2.2. Products
- 13.1.2.3. Company Financials
- 13.1.2.4. SWOT Analysis
- 13.1.3 Dow
- 13.1.3.1. Company Overview
- 13.1.3.2. Products
- 13.1.3.3. Company Financials
- 13.1.3.4. SWOT Analysis
- 13.1.4 Ecolab
- 13.1.4.1. Company Overview
- 13.1.4.2. Products
- 13.1.4.3. Company Financials
- 13.1.4.4. SWOT Analysis
- 13.1.5 Genesys International Ltd
- 13.1.5.1. Company Overview
- 13.1.5.2. Products
- 13.1.5.3. Company Financials
- 13.1.5.4. SWOT Analysis
- 13.1.6 Ion Exchange India Limited
- 13.1.6.1. Company Overview
- 13.1.6.2. Products
- 13.1.6.3. Company Financials
- 13.1.6.4. SWOT Analysis
- 13.1.7 Italmatch Chemicals S P A
- 13.1.7.1. Company Overview
- 13.1.7.2. Products
- 13.1.7.3. Company Financials
- 13.1.7.4. SWOT Analysis
- 13.1.8 Kemira
- 13.1.8.1. Company Overview
- 13.1.8.2. Products
- 13.1.8.3. Company Financials
- 13.1.8.4. SWOT Analysis
- 13.1.9 King Lee Technologies
- 13.1.9.1. Company Overview
- 13.1.9.2. Products
- 13.1.9.3. Company Financials
- 13.1.9.4. SWOT Analysis
- 13.1.10 Kurita Water Industries Ltd
- 13.1.10.1. Company Overview
- 13.1.10.2. Products
- 13.1.10.3. Company Financials
- 13.1.10.4. SWOT Analysis
- 13.1.11 Solenis
- 13.1.11.1. Company Overview
- 13.1.11.2. Products
- 13.1.11.3. Company Financials
- 13.1.11.4. SWOT Analysis
- 13.1.12 Suez
- 13.1.12.1. Company Overview
- 13.1.12.2. Products
- 13.1.12.3. Company Financials
- 13.1.12.4. SWOT Analysis
- 13.1.13 Thermax Ltd*List Not Exhaustive
- 13.1.13.1. Company Overview
- 13.1.13.2. Products
- 13.1.13.3. Company Financials
- 13.1.13.4. SWOT Analysis
- 13.1.1 BWA Water Additives
- 13.2. Market Entropy
- 13.2.1 Company's Key Areas Served
- 13.2.2 Recent Developments
- 13.3. Company Market Share Analysis 2025
- 13.3.1 Top 5 Companies Market Share Analysis
- 13.3.2 Top 3 Companies Market Share Analysis
- 13.4. List of Potential Customers
- 14. Research Methodology
List of Figures
- Figure 1: Global APAC Scale Inhibitors Market Revenue Breakdown (billion, %) by Region 2025 & 2033
- Figure 2: China APAC Scale Inhibitors Market Revenue (billion), by Type 2025 & 2033
- Figure 3: China APAC Scale Inhibitors Market Revenue Share (%), by Type 2025 & 2033
- Figure 4: China APAC Scale Inhibitors Market Revenue (billion), by Chemistry 2025 & 2033
- Figure 5: China APAC Scale Inhibitors Market Revenue Share (%), by Chemistry 2025 & 2033
- Figure 6: China APAC Scale Inhibitors Market Revenue (billion), by End-user Industry 2025 & 2033
- Figure 7: China APAC Scale Inhibitors Market Revenue Share (%), by End-user Industry 2025 & 2033
- Figure 8: China APAC Scale Inhibitors Market Revenue (billion), by Geography 2025 & 2033
- Figure 9: China APAC Scale Inhibitors Market Revenue Share (%), by Geography 2025 & 2033
- Figure 10: China APAC Scale Inhibitors Market Revenue (billion), by Country 2025 & 2033
- Figure 11: China APAC Scale Inhibitors Market Revenue Share (%), by Country 2025 & 2033
- Figure 12: India APAC Scale Inhibitors Market Revenue (billion), by Type 2025 & 2033
- Figure 13: India APAC Scale Inhibitors Market Revenue Share (%), by Type 2025 & 2033
- Figure 14: India APAC Scale Inhibitors Market Revenue (billion), by Chemistry 2025 & 2033
- Figure 15: India APAC Scale Inhibitors Market Revenue Share (%), by Chemistry 2025 & 2033
- Figure 16: India APAC Scale Inhibitors Market Revenue (billion), by End-user Industry 2025 & 2033
- Figure 17: India APAC Scale Inhibitors Market Revenue Share (%), by End-user Industry 2025 & 2033
- Figure 18: India APAC Scale Inhibitors Market Revenue (billion), by Geography 2025 & 2033
- Figure 19: India APAC Scale Inhibitors Market Revenue Share (%), by Geography 2025 & 2033
- Figure 20: India APAC Scale Inhibitors Market Revenue (billion), by Country 2025 & 2033
- Figure 21: India APAC Scale Inhibitors Market Revenue Share (%), by Country 2025 & 2033
- Figure 22: Japan APAC Scale Inhibitors Market Revenue (billion), by Type 2025 & 2033
- Figure 23: Japan APAC Scale Inhibitors Market Revenue Share (%), by Type 2025 & 2033
- Figure 24: Japan APAC Scale Inhibitors Market Revenue (billion), by Chemistry 2025 & 2033
- Figure 25: Japan APAC Scale Inhibitors Market Revenue Share (%), by Chemistry 2025 & 2033
- Figure 26: Japan APAC Scale Inhibitors Market Revenue (billion), by End-user Industry 2025 & 2033
- Figure 27: Japan APAC Scale Inhibitors Market Revenue Share (%), by End-user Industry 2025 & 2033
- Figure 28: Japan APAC Scale Inhibitors Market Revenue (billion), by Geography 2025 & 2033
- Figure 29: Japan APAC Scale Inhibitors Market Revenue Share (%), by Geography 2025 & 2033
- Figure 30: Japan APAC Scale Inhibitors Market Revenue (billion), by Country 2025 & 2033
- Figure 31: Japan APAC Scale Inhibitors Market Revenue Share (%), by Country 2025 & 2033
- Figure 32: South Korea APAC Scale Inhibitors Market Revenue (billion), by Type 2025 & 2033
- Figure 33: South Korea APAC Scale Inhibitors Market Revenue Share (%), by Type 2025 & 2033
- Figure 34: South Korea APAC Scale Inhibitors Market Revenue (billion), by Chemistry 2025 & 2033
- Figure 35: South Korea APAC Scale Inhibitors Market Revenue Share (%), by Chemistry 2025 & 2033
- Figure 36: South Korea APAC Scale Inhibitors Market Revenue (billion), by End-user Industry 2025 & 2033
- Figure 37: South Korea APAC Scale Inhibitors Market Revenue Share (%), by End-user Industry 2025 & 2033
- Figure 38: South Korea APAC Scale Inhibitors Market Revenue (billion), by Geography 2025 & 2033
- Figure 39: South Korea APAC Scale Inhibitors Market Revenue Share (%), by Geography 2025 & 2033
- Figure 40: South Korea APAC Scale Inhibitors Market Revenue (billion), by Country 2025 & 2033
- Figure 41: South Korea APAC Scale Inhibitors Market Revenue Share (%), by Country 2025 & 2033
- Figure 42: ASEAN Countries APAC Scale Inhibitors Market Revenue (billion), by Type 2025 & 2033
- Figure 43: ASEAN Countries APAC Scale Inhibitors Market Revenue Share (%), by Type 2025 & 2033
- Figure 44: ASEAN Countries APAC Scale Inhibitors Market Revenue (billion), by Chemistry 2025 & 2033
- Figure 45: ASEAN Countries APAC Scale Inhibitors Market Revenue Share (%), by Chemistry 2025 & 2033
- Figure 46: ASEAN Countries APAC Scale Inhibitors Market Revenue (billion), by End-user Industry 2025 & 2033
- Figure 47: ASEAN Countries APAC Scale Inhibitors Market Revenue Share (%), by End-user Industry 2025 & 2033
- Figure 48: ASEAN Countries APAC Scale Inhibitors Market Revenue (billion), by Geography 2025 & 2033
- Figure 49: ASEAN Countries APAC Scale Inhibitors Market Revenue Share (%), by Geography 2025 & 2033
- Figure 50: ASEAN Countries APAC Scale Inhibitors Market Revenue (billion), by Country 2025 & 2033
- Figure 51: ASEAN Countries APAC Scale Inhibitors Market Revenue Share (%), by Country 2025 & 2033
- Figure 52: Rest of Asia Pacific APAC Scale Inhibitors Market Revenue (billion), by Type 2025 & 2033
- Figure 53: Rest of Asia Pacific APAC Scale Inhibitors Market Revenue Share (%), by Type 2025 & 2033
- Figure 54: Rest of Asia Pacific APAC Scale Inhibitors Market Revenue (billion), by Chemistry 2025 & 2033
- Figure 55: Rest of Asia Pacific APAC Scale Inhibitors Market Revenue Share (%), by Chemistry 2025 & 2033
- Figure 56: Rest of Asia Pacific APAC Scale Inhibitors Market Revenue (billion), by End-user Industry 2025 & 2033
- Figure 57: Rest of Asia Pacific APAC Scale Inhibitors Market Revenue Share (%), by End-user Industry 2025 & 2033
- Figure 58: Rest of Asia Pacific APAC Scale Inhibitors Market Revenue (billion), by Geography 2025 & 2033
- Figure 59: Rest of Asia Pacific APAC Scale Inhibitors Market Revenue Share (%), by Geography 2025 & 2033
- Figure 60: Rest of Asia Pacific APAC Scale Inhibitors Market Revenue (billion), by Country 2025 & 2033
- Figure 61: Rest of Asia Pacific APAC Scale Inhibitors Market Revenue Share (%), by Country 2025 & 2033
List of Tables
- Table 1: Global APAC Scale Inhibitors Market Revenue billion Forecast, by Type 2020 & 2033
- Table 2: Global APAC Scale Inhibitors Market Revenue billion Forecast, by Chemistry 2020 & 2033
- Table 3: Global APAC Scale Inhibitors Market Revenue billion Forecast, by End-user Industry 2020 & 2033
- Table 4: Global APAC Scale Inhibitors Market Revenue billion Forecast, by Geography 2020 & 2033
- Table 5: Global APAC Scale Inhibitors Market Revenue billion Forecast, by Region 2020 & 2033
- Table 6: Global APAC Scale Inhibitors Market Revenue billion Forecast, by Type 2020 & 2033
- Table 7: Global APAC Scale Inhibitors Market Revenue billion Forecast, by Chemistry 2020 & 2033
- Table 8: Global APAC Scale Inhibitors Market Revenue billion Forecast, by End-user Industry 2020 & 2033
- Table 9: Global APAC Scale Inhibitors Market Revenue billion Forecast, by Geography 2020 & 2033
- Table 10: Global APAC Scale Inhibitors Market Revenue billion Forecast, by Country 2020 & 2033
- Table 11: Global APAC Scale Inhibitors Market Revenue billion Forecast, by Type 2020 & 2033
- Table 12: Global APAC Scale Inhibitors Market Revenue billion Forecast, by Chemistry 2020 & 2033
- Table 13: Global APAC Scale Inhibitors Market Revenue billion Forecast, by End-user Industry 2020 & 2033
- Table 14: Global APAC Scale Inhibitors Market Revenue billion Forecast, by Geography 2020 & 2033
- Table 15: Global APAC Scale Inhibitors Market Revenue billion Forecast, by Country 2020 & 2033
- Table 16: Global APAC Scale Inhibitors Market Revenue billion Forecast, by Type 2020 & 2033
- Table 17: Global APAC Scale Inhibitors Market Revenue billion Forecast, by Chemistry 2020 & 2033
- Table 18: Global APAC Scale Inhibitors Market Revenue billion Forecast, by End-user Industry 2020 & 2033
- Table 19: Global APAC Scale Inhibitors Market Revenue billion Forecast, by Geography 2020 & 2033
- Table 20: Global APAC Scale Inhibitors Market Revenue billion Forecast, by Country 2020 & 2033
- Table 21: Global APAC Scale Inhibitors Market Revenue billion Forecast, by Type 2020 & 2033
- Table 22: Global APAC Scale Inhibitors Market Revenue billion Forecast, by Chemistry 2020 & 2033
- Table 23: Global APAC Scale Inhibitors Market Revenue billion Forecast, by End-user Industry 2020 & 2033
- Table 24: Global APAC Scale Inhibitors Market Revenue billion Forecast, by Geography 2020 & 2033
- Table 25: Global APAC Scale Inhibitors Market Revenue billion Forecast, by Country 2020 & 2033
- Table 26: Global APAC Scale Inhibitors Market Revenue billion Forecast, by Type 2020 & 2033
- Table 27: Global APAC Scale Inhibitors Market Revenue billion Forecast, by Chemistry 2020 & 2033
- Table 28: Global APAC Scale Inhibitors Market Revenue billion Forecast, by End-user Industry 2020 & 2033
- Table 29: Global APAC Scale Inhibitors Market Revenue billion Forecast, by Geography 2020 & 2033
- Table 30: Global APAC Scale Inhibitors Market Revenue billion Forecast, by Country 2020 & 2033
- Table 31: Global APAC Scale Inhibitors Market Revenue billion Forecast, by Type 2020 & 2033
- Table 32: Global APAC Scale Inhibitors Market Revenue billion Forecast, by Chemistry 2020 & 2033
- Table 33: Global APAC Scale Inhibitors Market Revenue billion Forecast, by End-user Industry 2020 & 2033
- Table 34: Global APAC Scale Inhibitors Market Revenue billion Forecast, by Geography 2020 & 2033
- Table 35: Global APAC Scale Inhibitors Market Revenue billion Forecast, by Country 2020 & 2033
Frequently Asked Questions
1. What is the projected Compound Annual Growth Rate (CAGR) of the APAC Scale Inhibitors Market?
The projected CAGR is approximately 5.1%.
2. Which companies are prominent players in the APAC Scale Inhibitors Market?
Key companies in the market include BWA Water Additives, Chemtex Speciality Limited, Dow, Ecolab, Genesys International Ltd, Ion Exchange India Limited, Italmatch Chemicals S P A, Kemira, King Lee Technologies, Kurita Water Industries Ltd, Solenis, Suez, Thermax Ltd*List Not Exhaustive.
3. What are the main segments of the APAC Scale Inhibitors Market?
The market segments include Type, Chemistry, End-user Industry, Geography.
4. Can you provide details about the market size?
The market size is estimated to be USD 3.98 billion as of 2022.
5. What are some drivers contributing to market growth?
; Accelerating usage in Power Industry; Growing Popularity of Zero Liquid Blowdown.
6. What are the notable trends driving market growth?
Scale & Corrosion Inhibitors to Dominate the Market.
7. Are there any restraints impacting market growth?
; Accelerating usage in Power Industry; Growing Popularity of Zero Liquid Blowdown.
8. Can you provide examples of recent developments in the market?
N/A
9. What pricing options are available for accessing the report?
Pricing options include single-user, multi-user, and enterprise licenses priced at USD 4750, USD 5250, and USD 8750 respectively.
10. Is the market size provided in terms of value or volume?
The market size is provided in terms of value, measured in billion.
11. Are there any specific market keywords associated with the report?
Yes, the market keyword associated with the report is "APAC Scale Inhibitors Market," which aids in identifying and referencing the specific market segment covered.
12. How do I determine which pricing option suits my needs best?
The pricing options vary based on user requirements and access needs. Individual users may opt for single-user licenses, while businesses requiring broader access may choose multi-user or enterprise licenses for cost-effective access to the report.
13. Are there any additional resources or data provided in the APAC Scale Inhibitors Market report?
While the report offers comprehensive insights, it's advisable to review the specific contents or supplementary materials provided to ascertain if additional resources or data are available.
14. How can I stay updated on further developments or reports in the APAC Scale Inhibitors Market?
To stay informed about further developments, trends, and reports in the APAC Scale Inhibitors Market, consider subscribing to industry newsletters, following relevant companies and organizations, or regularly checking reputable industry news sources and publications.
Methodology
Step 1 - Identification of Relevant Samples Size from Population Database


Step 2 - Approaches for Defining Global Market Size (Value, Volume* & Price*)

Note*: In applicable scenarios
Step 3 - Data Sources
Primary Research
- Web Analytics
- Survey Reports
- Research Institute
- Latest Research Reports
- Opinion Leaders
Secondary Research
- Annual Reports
- White Paper
- Latest Press Release
- Industry Association
- Paid Database
- Investor Presentations

Step 4 - Data Triangulation
Involves using different sources of information in order to increase the validity of a study
These sources are likely to be stakeholders in a program - participants, other researchers, program staff, other community members, and so on.
Then we put all data in single framework & apply various statistical tools to find out the dynamic on the market.
During the analysis stage, feedback from the stakeholder groups would be compared to determine areas of agreement as well as areas of divergence