

Key Insights
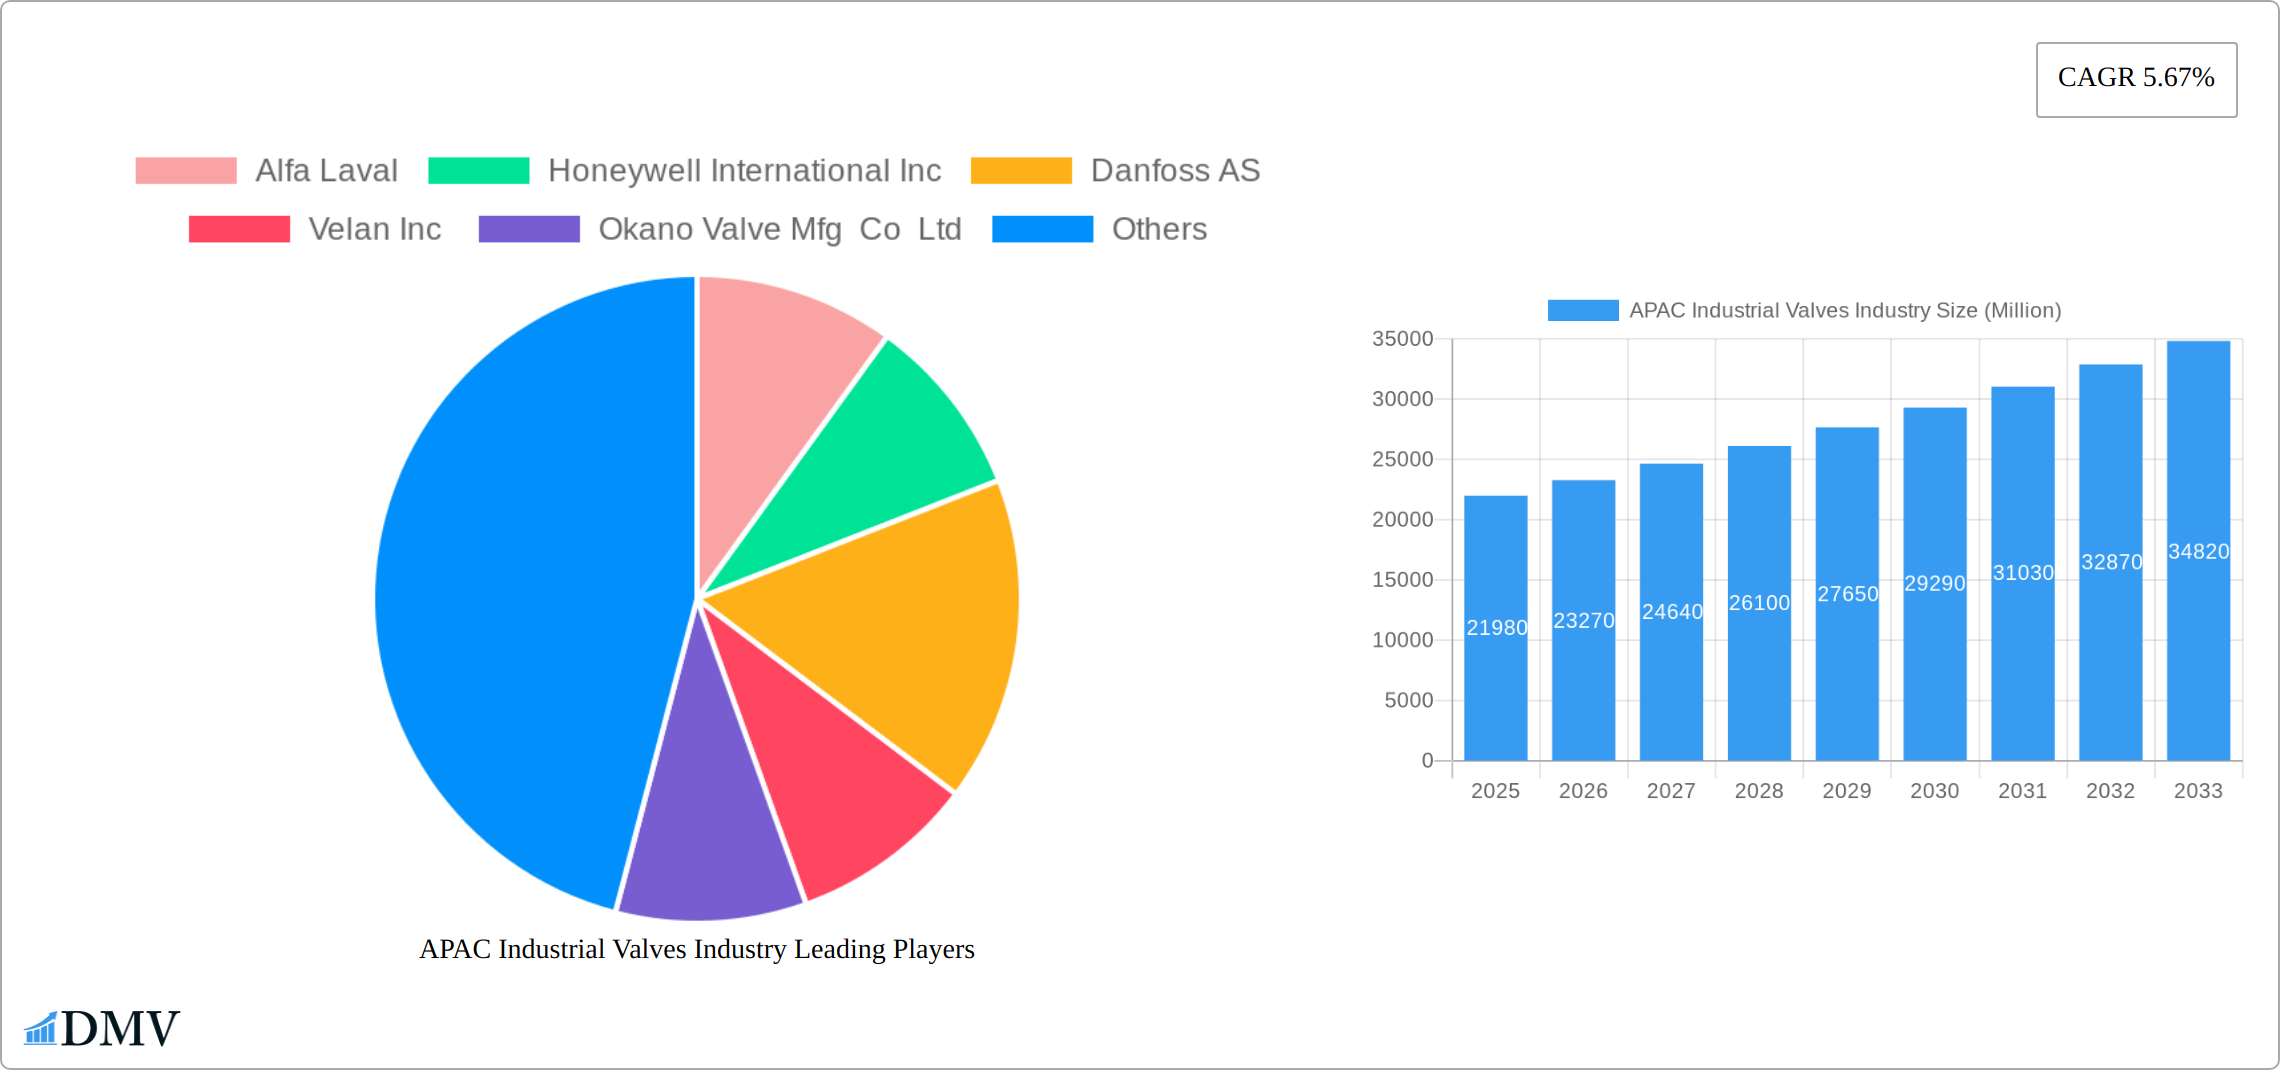
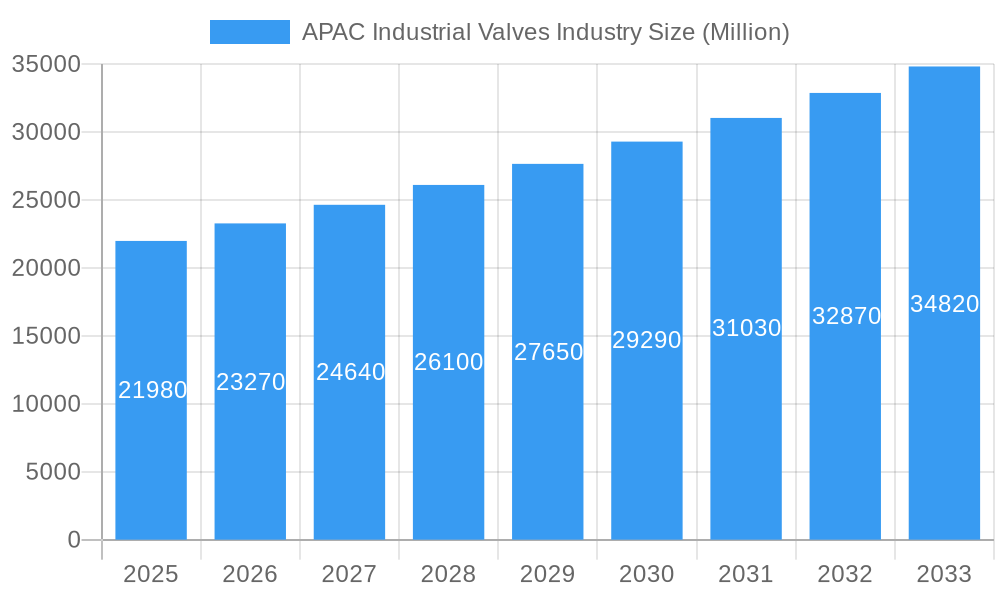
The Asia-Pacific (APAC) industrial valves market, valued at $21.98 billion in 2025, is projected to experience robust growth, driven by a Compound Annual Growth Rate (CAGR) of 5.67% from 2025 to 2033. This expansion is fueled by several key factors. Firstly, the burgeoning industrial sectors across APAC, particularly in China, India, and South Korea, are significantly increasing the demand for efficient and reliable industrial valves across diverse applications. The food processing and pulp and paper industries are experiencing substantial growth, necessitating advanced valve technologies for improved process control and efficiency. Furthermore, increasing investments in infrastructure projects, including power generation and water and wastewater management (including desalination), are creating significant opportunities for industrial valve manufacturers. The rising adoption of automation and smart manufacturing technologies further contributes to market growth, as these technologies often require sophisticated valve systems for precise control and monitoring. Finally, government initiatives promoting industrial development and infrastructure modernization in several APAC countries are providing a supportive environment for market expansion.
APAC Industrial Valves Industry Market Size (In Billion)
However, several challenges could potentially restrain market growth. Fluctuations in raw material prices, particularly metals used in valve manufacturing, can impact production costs and profitability. Furthermore, intense competition among established players and new entrants requires manufacturers to continuously innovate and offer cost-effective and technologically superior products. Supply chain disruptions and geopolitical uncertainties also present risks to the market's steady growth trajectory. Despite these challenges, the long-term outlook for the APAC industrial valves market remains positive, driven by the region's sustained industrialization and infrastructure development initiatives. The market’s segmentation across various valve types (butterfly, ball, globe, gate, plug), product categories (quarter-turn, multi-turn), and applications indicates a diverse landscape offering ample opportunities for specialized players to establish a strong market presence. Specific growth within segments will likely be driven by factors such as the increasing demand for specific valve types in particular industries or the adoption of new technologies within those segments.
APAC Industrial Valves Industry Company Market Share
APAC Industrial Valves Industry Market Composition & Trends
The APAC industrial valves market is characterized by a mix of high concentration and dynamic innovation, driven by a blend of local and global players. The market share is predominantly held by leading companies such as Alfa Laval, Honeywell International Inc, and Flowserve Corporation, with these entities accounting for approximately 40% of the market. Innovation catalysts include the adoption of IoT and AI technologies for smarter valve solutions, particularly in the water and wastewater management sector. Regulatory landscapes across APAC vary, with stringent standards in countries like Japan and South Korea promoting safer and more efficient valve technologies. The presence of substitute products like diaphragm pumps poses a challenge, yet the unique capabilities of industrial valves maintain their market position. End-user profiles range from power generation facilities to chemical plants, each with specific valve requirements. M&A activities have been robust, with deals valued at around 500 Million in the last two years, reflecting strategic consolidations aimed at expanding product portfolios and market reach.
- Market Concentration: Dominated by key players such as Alfa Laval and Flowserve, holding about 40% of the market.
- Innovation Catalysts: IoT and AI integration for enhanced valve functionality.
- Regulatory Landscapes: Strict standards in Japan and South Korea fostering innovation.
- Substitute Products: Diaphragm pumps as alternatives, yet industrial valves remain vital.
- End-User Profiles: Diverse, from power to chemical industries, requiring tailored solutions.
- M&A Activities: Recent deals worth approximately 500 Million, driving market consolidation.
APAC Industrial Valves Industry Industry Evolution
The APAC industrial valves industry is undergoing a period of significant transformation, characterized by robust growth, rapid technological advancements, and evolving customer demands. From 2019 to 2033, the market is projected to experience a compound annual growth rate (CAGR) of approximately 5%, fueled by increased industrial activity and substantial infrastructure development across the region. This expansion is significantly driven by the adoption of smart valves incorporating advanced sensor technology and sophisticated control systems, leading to enhanced operational efficiency and the implementation of predictive maintenance strategies. The ongoing shift towards automation and digitalization is further propelling demand for sophisticated valve solutions, particularly within key sectors such as oil and gas, water management, and chemical processing. The penetration of smart valves in these sectors is anticipated to increase from 20% in 2019 to a projected 40% by 2025. Furthermore, a growing emphasis on sustainability and energy efficiency is reshaping consumer preferences, compelling manufacturers to prioritize the development and deployment of eco-friendly valve technologies. Supportive regional government initiatives focused on industrial expansion and technological innovation are also contributing to the positive outlook for continued market growth in the APAC region.
Leading Regions, Countries, or Segments in APAC Industrial Valves Industry
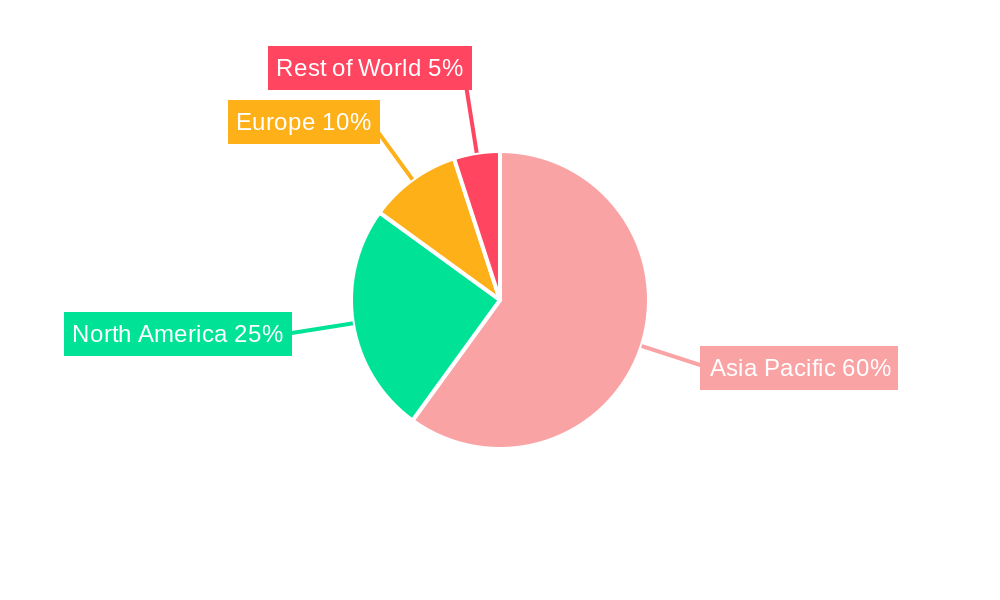
The Asia Pacific region showcases diverse leadership across various segments of the industrial valves market, with China and India emerging as dominant players due to their expansive industrial bases and rapid infrastructural developments.
China:
Key Drivers: Massive investments in water and wastewater management, coupled with strong government support for industrial growth.
Dominance Factors: China's dominance is bolstered by its large manufacturing sector and the adoption of advanced valve technologies in power generation and chemical industries. The country's focus on smart city projects and sustainable industrial practices further drives demand for high-quality valves.
India:
Key Drivers: Significant investments in infrastructure, particularly in the power and water sectors, alongside favorable government policies promoting industrial growth.
Dominance Factors: India's burgeoning demand for industrial valves is driven by its expanding manufacturing base and the push towards modernization in various sectors. The country's emphasis on improving water and wastewater management systems has led to increased adoption of advanced valve solutions.
By Segment:
Downstream - Food Processing:
- Key Drivers: Rising demand for processed foods and stringent hygiene standards.
- Dominance Factors: The food processing segment's growth is propelled by the need for reliable and hygienic valve solutions to ensure product safety and quality.
By Type - Butterfly Valve:
- Key Drivers: Cost-effectiveness and versatility in applications.
- Dominance Factors: Butterfly valves are favored for their wide range of uses, from water treatment to chemical processing, due to their efficiency and lower cost compared to other valve types.
By Product - Quarter-turn Valve:
- Key Drivers: Quick operation and ease of automation.
- Dominance Factors: The quarter-turn valve's popularity stems from its suitability for applications requiring rapid on/off control, enhancing operational efficiency in various industries.
By Application - Water and Wastewater Management:
- Key Drivers: Growing urbanization and the need for efficient water management systems.
- Dominance Factors: The water and wastewater management segment's dominance is driven by increasing investments in water infrastructure and the adoption of advanced valve technologies to enhance system performance and sustainability.
APAC Industrial Valves Industry Product Innovations
Recent innovations within the APAC industrial valves market are primarily focused on enhancing performance, functionality, and overall efficiency. Smart valves, seamlessly integrated with Internet of Things (IoT) and Artificial Intelligence (AI) technologies, represent a pivotal advancement, providing real-time monitoring capabilities and enabling predictive maintenance. These innovations contribute to improved operational efficiency and significantly reduce downtime. The development and market introduction of eco-friendly valves, designed to minimize environmental impact, directly addresses the rising demand for sustainable solutions across diverse industrial sectors. Key value propositions for these advanced valves include enhanced durability, reduced energy consumption, and seamless compatibility with modern automation systems, placing them at the forefront of market growth and driving future adoption.
Propelling Factors for APAC Industrial Valves Industry Growth
The growth of the APAC industrial valves industry is propelled by several key factors:
- Technological Advancements: The integration of IoT and AI in valve systems enhances efficiency and reliability, driving market expansion.
- Economic Growth: Rapid industrialization and infrastructure development in countries like China and India increase demand for industrial valves.
- Regulatory Support: Government initiatives promoting sustainable industrial practices and smart city projects boost the adoption of advanced valve technologies.
These factors collectively contribute to a robust growth environment for the APAC industrial valves market.
Obstacles in the APAC Industrial Valves Industry Market
Despite the positive growth trajectory, the APAC industrial valves market faces several challenges that could potentially impede its progress:
- Regulatory Inconsistencies: Variations in regulatory standards across different countries within the APAC region can complicate compliance procedures and lead to increased operational costs for manufacturers and users.
- Supply Chain Vulnerabilities: Global supply chain disruptions, further exacerbated by geopolitical instability and unforeseen events, can result in production delays and increased costs, impacting market stability.
- Intense Competition: The presence of numerous established and emerging players creates a highly competitive market landscape, leading to potential price pressures and impacting profit margins for individual companies.
Overcoming these obstacles requires strategic planning, proactive adaptation, and a robust commitment to innovation to ensure continued market momentum.
Future Opportunities in APAC Industrial Valves Industry
Emerging opportunities in the APAC industrial valves industry include:
- New Markets: Expansion into emerging economies with growing industrial sectors, such as Southeast Asia.
- Technological Innovations: Continued development of smart and eco-friendly valve solutions to meet evolving industry needs.
- Consumer Trends: Increasing focus on sustainability and energy efficiency, driving demand for advanced valve technologies.
These opportunities highlight the potential for sustained growth and innovation in the market.
Major Players in the APAC Industrial Valves Industry Ecosystem
- Alfa Laval
- Honeywell International Inc
- Danfoss AS
- Velan Inc
- Okano Valve Mfg Co Ltd
- SAMSON AKTIENGESELLSCHAFT
- Flowserve Corporation
- The Weir Group PLC
- Georg Fischer Ltd
- Baker Hughes
- Emerson Electric Co
- CIRCOR International Inc
- AVK Holding AS
- PARKER HANNIFIN CORP
- EBRO ARMATUREN Gebr Brer GmbH
- Hitachi Metals Ltd
- ITT Inc
- NIBCO
- IMI Critical Engineering
- Crane Co
- Valvitalia SpA
- Curtiss-Wright Corporation
- Schlumberger Limited
- KITZ Corporation
Key Developments in APAC Industrial Valves Industry Industry
- March 2022: Flowserve announced a strategic partnership with Gradiant, a leading provider of advanced water and wastewater treatment solutions, to accelerate growth within the water technology sector across the Asia-Pacific region. This collaboration leverages Gradiant's expertise to enhance Flowserve's market position and expand its offerings in this critical market segment.
- February 2022: Emerson opened a new, state-of-the-art integrated manufacturing facility in Mahindra World City, Chennai, India. This facility consolidates the production of various fluid control and pneumatics products under one roof, optimizing manufacturing synergies and improving efficiency. The facility produces key components for several of Emerson's well-known brands, strengthening its manufacturing capabilities and solidifying its market presence in the region.
Strategic APAC Industrial Valves Industry Market Forecast
The strategic forecast for the APAC industrial valves market from 2025 to 2033 projects sustained robust growth, propelled by several key factors. The continued integration of smart technologies and the increasing emphasis on sustainability are anticipated to drive strong demand for advanced valve solutions. The expansion of industrial sectors in rapidly developing economies, coupled with government initiatives promoting infrastructure development, presents significant growth opportunities. The market's potential is further amplified by the growing focus on efficient and sustainable water and wastewater management solutions, where advanced valve technologies play a vital role. These factors collectively position the APAC industrial valves market for a promising future, with a projected CAGR of approximately 5% throughout the forecast period.
APAC Industrial Valves Industry Segmentation
-
1. Type
- 1.1. Butterfly Valve
- 1.2. Ball Valve
- 1.3. Globe Valve
- 1.4. Gate Valve
- 1.5. Plug Valve
- 1.6. Other Types
-
2. Product
- 2.1. Quarter-turn Valve
- 2.2. Multi-turn Valve
- 2.3. Other Products (Control Valves)
-
3. Application
- 3.1. Power
-
3.2. Water an
- 3.2.1. Metal, Mineral, and Mining
- 3.2.2. Other Applications
- 3.3. By Chemicals
-
3.4. Oil and Gas
- 3.4.1. Upstream
- 3.4.2. Mid-stream
- 3.4.3. Downstream
- 3.5. Food Processing
- 3.6. Pulp and Paper
-
4. Geography
- 4.1. China
- 4.2. India
- 4.3. Japan
- 4.4. South Korea
- 4.5. Malaysia
- 4.6. Thailand
- 4.7. Indonesia
- 4.8. Vietnam
- 4.9. Rest of Asia-Pacific
APAC Industrial Valves Industry Segmentation By Geography
- 1. China
- 2. India
- 3. Japan
- 4. South Korea
- 5. Malaysia
- 6. Thailand
- 7. Indonesia
- 8. Vietnam
- 9. Rest of Asia Pacific
APAC Industrial Valves Industry Regional Market Share
Geographic Coverage of APAC Industrial Valves Industry
APAC Industrial Valves Industry REPORT HIGHLIGHTS
| Aspects | Details |
|---|---|
| Study Period | 2020-2034 |
| Base Year | 2025 |
| Estimated Year | 2026 |
| Forecast Period | 2026-2034 |
| Historical Period | 2020-2025 |
| Growth Rate | CAGR of 5.67% from 2020-2034 |
| Segmentation |
|
Table of Contents
- 1. Introduction
- 1.1. Research Scope
- 1.2. Market Segmentation
- 1.3. Research Objective
- 1.4. Definitions and Assumptions
- 2. Executive Summary
- 2.1. Market Snapshot
- 3. Market Dynamics
- 3.1. Market Drivers
- 3.2. Market Restrains
- 3.3. Market Trends
- 3.4. Market Opportunities
- 4. Market Factor Analysis
- 4.1. Porters Five Forces
- 4.1.1. Bargaining Power of Suppliers
- 4.1.2. Bargaining Power of Buyers
- 4.1.3. Threat of New Entrants
- 4.1.4. Threat of Substitutes
- 4.1.5. Competitive Rivalry
- 4.2. PESTEL analysis
- 4.3. BCG Analysis
- 4.3.1. Stars (High Growth, High Market Share)
- 4.3.2. Cash Cows (Low Growth, High Market Share)
- 4.3.3. Question Mark (High Growth, Low Market Share)
- 4.3.4. Dogs (Low Growth, Low Market Share)
- 4.4. Ansoff Matrix Analysis
- 4.5. Supply Chain Analysis
- 4.6. Regulatory Landscape
- 4.7. Current Market Potential and Opportunity Assessment (TAM–SAM–SOM Framework)
- 4.8. DMV Analyst Note
- 4.1. Porters Five Forces
- 5. Market Analysis, Insights and Forecast 2021-2033
- 5.1. Market Analysis, Insights and Forecast - by Type
- 5.1.1. Butterfly Valve
- 5.1.2. Ball Valve
- 5.1.3. Globe Valve
- 5.1.4. Gate Valve
- 5.1.5. Plug Valve
- 5.1.6. Other Types
- 5.2. Market Analysis, Insights and Forecast - by Product
- 5.2.1. Quarter-turn Valve
- 5.2.2. Multi-turn Valve
- 5.2.3. Other Products (Control Valves)
- 5.3. Market Analysis, Insights and Forecast - by Application
- 5.3.1. Power
- 5.3.2. Water an
- 5.3.2.1. Metal, Mineral, and Mining
- 5.3.2.2. Other Applications
- 5.3.3. By Chemicals
- 5.3.4. Oil and Gas
- 5.3.4.1. Upstream
- 5.3.4.2. Mid-stream
- 5.3.4.3. Downstream
- 5.3.5. Food Processing
- 5.3.6. Pulp and Paper
- 5.4. Market Analysis, Insights and Forecast - by Geography
- 5.4.1. China
- 5.4.2. India
- 5.4.3. Japan
- 5.4.4. South Korea
- 5.4.5. Malaysia
- 5.4.6. Thailand
- 5.4.7. Indonesia
- 5.4.8. Vietnam
- 5.4.9. Rest of Asia-Pacific
- 5.5. Market Analysis, Insights and Forecast - by Region
- 5.5.1. China
- 5.5.2. India
- 5.5.3. Japan
- 5.5.4. South Korea
- 5.5.5. Malaysia
- 5.5.6. Thailand
- 5.5.7. Indonesia
- 5.5.8. Vietnam
- 5.5.9. Rest of Asia Pacific
- 5.1. Market Analysis, Insights and Forecast - by Type
- 6. Global APAC Industrial Valves Industry Analysis, Insights and Forecast, 2021-2033
- 6.1. Market Analysis, Insights and Forecast - by Type
- 6.1.1. Butterfly Valve
- 6.1.2. Ball Valve
- 6.1.3. Globe Valve
- 6.1.4. Gate Valve
- 6.1.5. Plug Valve
- 6.1.6. Other Types
- 6.2. Market Analysis, Insights and Forecast - by Product
- 6.2.1. Quarter-turn Valve
- 6.2.2. Multi-turn Valve
- 6.2.3. Other Products (Control Valves)
- 6.3. Market Analysis, Insights and Forecast - by Application
- 6.3.1. Power
- 6.3.2. Water an
- 6.3.2.1. Metal, Mineral, and Mining
- 6.3.2.2. Other Applications
- 6.3.3. By Chemicals
- 6.3.4. Oil and Gas
- 6.3.4.1. Upstream
- 6.3.4.2. Mid-stream
- 6.3.4.3. Downstream
- 6.3.5. Food Processing
- 6.3.6. Pulp and Paper
- 6.4. Market Analysis, Insights and Forecast - by Geography
- 6.4.1. China
- 6.4.2. India
- 6.4.3. Japan
- 6.4.4. South Korea
- 6.4.5. Malaysia
- 6.4.6. Thailand
- 6.4.7. Indonesia
- 6.4.8. Vietnam
- 6.4.9. Rest of Asia-Pacific
- 6.1. Market Analysis, Insights and Forecast - by Type
- 7. China APAC Industrial Valves Industry Analysis, Insights and Forecast, 2020-2032
- 7.1. Market Analysis, Insights and Forecast - by Type
- 7.1.1. Butterfly Valve
- 7.1.2. Ball Valve
- 7.1.3. Globe Valve
- 7.1.4. Gate Valve
- 7.1.5. Plug Valve
- 7.1.6. Other Types
- 7.2. Market Analysis, Insights and Forecast - by Product
- 7.2.1. Quarter-turn Valve
- 7.2.2. Multi-turn Valve
- 7.2.3. Other Products (Control Valves)
- 7.3. Market Analysis, Insights and Forecast - by Application
- 7.3.1. Power
- 7.3.2. Water an
- 7.3.2.1. Metal, Mineral, and Mining
- 7.3.2.2. Other Applications
- 7.3.3. By Chemicals
- 7.3.4. Oil and Gas
- 7.3.4.1. Upstream
- 7.3.4.2. Mid-stream
- 7.3.4.3. Downstream
- 7.3.5. Food Processing
- 7.3.6. Pulp and Paper
- 7.4. Market Analysis, Insights and Forecast - by Geography
- 7.4.1. China
- 7.4.2. India
- 7.4.3. Japan
- 7.4.4. South Korea
- 7.4.5. Malaysia
- 7.4.6. Thailand
- 7.4.7. Indonesia
- 7.4.8. Vietnam
- 7.4.9. Rest of Asia-Pacific
- 7.1. Market Analysis, Insights and Forecast - by Type
- 8. India APAC Industrial Valves Industry Analysis, Insights and Forecast, 2020-2032
- 8.1. Market Analysis, Insights and Forecast - by Type
- 8.1.1. Butterfly Valve
- 8.1.2. Ball Valve
- 8.1.3. Globe Valve
- 8.1.4. Gate Valve
- 8.1.5. Plug Valve
- 8.1.6. Other Types
- 8.2. Market Analysis, Insights and Forecast - by Product
- 8.2.1. Quarter-turn Valve
- 8.2.2. Multi-turn Valve
- 8.2.3. Other Products (Control Valves)
- 8.3. Market Analysis, Insights and Forecast - by Application
- 8.3.1. Power
- 8.3.2. Water an
- 8.3.2.1. Metal, Mineral, and Mining
- 8.3.2.2. Other Applications
- 8.3.3. By Chemicals
- 8.3.4. Oil and Gas
- 8.3.4.1. Upstream
- 8.3.4.2. Mid-stream
- 8.3.4.3. Downstream
- 8.3.5. Food Processing
- 8.3.6. Pulp and Paper
- 8.4. Market Analysis, Insights and Forecast - by Geography
- 8.4.1. China
- 8.4.2. India
- 8.4.3. Japan
- 8.4.4. South Korea
- 8.4.5. Malaysia
- 8.4.6. Thailand
- 8.4.7. Indonesia
- 8.4.8. Vietnam
- 8.4.9. Rest of Asia-Pacific
- 8.1. Market Analysis, Insights and Forecast - by Type
- 9. Japan APAC Industrial Valves Industry Analysis, Insights and Forecast, 2020-2032
- 9.1. Market Analysis, Insights and Forecast - by Type
- 9.1.1. Butterfly Valve
- 9.1.2. Ball Valve
- 9.1.3. Globe Valve
- 9.1.4. Gate Valve
- 9.1.5. Plug Valve
- 9.1.6. Other Types
- 9.2. Market Analysis, Insights and Forecast - by Product
- 9.2.1. Quarter-turn Valve
- 9.2.2. Multi-turn Valve
- 9.2.3. Other Products (Control Valves)
- 9.3. Market Analysis, Insights and Forecast - by Application
- 9.3.1. Power
- 9.3.2. Water an
- 9.3.2.1. Metal, Mineral, and Mining
- 9.3.2.2. Other Applications
- 9.3.3. By Chemicals
- 9.3.4. Oil and Gas
- 9.3.4.1. Upstream
- 9.3.4.2. Mid-stream
- 9.3.4.3. Downstream
- 9.3.5. Food Processing
- 9.3.6. Pulp and Paper
- 9.4. Market Analysis, Insights and Forecast - by Geography
- 9.4.1. China
- 9.4.2. India
- 9.4.3. Japan
- 9.4.4. South Korea
- 9.4.5. Malaysia
- 9.4.6. Thailand
- 9.4.7. Indonesia
- 9.4.8. Vietnam
- 9.4.9. Rest of Asia-Pacific
- 9.1. Market Analysis, Insights and Forecast - by Type
- 10. South Korea APAC Industrial Valves Industry Analysis, Insights and Forecast, 2020-2032
- 10.1. Market Analysis, Insights and Forecast - by Type
- 10.1.1. Butterfly Valve
- 10.1.2. Ball Valve
- 10.1.3. Globe Valve
- 10.1.4. Gate Valve
- 10.1.5. Plug Valve
- 10.1.6. Other Types
- 10.2. Market Analysis, Insights and Forecast - by Product
- 10.2.1. Quarter-turn Valve
- 10.2.2. Multi-turn Valve
- 10.2.3. Other Products (Control Valves)
- 10.3. Market Analysis, Insights and Forecast - by Application
- 10.3.1. Power
- 10.3.2. Water an
- 10.3.2.1. Metal, Mineral, and Mining
- 10.3.2.2. Other Applications
- 10.3.3. By Chemicals
- 10.3.4. Oil and Gas
- 10.3.4.1. Upstream
- 10.3.4.2. Mid-stream
- 10.3.4.3. Downstream
- 10.3.5. Food Processing
- 10.3.6. Pulp and Paper
- 10.4. Market Analysis, Insights and Forecast - by Geography
- 10.4.1. China
- 10.4.2. India
- 10.4.3. Japan
- 10.4.4. South Korea
- 10.4.5. Malaysia
- 10.4.6. Thailand
- 10.4.7. Indonesia
- 10.4.8. Vietnam
- 10.4.9. Rest of Asia-Pacific
- 10.1. Market Analysis, Insights and Forecast - by Type
- 11. Malaysia APAC Industrial Valves Industry Analysis, Insights and Forecast, 2020-2032
- 11.1. Market Analysis, Insights and Forecast - by Type
- 11.1.1. Butterfly Valve
- 11.1.2. Ball Valve
- 11.1.3. Globe Valve
- 11.1.4. Gate Valve
- 11.1.5. Plug Valve
- 11.1.6. Other Types
- 11.2. Market Analysis, Insights and Forecast - by Product
- 11.2.1. Quarter-turn Valve
- 11.2.2. Multi-turn Valve
- 11.2.3. Other Products (Control Valves)
- 11.3. Market Analysis, Insights and Forecast - by Application
- 11.3.1. Power
- 11.3.2. Water an
- 11.3.2.1. Metal, Mineral, and Mining
- 11.3.2.2. Other Applications
- 11.3.3. By Chemicals
- 11.3.4. Oil and Gas
- 11.3.4.1. Upstream
- 11.3.4.2. Mid-stream
- 11.3.4.3. Downstream
- 11.3.5. Food Processing
- 11.3.6. Pulp and Paper
- 11.4. Market Analysis, Insights and Forecast - by Geography
- 11.4.1. China
- 11.4.2. India
- 11.4.3. Japan
- 11.4.4. South Korea
- 11.4.5. Malaysia
- 11.4.6. Thailand
- 11.4.7. Indonesia
- 11.4.8. Vietnam
- 11.4.9. Rest of Asia-Pacific
- 11.1. Market Analysis, Insights and Forecast - by Type
- 12. Thailand APAC Industrial Valves Industry Analysis, Insights and Forecast, 2020-2032
- 12.1. Market Analysis, Insights and Forecast - by Type
- 12.1.1. Butterfly Valve
- 12.1.2. Ball Valve
- 12.1.3. Globe Valve
- 12.1.4. Gate Valve
- 12.1.5. Plug Valve
- 12.1.6. Other Types
- 12.2. Market Analysis, Insights and Forecast - by Product
- 12.2.1. Quarter-turn Valve
- 12.2.2. Multi-turn Valve
- 12.2.3. Other Products (Control Valves)
- 12.3. Market Analysis, Insights and Forecast - by Application
- 12.3.1. Power
- 12.3.2. Water an
- 12.3.2.1. Metal, Mineral, and Mining
- 12.3.2.2. Other Applications
- 12.3.3. By Chemicals
- 12.3.4. Oil and Gas
- 12.3.4.1. Upstream
- 12.3.4.2. Mid-stream
- 12.3.4.3. Downstream
- 12.3.5. Food Processing
- 12.3.6. Pulp and Paper
- 12.4. Market Analysis, Insights and Forecast - by Geography
- 12.4.1. China
- 12.4.2. India
- 12.4.3. Japan
- 12.4.4. South Korea
- 12.4.5. Malaysia
- 12.4.6. Thailand
- 12.4.7. Indonesia
- 12.4.8. Vietnam
- 12.4.9. Rest of Asia-Pacific
- 12.1. Market Analysis, Insights and Forecast - by Type
- 13. Indonesia APAC Industrial Valves Industry Analysis, Insights and Forecast, 2020-2032
- 13.1. Market Analysis, Insights and Forecast - by Type
- 13.1.1. Butterfly Valve
- 13.1.2. Ball Valve
- 13.1.3. Globe Valve
- 13.1.4. Gate Valve
- 13.1.5. Plug Valve
- 13.1.6. Other Types
- 13.2. Market Analysis, Insights and Forecast - by Product
- 13.2.1. Quarter-turn Valve
- 13.2.2. Multi-turn Valve
- 13.2.3. Other Products (Control Valves)
- 13.3. Market Analysis, Insights and Forecast - by Application
- 13.3.1. Power
- 13.3.2. Water an
- 13.3.2.1. Metal, Mineral, and Mining
- 13.3.2.2. Other Applications
- 13.3.3. By Chemicals
- 13.3.4. Oil and Gas
- 13.3.4.1. Upstream
- 13.3.4.2. Mid-stream
- 13.3.4.3. Downstream
- 13.3.5. Food Processing
- 13.3.6. Pulp and Paper
- 13.4. Market Analysis, Insights and Forecast - by Geography
- 13.4.1. China
- 13.4.2. India
- 13.4.3. Japan
- 13.4.4. South Korea
- 13.4.5. Malaysia
- 13.4.6. Thailand
- 13.4.7. Indonesia
- 13.4.8. Vietnam
- 13.4.9. Rest of Asia-Pacific
- 13.1. Market Analysis, Insights and Forecast - by Type
- 14. Vietnam APAC Industrial Valves Industry Analysis, Insights and Forecast, 2020-2032
- 14.1. Market Analysis, Insights and Forecast - by Type
- 14.1.1. Butterfly Valve
- 14.1.2. Ball Valve
- 14.1.3. Globe Valve
- 14.1.4. Gate Valve
- 14.1.5. Plug Valve
- 14.1.6. Other Types
- 14.2. Market Analysis, Insights and Forecast - by Product
- 14.2.1. Quarter-turn Valve
- 14.2.2. Multi-turn Valve
- 14.2.3. Other Products (Control Valves)
- 14.3. Market Analysis, Insights and Forecast - by Application
- 14.3.1. Power
- 14.3.2. Water an
- 14.3.2.1. Metal, Mineral, and Mining
- 14.3.2.2. Other Applications
- 14.3.3. By Chemicals
- 14.3.4. Oil and Gas
- 14.3.4.1. Upstream
- 14.3.4.2. Mid-stream
- 14.3.4.3. Downstream
- 14.3.5. Food Processing
- 14.3.6. Pulp and Paper
- 14.4. Market Analysis, Insights and Forecast - by Geography
- 14.4.1. China
- 14.4.2. India
- 14.4.3. Japan
- 14.4.4. South Korea
- 14.4.5. Malaysia
- 14.4.6. Thailand
- 14.4.7. Indonesia
- 14.4.8. Vietnam
- 14.4.9. Rest of Asia-Pacific
- 14.1. Market Analysis, Insights and Forecast - by Type
- 15. Rest of Asia Pacific APAC Industrial Valves Industry Analysis, Insights and Forecast, 2020-2032
- 15.1. Market Analysis, Insights and Forecast - by Type
- 15.1.1. Butterfly Valve
- 15.1.2. Ball Valve
- 15.1.3. Globe Valve
- 15.1.4. Gate Valve
- 15.1.5. Plug Valve
- 15.1.6. Other Types
- 15.2. Market Analysis, Insights and Forecast - by Product
- 15.2.1. Quarter-turn Valve
- 15.2.2. Multi-turn Valve
- 15.2.3. Other Products (Control Valves)
- 15.3. Market Analysis, Insights and Forecast - by Application
- 15.3.1. Power
- 15.3.2. Water an
- 15.3.2.1. Metal, Mineral, and Mining
- 15.3.2.2. Other Applications
- 15.3.3. By Chemicals
- 15.3.4. Oil and Gas
- 15.3.4.1. Upstream
- 15.3.4.2. Mid-stream
- 15.3.4.3. Downstream
- 15.3.5. Food Processing
- 15.3.6. Pulp and Paper
- 15.4. Market Analysis, Insights and Forecast - by Geography
- 15.4.1. China
- 15.4.2. India
- 15.4.3. Japan
- 15.4.4. South Korea
- 15.4.5. Malaysia
- 15.4.6. Thailand
- 15.4.7. Indonesia
- 15.4.8. Vietnam
- 15.4.9. Rest of Asia-Pacific
- 15.1. Market Analysis, Insights and Forecast - by Type
- 16. Competitive Analysis
- 16.1. Company Profiles
- 16.1.1 Alfa Laval
- 16.1.1.1. Company Overview
- 16.1.1.2. Products
- 16.1.1.3. Company Financials
- 16.1.1.4. SWOT Analysis
- 16.1.2 Honeywell International Inc
- 16.1.2.1. Company Overview
- 16.1.2.2. Products
- 16.1.2.3. Company Financials
- 16.1.2.4. SWOT Analysis
- 16.1.3 Danfoss AS
- 16.1.3.1. Company Overview
- 16.1.3.2. Products
- 16.1.3.3. Company Financials
- 16.1.3.4. SWOT Analysis
- 16.1.4 Velan Inc
- 16.1.4.1. Company Overview
- 16.1.4.2. Products
- 16.1.4.3. Company Financials
- 16.1.4.4. SWOT Analysis
- 16.1.5 Okano Valve Mfg Co Ltd
- 16.1.5.1. Company Overview
- 16.1.5.2. Products
- 16.1.5.3. Company Financials
- 16.1.5.4. SWOT Analysis
- 16.1.6 SAMSON AKTIENGESELLSCHAFT
- 16.1.6.1. Company Overview
- 16.1.6.2. Products
- 16.1.6.3. Company Financials
- 16.1.6.4. SWOT Analysis
- 16.1.7 Flowserve Corporation
- 16.1.7.1. Company Overview
- 16.1.7.2. Products
- 16.1.7.3. Company Financials
- 16.1.7.4. SWOT Analysis
- 16.1.8 The Weir Group PLC
- 16.1.8.1. Company Overview
- 16.1.8.2. Products
- 16.1.8.3. Company Financials
- 16.1.8.4. SWOT Analysis
- 16.1.9 Georg Fischer Ltd
- 16.1.9.1. Company Overview
- 16.1.9.2. Products
- 16.1.9.3. Company Financials
- 16.1.9.4. SWOT Analysis
- 16.1.10 Baker Hughes
- 16.1.10.1. Company Overview
- 16.1.10.2. Products
- 16.1.10.3. Company Financials
- 16.1.10.4. SWOT Analysis
- 16.1.11 Emerson Electric Co
- 16.1.11.1. Company Overview
- 16.1.11.2. Products
- 16.1.11.3. Company Financials
- 16.1.11.4. SWOT Analysis
- 16.1.12 CIRCOR International Inc
- 16.1.12.1. Company Overview
- 16.1.12.2. Products
- 16.1.12.3. Company Financials
- 16.1.12.4. SWOT Analysis
- 16.1.13 AVK Holding AS
- 16.1.13.1. Company Overview
- 16.1.13.2. Products
- 16.1.13.3. Company Financials
- 16.1.13.4. SWOT Analysis
- 16.1.14 PARKER HANNIFIN CORP
- 16.1.14.1. Company Overview
- 16.1.14.2. Products
- 16.1.14.3. Company Financials
- 16.1.14.4. SWOT Analysis
- 16.1.15 EBRO ARMATUREN Gebr Brer GmbH
- 16.1.15.1. Company Overview
- 16.1.15.2. Products
- 16.1.15.3. Company Financials
- 16.1.15.4. SWOT Analysis
- 16.1.16 Hitachi Metals Ltd
- 16.1.16.1. Company Overview
- 16.1.16.2. Products
- 16.1.16.3. Company Financials
- 16.1.16.4. SWOT Analysis
- 16.1.17 ITT Inc
- 16.1.17.1. Company Overview
- 16.1.17.2. Products
- 16.1.17.3. Company Financials
- 16.1.17.4. SWOT Analysis
- 16.1.18 NIBCO
- 16.1.18.1. Company Overview
- 16.1.18.2. Products
- 16.1.18.3. Company Financials
- 16.1.18.4. SWOT Analysis
- 16.1.19 IMI Critical Engineering
- 16.1.19.1. Company Overview
- 16.1.19.2. Products
- 16.1.19.3. Company Financials
- 16.1.19.4. SWOT Analysis
- 16.1.20 Crane Co
- 16.1.20.1. Company Overview
- 16.1.20.2. Products
- 16.1.20.3. Company Financials
- 16.1.20.4. SWOT Analysis
- 16.1.21 Valvitalia SpA
- 16.1.21.1. Company Overview
- 16.1.21.2. Products
- 16.1.21.3. Company Financials
- 16.1.21.4. SWOT Analysis
- 16.1.22 Curtiss-Wright Corporation
- 16.1.22.1. Company Overview
- 16.1.22.2. Products
- 16.1.22.3. Company Financials
- 16.1.22.4. SWOT Analysis
- 16.1.23 Schlumberger Limited
- 16.1.23.1. Company Overview
- 16.1.23.2. Products
- 16.1.23.3. Company Financials
- 16.1.23.4. SWOT Analysis
- 16.1.24 KITZ Corporation
- 16.1.24.1. Company Overview
- 16.1.24.2. Products
- 16.1.24.3. Company Financials
- 16.1.24.4. SWOT Analysis
- 16.1.1 Alfa Laval
- 16.2. Market Entropy
- 16.2.1 Company's Key Areas Served
- 16.2.2 Recent Developments
- 16.3. Company Market Share Analysis 2025
- 16.3.1 Top 5 Companies Market Share Analysis
- 16.3.2 Top 3 Companies Market Share Analysis
- 16.4. List of Potential Customers
- 17. Research Methodology
List of Figures
- Figure 1: Global APAC Industrial Valves Industry Revenue Breakdown (Million, %) by Region 2025 & 2033
- Figure 2: Global APAC Industrial Valves Industry Volume Breakdown (K Units, %) by Region 2025 & 2033
- Figure 3: China APAC Industrial Valves Industry Revenue (Million), by Type 2025 & 2033
- Figure 4: China APAC Industrial Valves Industry Volume (K Units), by Type 2025 & 2033
- Figure 5: China APAC Industrial Valves Industry Revenue Share (%), by Type 2025 & 2033
- Figure 6: China APAC Industrial Valves Industry Volume Share (%), by Type 2025 & 2033
- Figure 7: China APAC Industrial Valves Industry Revenue (Million), by Product 2025 & 2033
- Figure 8: China APAC Industrial Valves Industry Volume (K Units), by Product 2025 & 2033
- Figure 9: China APAC Industrial Valves Industry Revenue Share (%), by Product 2025 & 2033
- Figure 10: China APAC Industrial Valves Industry Volume Share (%), by Product 2025 & 2033
- Figure 11: China APAC Industrial Valves Industry Revenue (Million), by Application 2025 & 2033
- Figure 12: China APAC Industrial Valves Industry Volume (K Units), by Application 2025 & 2033
- Figure 13: China APAC Industrial Valves Industry Revenue Share (%), by Application 2025 & 2033
- Figure 14: China APAC Industrial Valves Industry Volume Share (%), by Application 2025 & 2033
- Figure 15: China APAC Industrial Valves Industry Revenue (Million), by Geography 2025 & 2033
- Figure 16: China APAC Industrial Valves Industry Volume (K Units), by Geography 2025 & 2033
- Figure 17: China APAC Industrial Valves Industry Revenue Share (%), by Geography 2025 & 2033
- Figure 18: China APAC Industrial Valves Industry Volume Share (%), by Geography 2025 & 2033
- Figure 19: China APAC Industrial Valves Industry Revenue (Million), by Country 2025 & 2033
- Figure 20: China APAC Industrial Valves Industry Volume (K Units), by Country 2025 & 2033
- Figure 21: China APAC Industrial Valves Industry Revenue Share (%), by Country 2025 & 2033
- Figure 22: China APAC Industrial Valves Industry Volume Share (%), by Country 2025 & 2033
- Figure 23: India APAC Industrial Valves Industry Revenue (Million), by Type 2025 & 2033
- Figure 24: India APAC Industrial Valves Industry Volume (K Units), by Type 2025 & 2033
- Figure 25: India APAC Industrial Valves Industry Revenue Share (%), by Type 2025 & 2033
- Figure 26: India APAC Industrial Valves Industry Volume Share (%), by Type 2025 & 2033
- Figure 27: India APAC Industrial Valves Industry Revenue (Million), by Product 2025 & 2033
- Figure 28: India APAC Industrial Valves Industry Volume (K Units), by Product 2025 & 2033
- Figure 29: India APAC Industrial Valves Industry Revenue Share (%), by Product 2025 & 2033
- Figure 30: India APAC Industrial Valves Industry Volume Share (%), by Product 2025 & 2033
- Figure 31: India APAC Industrial Valves Industry Revenue (Million), by Application 2025 & 2033
- Figure 32: India APAC Industrial Valves Industry Volume (K Units), by Application 2025 & 2033
- Figure 33: India APAC Industrial Valves Industry Revenue Share (%), by Application 2025 & 2033
- Figure 34: India APAC Industrial Valves Industry Volume Share (%), by Application 2025 & 2033
- Figure 35: India APAC Industrial Valves Industry Revenue (Million), by Geography 2025 & 2033
- Figure 36: India APAC Industrial Valves Industry Volume (K Units), by Geography 2025 & 2033
- Figure 37: India APAC Industrial Valves Industry Revenue Share (%), by Geography 2025 & 2033
- Figure 38: India APAC Industrial Valves Industry Volume Share (%), by Geography 2025 & 2033
- Figure 39: India APAC Industrial Valves Industry Revenue (Million), by Country 2025 & 2033
- Figure 40: India APAC Industrial Valves Industry Volume (K Units), by Country 2025 & 2033
- Figure 41: India APAC Industrial Valves Industry Revenue Share (%), by Country 2025 & 2033
- Figure 42: India APAC Industrial Valves Industry Volume Share (%), by Country 2025 & 2033
- Figure 43: Japan APAC Industrial Valves Industry Revenue (Million), by Type 2025 & 2033
- Figure 44: Japan APAC Industrial Valves Industry Volume (K Units), by Type 2025 & 2033
- Figure 45: Japan APAC Industrial Valves Industry Revenue Share (%), by Type 2025 & 2033
- Figure 46: Japan APAC Industrial Valves Industry Volume Share (%), by Type 2025 & 2033
- Figure 47: Japan APAC Industrial Valves Industry Revenue (Million), by Product 2025 & 2033
- Figure 48: Japan APAC Industrial Valves Industry Volume (K Units), by Product 2025 & 2033
- Figure 49: Japan APAC Industrial Valves Industry Revenue Share (%), by Product 2025 & 2033
- Figure 50: Japan APAC Industrial Valves Industry Volume Share (%), by Product 2025 & 2033
- Figure 51: Japan APAC Industrial Valves Industry Revenue (Million), by Application 2025 & 2033
- Figure 52: Japan APAC Industrial Valves Industry Volume (K Units), by Application 2025 & 2033
- Figure 53: Japan APAC Industrial Valves Industry Revenue Share (%), by Application 2025 & 2033
- Figure 54: Japan APAC Industrial Valves Industry Volume Share (%), by Application 2025 & 2033
- Figure 55: Japan APAC Industrial Valves Industry Revenue (Million), by Geography 2025 & 2033
- Figure 56: Japan APAC Industrial Valves Industry Volume (K Units), by Geography 2025 & 2033
- Figure 57: Japan APAC Industrial Valves Industry Revenue Share (%), by Geography 2025 & 2033
- Figure 58: Japan APAC Industrial Valves Industry Volume Share (%), by Geography 2025 & 2033
- Figure 59: Japan APAC Industrial Valves Industry Revenue (Million), by Country 2025 & 2033
- Figure 60: Japan APAC Industrial Valves Industry Volume (K Units), by Country 2025 & 2033
- Figure 61: Japan APAC Industrial Valves Industry Revenue Share (%), by Country 2025 & 2033
- Figure 62: Japan APAC Industrial Valves Industry Volume Share (%), by Country 2025 & 2033
- Figure 63: South Korea APAC Industrial Valves Industry Revenue (Million), by Type 2025 & 2033
- Figure 64: South Korea APAC Industrial Valves Industry Volume (K Units), by Type 2025 & 2033
- Figure 65: South Korea APAC Industrial Valves Industry Revenue Share (%), by Type 2025 & 2033
- Figure 66: South Korea APAC Industrial Valves Industry Volume Share (%), by Type 2025 & 2033
- Figure 67: South Korea APAC Industrial Valves Industry Revenue (Million), by Product 2025 & 2033
- Figure 68: South Korea APAC Industrial Valves Industry Volume (K Units), by Product 2025 & 2033
- Figure 69: South Korea APAC Industrial Valves Industry Revenue Share (%), by Product 2025 & 2033
- Figure 70: South Korea APAC Industrial Valves Industry Volume Share (%), by Product 2025 & 2033
- Figure 71: South Korea APAC Industrial Valves Industry Revenue (Million), by Application 2025 & 2033
- Figure 72: South Korea APAC Industrial Valves Industry Volume (K Units), by Application 2025 & 2033
- Figure 73: South Korea APAC Industrial Valves Industry Revenue Share (%), by Application 2025 & 2033
- Figure 74: South Korea APAC Industrial Valves Industry Volume Share (%), by Application 2025 & 2033
- Figure 75: South Korea APAC Industrial Valves Industry Revenue (Million), by Geography 2025 & 2033
- Figure 76: South Korea APAC Industrial Valves Industry Volume (K Units), by Geography 2025 & 2033
- Figure 77: South Korea APAC Industrial Valves Industry Revenue Share (%), by Geography 2025 & 2033
- Figure 78: South Korea APAC Industrial Valves Industry Volume Share (%), by Geography 2025 & 2033
- Figure 79: South Korea APAC Industrial Valves Industry Revenue (Million), by Country 2025 & 2033
- Figure 80: South Korea APAC Industrial Valves Industry Volume (K Units), by Country 2025 & 2033
- Figure 81: South Korea APAC Industrial Valves Industry Revenue Share (%), by Country 2025 & 2033
- Figure 82: South Korea APAC Industrial Valves Industry Volume Share (%), by Country 2025 & 2033
- Figure 83: Malaysia APAC Industrial Valves Industry Revenue (Million), by Type 2025 & 2033
- Figure 84: Malaysia APAC Industrial Valves Industry Volume (K Units), by Type 2025 & 2033
- Figure 85: Malaysia APAC Industrial Valves Industry Revenue Share (%), by Type 2025 & 2033
- Figure 86: Malaysia APAC Industrial Valves Industry Volume Share (%), by Type 2025 & 2033
- Figure 87: Malaysia APAC Industrial Valves Industry Revenue (Million), by Product 2025 & 2033
- Figure 88: Malaysia APAC Industrial Valves Industry Volume (K Units), by Product 2025 & 2033
- Figure 89: Malaysia APAC Industrial Valves Industry Revenue Share (%), by Product 2025 & 2033
- Figure 90: Malaysia APAC Industrial Valves Industry Volume Share (%), by Product 2025 & 2033
- Figure 91: Malaysia APAC Industrial Valves Industry Revenue (Million), by Application 2025 & 2033
- Figure 92: Malaysia APAC Industrial Valves Industry Volume (K Units), by Application 2025 & 2033
- Figure 93: Malaysia APAC Industrial Valves Industry Revenue Share (%), by Application 2025 & 2033
- Figure 94: Malaysia APAC Industrial Valves Industry Volume Share (%), by Application 2025 & 2033
- Figure 95: Malaysia APAC Industrial Valves Industry Revenue (Million), by Geography 2025 & 2033
- Figure 96: Malaysia APAC Industrial Valves Industry Volume (K Units), by Geography 2025 & 2033
- Figure 97: Malaysia APAC Industrial Valves Industry Revenue Share (%), by Geography 2025 & 2033
- Figure 98: Malaysia APAC Industrial Valves Industry Volume Share (%), by Geography 2025 & 2033
- Figure 99: Malaysia APAC Industrial Valves Industry Revenue (Million), by Country 2025 & 2033
- Figure 100: Malaysia APAC Industrial Valves Industry Volume (K Units), by Country 2025 & 2033
- Figure 101: Malaysia APAC Industrial Valves Industry Revenue Share (%), by Country 2025 & 2033
- Figure 102: Malaysia APAC Industrial Valves Industry Volume Share (%), by Country 2025 & 2033
- Figure 103: Thailand APAC Industrial Valves Industry Revenue (Million), by Type 2025 & 2033
- Figure 104: Thailand APAC Industrial Valves Industry Volume (K Units), by Type 2025 & 2033
- Figure 105: Thailand APAC Industrial Valves Industry Revenue Share (%), by Type 2025 & 2033
- Figure 106: Thailand APAC Industrial Valves Industry Volume Share (%), by Type 2025 & 2033
- Figure 107: Thailand APAC Industrial Valves Industry Revenue (Million), by Product 2025 & 2033
- Figure 108: Thailand APAC Industrial Valves Industry Volume (K Units), by Product 2025 & 2033
- Figure 109: Thailand APAC Industrial Valves Industry Revenue Share (%), by Product 2025 & 2033
- Figure 110: Thailand APAC Industrial Valves Industry Volume Share (%), by Product 2025 & 2033
- Figure 111: Thailand APAC Industrial Valves Industry Revenue (Million), by Application 2025 & 2033
- Figure 112: Thailand APAC Industrial Valves Industry Volume (K Units), by Application 2025 & 2033
- Figure 113: Thailand APAC Industrial Valves Industry Revenue Share (%), by Application 2025 & 2033
- Figure 114: Thailand APAC Industrial Valves Industry Volume Share (%), by Application 2025 & 2033
- Figure 115: Thailand APAC Industrial Valves Industry Revenue (Million), by Geography 2025 & 2033
- Figure 116: Thailand APAC Industrial Valves Industry Volume (K Units), by Geography 2025 & 2033
- Figure 117: Thailand APAC Industrial Valves Industry Revenue Share (%), by Geography 2025 & 2033
- Figure 118: Thailand APAC Industrial Valves Industry Volume Share (%), by Geography 2025 & 2033
- Figure 119: Thailand APAC Industrial Valves Industry Revenue (Million), by Country 2025 & 2033
- Figure 120: Thailand APAC Industrial Valves Industry Volume (K Units), by Country 2025 & 2033
- Figure 121: Thailand APAC Industrial Valves Industry Revenue Share (%), by Country 2025 & 2033
- Figure 122: Thailand APAC Industrial Valves Industry Volume Share (%), by Country 2025 & 2033
- Figure 123: Indonesia APAC Industrial Valves Industry Revenue (Million), by Type 2025 & 2033
- Figure 124: Indonesia APAC Industrial Valves Industry Volume (K Units), by Type 2025 & 2033
- Figure 125: Indonesia APAC Industrial Valves Industry Revenue Share (%), by Type 2025 & 2033
- Figure 126: Indonesia APAC Industrial Valves Industry Volume Share (%), by Type 2025 & 2033
- Figure 127: Indonesia APAC Industrial Valves Industry Revenue (Million), by Product 2025 & 2033
- Figure 128: Indonesia APAC Industrial Valves Industry Volume (K Units), by Product 2025 & 2033
- Figure 129: Indonesia APAC Industrial Valves Industry Revenue Share (%), by Product 2025 & 2033
- Figure 130: Indonesia APAC Industrial Valves Industry Volume Share (%), by Product 2025 & 2033
- Figure 131: Indonesia APAC Industrial Valves Industry Revenue (Million), by Application 2025 & 2033
- Figure 132: Indonesia APAC Industrial Valves Industry Volume (K Units), by Application 2025 & 2033
- Figure 133: Indonesia APAC Industrial Valves Industry Revenue Share (%), by Application 2025 & 2033
- Figure 134: Indonesia APAC Industrial Valves Industry Volume Share (%), by Application 2025 & 2033
- Figure 135: Indonesia APAC Industrial Valves Industry Revenue (Million), by Geography 2025 & 2033
- Figure 136: Indonesia APAC Industrial Valves Industry Volume (K Units), by Geography 2025 & 2033
- Figure 137: Indonesia APAC Industrial Valves Industry Revenue Share (%), by Geography 2025 & 2033
- Figure 138: Indonesia APAC Industrial Valves Industry Volume Share (%), by Geography 2025 & 2033
- Figure 139: Indonesia APAC Industrial Valves Industry Revenue (Million), by Country 2025 & 2033
- Figure 140: Indonesia APAC Industrial Valves Industry Volume (K Units), by Country 2025 & 2033
- Figure 141: Indonesia APAC Industrial Valves Industry Revenue Share (%), by Country 2025 & 2033
- Figure 142: Indonesia APAC Industrial Valves Industry Volume Share (%), by Country 2025 & 2033
- Figure 143: Vietnam APAC Industrial Valves Industry Revenue (Million), by Type 2025 & 2033
- Figure 144: Vietnam APAC Industrial Valves Industry Volume (K Units), by Type 2025 & 2033
- Figure 145: Vietnam APAC Industrial Valves Industry Revenue Share (%), by Type 2025 & 2033
- Figure 146: Vietnam APAC Industrial Valves Industry Volume Share (%), by Type 2025 & 2033
- Figure 147: Vietnam APAC Industrial Valves Industry Revenue (Million), by Product 2025 & 2033
- Figure 148: Vietnam APAC Industrial Valves Industry Volume (K Units), by Product 2025 & 2033
- Figure 149: Vietnam APAC Industrial Valves Industry Revenue Share (%), by Product 2025 & 2033
- Figure 150: Vietnam APAC Industrial Valves Industry Volume Share (%), by Product 2025 & 2033
- Figure 151: Vietnam APAC Industrial Valves Industry Revenue (Million), by Application 2025 & 2033
- Figure 152: Vietnam APAC Industrial Valves Industry Volume (K Units), by Application 2025 & 2033
- Figure 153: Vietnam APAC Industrial Valves Industry Revenue Share (%), by Application 2025 & 2033
- Figure 154: Vietnam APAC Industrial Valves Industry Volume Share (%), by Application 2025 & 2033
- Figure 155: Vietnam APAC Industrial Valves Industry Revenue (Million), by Geography 2025 & 2033
- Figure 156: Vietnam APAC Industrial Valves Industry Volume (K Units), by Geography 2025 & 2033
- Figure 157: Vietnam APAC Industrial Valves Industry Revenue Share (%), by Geography 2025 & 2033
- Figure 158: Vietnam APAC Industrial Valves Industry Volume Share (%), by Geography 2025 & 2033
- Figure 159: Vietnam APAC Industrial Valves Industry Revenue (Million), by Country 2025 & 2033
- Figure 160: Vietnam APAC Industrial Valves Industry Volume (K Units), by Country 2025 & 2033
- Figure 161: Vietnam APAC Industrial Valves Industry Revenue Share (%), by Country 2025 & 2033
- Figure 162: Vietnam APAC Industrial Valves Industry Volume Share (%), by Country 2025 & 2033
- Figure 163: Rest of Asia Pacific APAC Industrial Valves Industry Revenue (Million), by Type 2025 & 2033
- Figure 164: Rest of Asia Pacific APAC Industrial Valves Industry Volume (K Units), by Type 2025 & 2033
- Figure 165: Rest of Asia Pacific APAC Industrial Valves Industry Revenue Share (%), by Type 2025 & 2033
- Figure 166: Rest of Asia Pacific APAC Industrial Valves Industry Volume Share (%), by Type 2025 & 2033
- Figure 167: Rest of Asia Pacific APAC Industrial Valves Industry Revenue (Million), by Product 2025 & 2033
- Figure 168: Rest of Asia Pacific APAC Industrial Valves Industry Volume (K Units), by Product 2025 & 2033
- Figure 169: Rest of Asia Pacific APAC Industrial Valves Industry Revenue Share (%), by Product 2025 & 2033
- Figure 170: Rest of Asia Pacific APAC Industrial Valves Industry Volume Share (%), by Product 2025 & 2033
- Figure 171: Rest of Asia Pacific APAC Industrial Valves Industry Revenue (Million), by Application 2025 & 2033
- Figure 172: Rest of Asia Pacific APAC Industrial Valves Industry Volume (K Units), by Application 2025 & 2033
- Figure 173: Rest of Asia Pacific APAC Industrial Valves Industry Revenue Share (%), by Application 2025 & 2033
- Figure 174: Rest of Asia Pacific APAC Industrial Valves Industry Volume Share (%), by Application 2025 & 2033
- Figure 175: Rest of Asia Pacific APAC Industrial Valves Industry Revenue (Million), by Geography 2025 & 2033
- Figure 176: Rest of Asia Pacific APAC Industrial Valves Industry Volume (K Units), by Geography 2025 & 2033
- Figure 177: Rest of Asia Pacific APAC Industrial Valves Industry Revenue Share (%), by Geography 2025 & 2033
- Figure 178: Rest of Asia Pacific APAC Industrial Valves Industry Volume Share (%), by Geography 2025 & 2033
- Figure 179: Rest of Asia Pacific APAC Industrial Valves Industry Revenue (Million), by Country 2025 & 2033
- Figure 180: Rest of Asia Pacific APAC Industrial Valves Industry Volume (K Units), by Country 2025 & 2033
- Figure 181: Rest of Asia Pacific APAC Industrial Valves Industry Revenue Share (%), by Country 2025 & 2033
- Figure 182: Rest of Asia Pacific APAC Industrial Valves Industry Volume Share (%), by Country 2025 & 2033
List of Tables
- Table 1: Global APAC Industrial Valves Industry Revenue Million Forecast, by Type 2020 & 2033
- Table 2: Global APAC Industrial Valves Industry Volume K Units Forecast, by Type 2020 & 2033
- Table 3: Global APAC Industrial Valves Industry Revenue Million Forecast, by Product 2020 & 2033
- Table 4: Global APAC Industrial Valves Industry Volume K Units Forecast, by Product 2020 & 2033
- Table 5: Global APAC Industrial Valves Industry Revenue Million Forecast, by Application 2020 & 2033
- Table 6: Global APAC Industrial Valves Industry Volume K Units Forecast, by Application 2020 & 2033
- Table 7: Global APAC Industrial Valves Industry Revenue Million Forecast, by Geography 2020 & 2033
- Table 8: Global APAC Industrial Valves Industry Volume K Units Forecast, by Geography 2020 & 2033
- Table 9: Global APAC Industrial Valves Industry Revenue Million Forecast, by Region 2020 & 2033
- Table 10: Global APAC Industrial Valves Industry Volume K Units Forecast, by Region 2020 & 2033
- Table 11: Global APAC Industrial Valves Industry Revenue Million Forecast, by Type 2020 & 2033
- Table 12: Global APAC Industrial Valves Industry Volume K Units Forecast, by Type 2020 & 2033
- Table 13: Global APAC Industrial Valves Industry Revenue Million Forecast, by Product 2020 & 2033
- Table 14: Global APAC Industrial Valves Industry Volume K Units Forecast, by Product 2020 & 2033
- Table 15: Global APAC Industrial Valves Industry Revenue Million Forecast, by Application 2020 & 2033
- Table 16: Global APAC Industrial Valves Industry Volume K Units Forecast, by Application 2020 & 2033
- Table 17: Global APAC Industrial Valves Industry Revenue Million Forecast, by Geography 2020 & 2033
- Table 18: Global APAC Industrial Valves Industry Volume K Units Forecast, by Geography 2020 & 2033
- Table 19: Global APAC Industrial Valves Industry Revenue Million Forecast, by Country 2020 & 2033
- Table 20: Global APAC Industrial Valves Industry Volume K Units Forecast, by Country 2020 & 2033
- Table 21: Global APAC Industrial Valves Industry Revenue Million Forecast, by Type 2020 & 2033
- Table 22: Global APAC Industrial Valves Industry Volume K Units Forecast, by Type 2020 & 2033
- Table 23: Global APAC Industrial Valves Industry Revenue Million Forecast, by Product 2020 & 2033
- Table 24: Global APAC Industrial Valves Industry Volume K Units Forecast, by Product 2020 & 2033
- Table 25: Global APAC Industrial Valves Industry Revenue Million Forecast, by Application 2020 & 2033
- Table 26: Global APAC Industrial Valves Industry Volume K Units Forecast, by Application 2020 & 2033
- Table 27: Global APAC Industrial Valves Industry Revenue Million Forecast, by Geography 2020 & 2033
- Table 28: Global APAC Industrial Valves Industry Volume K Units Forecast, by Geography 2020 & 2033
- Table 29: Global APAC Industrial Valves Industry Revenue Million Forecast, by Country 2020 & 2033
- Table 30: Global APAC Industrial Valves Industry Volume K Units Forecast, by Country 2020 & 2033
- Table 31: Global APAC Industrial Valves Industry Revenue Million Forecast, by Type 2020 & 2033
- Table 32: Global APAC Industrial Valves Industry Volume K Units Forecast, by Type 2020 & 2033
- Table 33: Global APAC Industrial Valves Industry Revenue Million Forecast, by Product 2020 & 2033
- Table 34: Global APAC Industrial Valves Industry Volume K Units Forecast, by Product 2020 & 2033
- Table 35: Global APAC Industrial Valves Industry Revenue Million Forecast, by Application 2020 & 2033
- Table 36: Global APAC Industrial Valves Industry Volume K Units Forecast, by Application 2020 & 2033
- Table 37: Global APAC Industrial Valves Industry Revenue Million Forecast, by Geography 2020 & 2033
- Table 38: Global APAC Industrial Valves Industry Volume K Units Forecast, by Geography 2020 & 2033
- Table 39: Global APAC Industrial Valves Industry Revenue Million Forecast, by Country 2020 & 2033
- Table 40: Global APAC Industrial Valves Industry Volume K Units Forecast, by Country 2020 & 2033
- Table 41: Global APAC Industrial Valves Industry Revenue Million Forecast, by Type 2020 & 2033
- Table 42: Global APAC Industrial Valves Industry Volume K Units Forecast, by Type 2020 & 2033
- Table 43: Global APAC Industrial Valves Industry Revenue Million Forecast, by Product 2020 & 2033
- Table 44: Global APAC Industrial Valves Industry Volume K Units Forecast, by Product 2020 & 2033
- Table 45: Global APAC Industrial Valves Industry Revenue Million Forecast, by Application 2020 & 2033
- Table 46: Global APAC Industrial Valves Industry Volume K Units Forecast, by Application 2020 & 2033
- Table 47: Global APAC Industrial Valves Industry Revenue Million Forecast, by Geography 2020 & 2033
- Table 48: Global APAC Industrial Valves Industry Volume K Units Forecast, by Geography 2020 & 2033
- Table 49: Global APAC Industrial Valves Industry Revenue Million Forecast, by Country 2020 & 2033
- Table 50: Global APAC Industrial Valves Industry Volume K Units Forecast, by Country 2020 & 2033
- Table 51: Global APAC Industrial Valves Industry Revenue Million Forecast, by Type 2020 & 2033
- Table 52: Global APAC Industrial Valves Industry Volume K Units Forecast, by Type 2020 & 2033
- Table 53: Global APAC Industrial Valves Industry Revenue Million Forecast, by Product 2020 & 2033
- Table 54: Global APAC Industrial Valves Industry Volume K Units Forecast, by Product 2020 & 2033
- Table 55: Global APAC Industrial Valves Industry Revenue Million Forecast, by Application 2020 & 2033
- Table 56: Global APAC Industrial Valves Industry Volume K Units Forecast, by Application 2020 & 2033
- Table 57: Global APAC Industrial Valves Industry Revenue Million Forecast, by Geography 2020 & 2033
- Table 58: Global APAC Industrial Valves Industry Volume K Units Forecast, by Geography 2020 & 2033
- Table 59: Global APAC Industrial Valves Industry Revenue Million Forecast, by Country 2020 & 2033
- Table 60: Global APAC Industrial Valves Industry Volume K Units Forecast, by Country 2020 & 2033
- Table 61: Global APAC Industrial Valves Industry Revenue Million Forecast, by Type 2020 & 2033
- Table 62: Global APAC Industrial Valves Industry Volume K Units Forecast, by Type 2020 & 2033
- Table 63: Global APAC Industrial Valves Industry Revenue Million Forecast, by Product 2020 & 2033
- Table 64: Global APAC Industrial Valves Industry Volume K Units Forecast, by Product 2020 & 2033
- Table 65: Global APAC Industrial Valves Industry Revenue Million Forecast, by Application 2020 & 2033
- Table 66: Global APAC Industrial Valves Industry Volume K Units Forecast, by Application 2020 & 2033
- Table 67: Global APAC Industrial Valves Industry Revenue Million Forecast, by Geography 2020 & 2033
- Table 68: Global APAC Industrial Valves Industry Volume K Units Forecast, by Geography 2020 & 2033
- Table 69: Global APAC Industrial Valves Industry Revenue Million Forecast, by Country 2020 & 2033
- Table 70: Global APAC Industrial Valves Industry Volume K Units Forecast, by Country 2020 & 2033
- Table 71: Global APAC Industrial Valves Industry Revenue Million Forecast, by Type 2020 & 2033
- Table 72: Global APAC Industrial Valves Industry Volume K Units Forecast, by Type 2020 & 2033
- Table 73: Global APAC Industrial Valves Industry Revenue Million Forecast, by Product 2020 & 2033
- Table 74: Global APAC Industrial Valves Industry Volume K Units Forecast, by Product 2020 & 2033
- Table 75: Global APAC Industrial Valves Industry Revenue Million Forecast, by Application 2020 & 2033
- Table 76: Global APAC Industrial Valves Industry Volume K Units Forecast, by Application 2020 & 2033
- Table 77: Global APAC Industrial Valves Industry Revenue Million Forecast, by Geography 2020 & 2033
- Table 78: Global APAC Industrial Valves Industry Volume K Units Forecast, by Geography 2020 & 2033
- Table 79: Global APAC Industrial Valves Industry Revenue Million Forecast, by Country 2020 & 2033
- Table 80: Global APAC Industrial Valves Industry Volume K Units Forecast, by Country 2020 & 2033
- Table 81: Global APAC Industrial Valves Industry Revenue Million Forecast, by Type 2020 & 2033
- Table 82: Global APAC Industrial Valves Industry Volume K Units Forecast, by Type 2020 & 2033
- Table 83: Global APAC Industrial Valves Industry Revenue Million Forecast, by Product 2020 & 2033
- Table 84: Global APAC Industrial Valves Industry Volume K Units Forecast, by Product 2020 & 2033
- Table 85: Global APAC Industrial Valves Industry Revenue Million Forecast, by Application 2020 & 2033
- Table 86: Global APAC Industrial Valves Industry Volume K Units Forecast, by Application 2020 & 2033
- Table 87: Global APAC Industrial Valves Industry Revenue Million Forecast, by Geography 2020 & 2033
- Table 88: Global APAC Industrial Valves Industry Volume K Units Forecast, by Geography 2020 & 2033
- Table 89: Global APAC Industrial Valves Industry Revenue Million Forecast, by Country 2020 & 2033
- Table 90: Global APAC Industrial Valves Industry Volume K Units Forecast, by Country 2020 & 2033
- Table 91: Global APAC Industrial Valves Industry Revenue Million Forecast, by Type 2020 & 2033
- Table 92: Global APAC Industrial Valves Industry Volume K Units Forecast, by Type 2020 & 2033
- Table 93: Global APAC Industrial Valves Industry Revenue Million Forecast, by Product 2020 & 2033
- Table 94: Global APAC Industrial Valves Industry Volume K Units Forecast, by Product 2020 & 2033
- Table 95: Global APAC Industrial Valves Industry Revenue Million Forecast, by Application 2020 & 2033
- Table 96: Global APAC Industrial Valves Industry Volume K Units Forecast, by Application 2020 & 2033
- Table 97: Global APAC Industrial Valves Industry Revenue Million Forecast, by Geography 2020 & 2033
- Table 98: Global APAC Industrial Valves Industry Volume K Units Forecast, by Geography 2020 & 2033
- Table 99: Global APAC Industrial Valves Industry Revenue Million Forecast, by Country 2020 & 2033
- Table 100: Global APAC Industrial Valves Industry Volume K Units Forecast, by Country 2020 & 2033
Frequently Asked Questions
1. What is the projected Compound Annual Growth Rate (CAGR) of the APAC Industrial Valves Industry?
The projected CAGR is approximately 5.67%.
2. Which companies are prominent players in the APAC Industrial Valves Industry?
Key companies in the market include Alfa Laval, Honeywell International Inc, Danfoss AS, Velan Inc , Okano Valve Mfg Co Ltd, SAMSON AKTIENGESELLSCHAFT, Flowserve Corporation, The Weir Group PLC, Georg Fischer Ltd, Baker Hughes, Emerson Electric Co, CIRCOR International Inc, AVK Holding AS, PARKER HANNIFIN CORP, EBRO ARMATUREN Gebr Brer GmbH, Hitachi Metals Ltd, ITT Inc, NIBCO, IMI Critical Engineering, Crane Co, Valvitalia SpA, Curtiss-Wright Corporation, Schlumberger Limited, KITZ Corporation.
3. What are the main segments of the APAC Industrial Valves Industry?
The market segments include Type, Product, Application, Geography.
4. Can you provide details about the market size?
The market size is estimated to be USD 21.98 Million as of 2022.
5. What are some drivers contributing to market growth?
Increasing Demand for Valves from Water Treatment Plants; Increasing Demand for Valves in the Oil and Gas Industry; Other Drivers.
6. What are the notable trends driving market growth?
Growing Demand in the Oil and Gas Industry.
7. Are there any restraints impacting market growth?
Impact of the COVID-19 Outbreak.
8. Can you provide examples of recent developments in the market?
March 2022: Flowserve announced a partnership with Gradiant to accelerate growth in the water technology market. Gradiant develops and delivers advanced water and wastewater treatment facilities with a primary focus in the Asia Pacific.
9. What pricing options are available for accessing the report?
Pricing options include single-user, multi-user, and enterprise licenses priced at USD 4750, USD 5250, and USD 8750 respectively.
10. Is the market size provided in terms of value or volume?
The market size is provided in terms of value, measured in Million and volume, measured in K Units.
11. Are there any specific market keywords associated with the report?
Yes, the market keyword associated with the report is "APAC Industrial Valves Industry," which aids in identifying and referencing the specific market segment covered.
12. How do I determine which pricing option suits my needs best?
The pricing options vary based on user requirements and access needs. Individual users may opt for single-user licenses, while businesses requiring broader access may choose multi-user or enterprise licenses for cost-effective access to the report.
13. Are there any additional resources or data provided in the APAC Industrial Valves Industry report?
While the report offers comprehensive insights, it's advisable to review the specific contents or supplementary materials provided to ascertain if additional resources or data are available.
14. How can I stay updated on further developments or reports in the APAC Industrial Valves Industry?
To stay informed about further developments, trends, and reports in the APAC Industrial Valves Industry, consider subscribing to industry newsletters, following relevant companies and organizations, or regularly checking reputable industry news sources and publications.
Methodology
Step 1 - Identification of Relevant Samples Size from Population Database


Step 2 - Approaches for Defining Global Market Size (Value, Volume* & Price*)

Note*: In applicable scenarios
Step 3 - Data Sources
Primary Research
- Web Analytics
- Survey Reports
- Research Institute
- Latest Research Reports
- Opinion Leaders
Secondary Research
- Annual Reports
- White Paper
- Latest Press Release
- Industry Association
- Paid Database
- Investor Presentations

Step 4 - Data Triangulation
Involves using different sources of information in order to increase the validity of a study
These sources are likely to be stakeholders in a program - participants, other researchers, program staff, other community members, and so on.
Then we put all data in single framework & apply various statistical tools to find out the dynamic on the market.
During the analysis stage, feedback from the stakeholder groups would be compared to determine areas of agreement as well as areas of divergence