

Key Insights
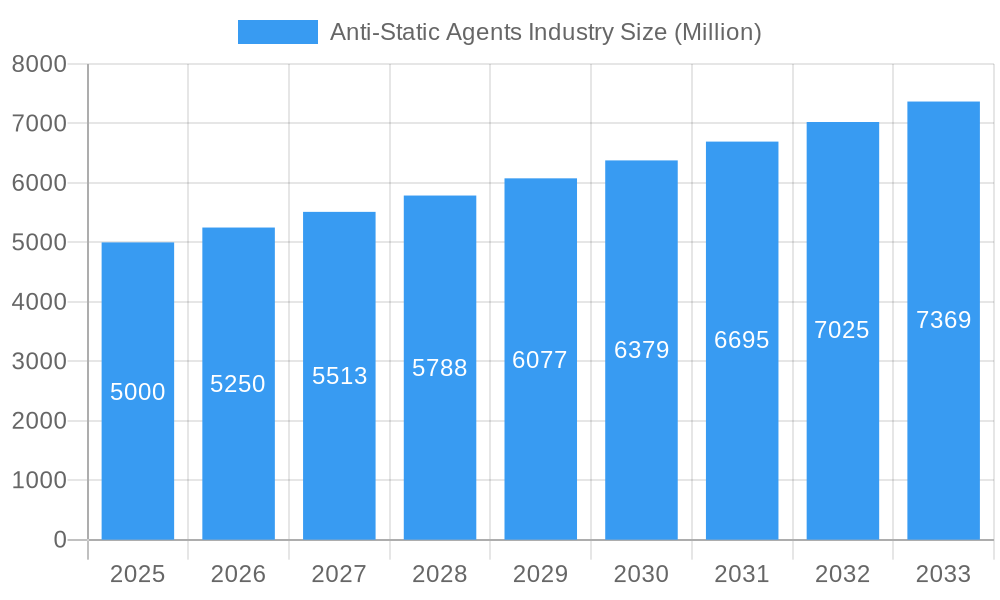
The Anti-Static Agents market is poised for significant growth, projected to reach 1253.2 million by 2025. This expansion, underpinned by a robust Compound Annual Growth Rate (CAGR) of 8.6% from 2025 to 2033, is driven by increasing demand across key industries. The electronics sector's critical need for anti-static agents to safeguard sensitive components during manufacturing and handling remains a primary growth driver. Additionally, the expanding automotive industry, with its heightened reliance on integrated electronics, significantly bolsters market demand. Evolving regulatory standards for electrostatic discharge (ESD) protection in diverse applications further encourage the widespread adoption of anti-static agents.
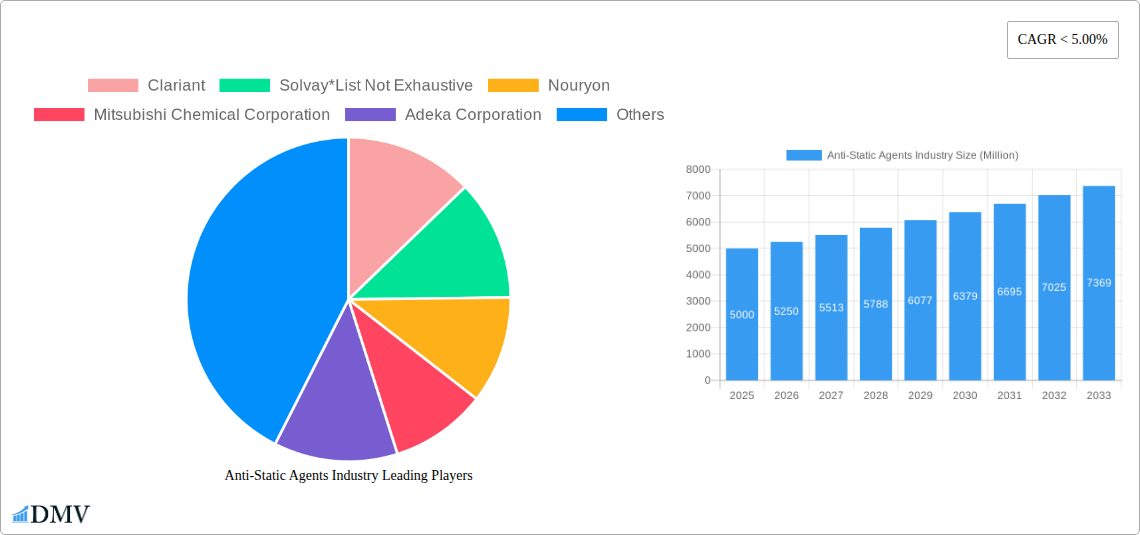
Anti-Static Agents Industry Market Size (In Billion)
The market offers a comprehensive array of solutions, including additives, coatings, and surface treatments, each tailored to meet specific industry requirements and application demands. Future growth is anticipated to be propelled by technological innovations yielding more effective and sustainable anti-static agents. The increasing integration of automation in manufacturing processes also necessitates enhanced ESD protection, thereby stimulating market expansion. Emerging applications within renewable energy technologies and medical devices further contribute to this positive market trajectory. While competitive dynamics are present, the anti-static agent market demonstrates consistent growth potential. Geographic expansion into developing economies with burgeoning manufacturing sectors presents substantial opportunities for future market penetration and value creation.
Anti-Static Agents Industry Company Market Share
Anti-Static Agents Industry Market Report: 2019-2033 Forecast
This comprehensive report provides an in-depth analysis of the global anti-static agents market, offering invaluable insights for stakeholders seeking to understand current market dynamics and future growth potential. The report covers the period 2019-2033, with a base year of 2025 and a forecast period of 2025-2033. It leverages rigorous research methodologies and incorporates data from the historical period (2019-2024) to deliver accurate predictions and actionable strategies. The market is segmented by type, polymer, and end-user industry, providing a granular understanding of its diverse facets. Key players like Clariant, Solvay, Nouryon, and Mitsubishi Chemical Corporation are profiled, illuminating their market strategies and competitive landscape. The report's projected market value exceeds xx Million by 2033.
Anti-Static Agents Industry Market Composition & Trends
This section analyzes the competitive landscape of the anti-static agents market, evaluating market concentration, innovation drivers, regulatory frameworks, and substitution dynamics. The market is moderately concentrated, with the top ten players holding an estimated xx% market share in 2025. Innovation is primarily driven by the need for enhanced performance in diverse applications, particularly within the electronics and automotive sectors. Stringent environmental regulations are shaping product development, favoring bio-based and sustainable options. Competition from alternative materials and technologies is a key factor. Significant M&A activity has been observed, with deal values exceeding xx Million in the past five years.
- Market Share Distribution (2025): Top 10 players: xx%; Others: xx%
- Key Innovation Catalysts: Demand for high-performance materials, stringent environmental regulations, and substitution pressures.
- M&A Activity (2019-2024): Total deal value exceeding xx Million.
- End-User Profiles: Dominated by electronics, automotive, and packaging industries.
Anti-Static Agents Industry Evolution
The anti-static agents market has experienced consistent growth over the past five years, driven by increasing demand from key end-user industries. The historical period (2019-2024) witnessed a Compound Annual Growth Rate (CAGR) of xx%, while the forecast period (2025-2033) projects a CAGR of xx%. Technological advancements, particularly in nanotechnology and bio-based materials, are revolutionizing product capabilities and expanding application possibilities. Consumer demand is shifting towards sustainable and environmentally friendly options, pushing manufacturers to develop more eco-conscious anti-static agents. The adoption of advanced anti-static technologies in high-growth sectors like electric vehicles and flexible electronics is accelerating market expansion.
Leading Regions, Countries, or Segments in Anti-Static Agents Industry
The Asia-Pacific region is expected to dominate the anti-static agents market throughout the forecast period, driven by rapid industrialization, particularly in electronics manufacturing. Within the segments, Polypropylene (PP) and Polyethylene (PE) applications represent the largest market share, due to their widespread use in packaging and automotive components. The Electronics end-user industry is also a major driver, fueled by the ever-increasing demand for electronic devices.
- Key Drivers (Asia-Pacific): Rapid industrialization, strong electronics manufacturing base, and rising disposable incomes.
- Key Drivers (Polypropylene & Polyethylene): Widespread use in diverse applications, cost-effectiveness, and established supply chains.
- Key Drivers (Electronics Industry): Continuous growth of the electronics sector and increasing demand for high-performance anti-static solutions.
Anti-Static Agents Industry Product Innovations
Recent innovations have focused on enhancing the performance characteristics of anti-static agents, including improved durability, reduced environmental impact, and greater efficacy across a broader range of applications. The development of bio-based anti-static agents is gaining traction, addressing growing concerns about sustainability. Advanced formulations offer enhanced performance in challenging environments, leading to improved product longevity and reduced maintenance costs. Unique selling propositions often center around improved processing efficiency, superior anti-static properties, and eco-friendly attributes.
Propelling Factors for Anti-Static Agents Industry Growth
The anti-static agents market is experiencing robust growth fueled by technological advancements such as nanotechnology and bio-based materials. The expanding electronics industry is a key driver, demanding sophisticated anti-static solutions for sensitive electronic components. Favorable government regulations promoting sustainable materials further boost market growth. Furthermore, economic growth in emerging markets is expanding demand across various sectors.
Obstacles in the Anti-Static Agents Industry Market
The market faces challenges such as fluctuating raw material prices and potential supply chain disruptions. Stringent environmental regulations can increase production costs, impacting profitability. Intense competition and the emergence of substitute materials also pose significant challenges for market participants. These factors can limit market expansion and affect pricing strategies.
Future Opportunities in Anti-Static Agents Industry
Significant opportunities lie in the development of advanced, bio-based anti-static agents catering to rising environmental concerns. Expanding applications in renewable energy sectors, such as solar panels and wind turbines, are opening new avenues. Growth in developing economies presents substantial market potential, and the integration of anti-static agents in smart packaging further fuels industry prospects.
Key Developments in Anti-Static Agents Industry
- 2022-Q4: Clariant launches a new line of bio-based anti-static agents.
- 2023-Q1: Solvay and Nouryon announce a joint venture to develop advanced anti-static solutions for the electric vehicle market.
- 2023-Q2: Mitsubishi Chemical Corporation invests xx Million in a new production facility for anti-static agents. (Further developments to be added)
Strategic Anti-Static Agents Industry Market Forecast
The anti-static agents market is poised for sustained growth, driven by technological advancements, expanding applications, and increasing demand from key end-user industries. Emerging markets, particularly in Asia-Pacific, offer significant growth opportunities. The focus on sustainability and eco-friendly solutions will further shape market dynamics, favoring bio-based and renewable options. The market is anticipated to reach xx Million by 2033, presenting lucrative prospects for investors and industry participants.
Anti-Static Agents Industry Segmentation
-
1. Type
- 1.1. Monoglycerides
- 1.2. Polyglycerol Esters
- 1.3. Diethanolamides
- 1.4. Ethoxylated Fatty Acid Amines
-
2. Polymer
- 2.1. Polypropylene (PP)
- 2.2. Polyethylene (PE)
- 2.3. Polyvinyl Chloride (PVC)
- 2.4. Others (ABS, polystyrene, etc.)
-
3. End-user Industry
- 3.1. Automotive & Transportation
- 3.2. Packaging
- 3.3. Electronics
- 3.4. Other End-User Industries (Medical, etc.)
Anti-Static Agents Industry Segmentation By Geography
-
1. Asia Pacific
- 1.1. China
- 1.2. India
- 1.3. Japan
- 1.4. South Korea
- 1.5. Rest of Asia Pacific
-
2. North America
- 2.1. United States
- 2.2. Canada
- 2.3. Mexico
-
3. Europe
- 3.1. Germany
- 3.2. United Kingdom
- 3.3. Italy
- 3.4. France
- 3.5. Rest of Europe
- 4. Rest of the World

Anti-Static Agents Industry Regional Market Share
Geographic Coverage of Anti-Static Agents Industry
Anti-Static Agents Industry REPORT HIGHLIGHTS
| Aspects | Details |
|---|---|
| Study Period | 2020-2034 |
| Base Year | 2025 |
| Estimated Year | 2026 |
| Forecast Period | 2026-2034 |
| Historical Period | 2020-2025 |
| Growth Rate | CAGR of 8.6% from 2020-2034 |
| Segmentation |
|
Table of Contents
- 1. Introduction
- 1.1. Research Scope
- 1.2. Market Segmentation
- 1.3. Research Objective
- 1.4. Definitions and Assumptions
- 2. Executive Summary
- 2.1. Market Snapshot
- 3. Market Dynamics
- 3.1. Market Drivers
- 3.2. Market Restrains
- 3.3. Market Trends
- 3.4. Market Opportunities
- 4. Market Factor Analysis
- 4.1. Porters Five Forces
- 4.1.1. Bargaining Power of Suppliers
- 4.1.2. Bargaining Power of Buyers
- 4.1.3. Threat of New Entrants
- 4.1.4. Threat of Substitutes
- 4.1.5. Competitive Rivalry
- 4.2. PESTEL analysis
- 4.3. BCG Analysis
- 4.3.1. Stars (High Growth, High Market Share)
- 4.3.2. Cash Cows (Low Growth, High Market Share)
- 4.3.3. Question Mark (High Growth, Low Market Share)
- 4.3.4. Dogs (Low Growth, Low Market Share)
- 4.4. Ansoff Matrix Analysis
- 4.5. Supply Chain Analysis
- 4.6. Regulatory Landscape
- 4.7. Current Market Potential and Opportunity Assessment (TAM–SAM–SOM Framework)
- 4.8. DMV Analyst Note
- 4.1. Porters Five Forces
- 5. Market Analysis, Insights and Forecast 2021-2033
- 5.1. Market Analysis, Insights and Forecast - by Type
- 5.1.1. Monoglycerides
- 5.1.2. Polyglycerol Esters
- 5.1.3. Diethanolamides
- 5.1.4. Ethoxylated Fatty Acid Amines
- 5.2. Market Analysis, Insights and Forecast - by Polymer
- 5.2.1. Polypropylene (PP)
- 5.2.2. Polyethylene (PE)
- 5.2.3. Polyvinyl Chloride (PVC)
- 5.2.4. Others (ABS, polystyrene, etc.)
- 5.3. Market Analysis, Insights and Forecast - by End-user Industry
- 5.3.1. Automotive & Transportation
- 5.3.2. Packaging
- 5.3.3. Electronics
- 5.3.4. Other End-User Industries (Medical, etc.)
- 5.4. Market Analysis, Insights and Forecast - by Region
- 5.4.1. Asia Pacific
- 5.4.2. North America
- 5.4.3. Europe
- 5.4.4. Rest of the World
- 5.1. Market Analysis, Insights and Forecast - by Type
- 6. Global Anti-Static Agents Industry Analysis, Insights and Forecast, 2021-2033
- 6.1. Market Analysis, Insights and Forecast - by Type
- 6.1.1. Monoglycerides
- 6.1.2. Polyglycerol Esters
- 6.1.3. Diethanolamides
- 6.1.4. Ethoxylated Fatty Acid Amines
- 6.2. Market Analysis, Insights and Forecast - by Polymer
- 6.2.1. Polypropylene (PP)
- 6.2.2. Polyethylene (PE)
- 6.2.3. Polyvinyl Chloride (PVC)
- 6.2.4. Others (ABS, polystyrene, etc.)
- 6.3. Market Analysis, Insights and Forecast - by End-user Industry
- 6.3.1. Automotive & Transportation
- 6.3.2. Packaging
- 6.3.3. Electronics
- 6.3.4. Other End-User Industries (Medical, etc.)
- 6.1. Market Analysis, Insights and Forecast - by Type
- 7. Asia Pacific Anti-Static Agents Industry Analysis, Insights and Forecast, 2020-2032
- 7.1. Market Analysis, Insights and Forecast - by Type
- 7.1.1. Monoglycerides
- 7.1.2. Polyglycerol Esters
- 7.1.3. Diethanolamides
- 7.1.4. Ethoxylated Fatty Acid Amines
- 7.2. Market Analysis, Insights and Forecast - by Polymer
- 7.2.1. Polypropylene (PP)
- 7.2.2. Polyethylene (PE)
- 7.2.3. Polyvinyl Chloride (PVC)
- 7.2.4. Others (ABS, polystyrene, etc.)
- 7.3. Market Analysis, Insights and Forecast - by End-user Industry
- 7.3.1. Automotive & Transportation
- 7.3.2. Packaging
- 7.3.3. Electronics
- 7.3.4. Other End-User Industries (Medical, etc.)
- 7.1. Market Analysis, Insights and Forecast - by Type
- 8. North America Anti-Static Agents Industry Analysis, Insights and Forecast, 2020-2032
- 8.1. Market Analysis, Insights and Forecast - by Type
- 8.1.1. Monoglycerides
- 8.1.2. Polyglycerol Esters
- 8.1.3. Diethanolamides
- 8.1.4. Ethoxylated Fatty Acid Amines
- 8.2. Market Analysis, Insights and Forecast - by Polymer
- 8.2.1. Polypropylene (PP)
- 8.2.2. Polyethylene (PE)
- 8.2.3. Polyvinyl Chloride (PVC)
- 8.2.4. Others (ABS, polystyrene, etc.)
- 8.3. Market Analysis, Insights and Forecast - by End-user Industry
- 8.3.1. Automotive & Transportation
- 8.3.2. Packaging
- 8.3.3. Electronics
- 8.3.4. Other End-User Industries (Medical, etc.)
- 8.1. Market Analysis, Insights and Forecast - by Type
- 9. Europe Anti-Static Agents Industry Analysis, Insights and Forecast, 2020-2032
- 9.1. Market Analysis, Insights and Forecast - by Type
- 9.1.1. Monoglycerides
- 9.1.2. Polyglycerol Esters
- 9.1.3. Diethanolamides
- 9.1.4. Ethoxylated Fatty Acid Amines
- 9.2. Market Analysis, Insights and Forecast - by Polymer
- 9.2.1. Polypropylene (PP)
- 9.2.2. Polyethylene (PE)
- 9.2.3. Polyvinyl Chloride (PVC)
- 9.2.4. Others (ABS, polystyrene, etc.)
- 9.3. Market Analysis, Insights and Forecast - by End-user Industry
- 9.3.1. Automotive & Transportation
- 9.3.2. Packaging
- 9.3.3. Electronics
- 9.3.4. Other End-User Industries (Medical, etc.)
- 9.1. Market Analysis, Insights and Forecast - by Type
- 10. Rest of the World Anti-Static Agents Industry Analysis, Insights and Forecast, 2020-2032
- 10.1. Market Analysis, Insights and Forecast - by Type
- 10.1.1. Monoglycerides
- 10.1.2. Polyglycerol Esters
- 10.1.3. Diethanolamides
- 10.1.4. Ethoxylated Fatty Acid Amines
- 10.2. Market Analysis, Insights and Forecast - by Polymer
- 10.2.1. Polypropylene (PP)
- 10.2.2. Polyethylene (PE)
- 10.2.3. Polyvinyl Chloride (PVC)
- 10.2.4. Others (ABS, polystyrene, etc.)
- 10.3. Market Analysis, Insights and Forecast - by End-user Industry
- 10.3.1. Automotive & Transportation
- 10.3.2. Packaging
- 10.3.3. Electronics
- 10.3.4. Other End-User Industries (Medical, etc.)
- 10.1. Market Analysis, Insights and Forecast - by Type
- 11. Competitive Analysis
- 11.1. Company Profiles
- 11.1.1 Clariant
- 11.1.1.1. Company Overview
- 11.1.1.2. Products
- 11.1.1.3. Company Financials
- 11.1.1.4. SWOT Analysis
- 11.1.2 Solvay*List Not Exhaustive
- 11.1.2.1. Company Overview
- 11.1.2.2. Products
- 11.1.2.3. Company Financials
- 11.1.2.4. SWOT Analysis
- 11.1.3 Nouryon
- 11.1.3.1. Company Overview
- 11.1.3.2. Products
- 11.1.3.3. Company Financials
- 11.1.3.4. SWOT Analysis
- 11.1.4 Mitsubishi Chemical Corporation
- 11.1.4.1. Company Overview
- 11.1.4.2. Products
- 11.1.4.3. Company Financials
- 11.1.4.4. SWOT Analysis
- 11.1.5 Adeka Corporation
- 11.1.5.1. Company Overview
- 11.1.5.2. Products
- 11.1.5.3. Company Financials
- 11.1.5.4. SWOT Analysis
- 11.1.6 3M
- 11.1.6.1. Company Overview
- 11.1.6.2. Products
- 11.1.6.3. Company Financials
- 11.1.6.4. SWOT Analysis
- 11.1.7 Croda International Plc
- 11.1.7.1. Company Overview
- 11.1.7.2. Products
- 11.1.7.3. Company Financials
- 11.1.7.4. SWOT Analysis
- 11.1.8 Emery Oleochemicals
- 11.1.8.1. Company Overview
- 11.1.8.2. Products
- 11.1.8.3. Company Financials
- 11.1.8.4. SWOT Analysis
- 11.1.9 BASF SE
- 11.1.9.1. Company Overview
- 11.1.9.2. Products
- 11.1.9.3. Company Financials
- 11.1.9.4. SWOT Analysis
- 11.1.10 Arkema Group
- 11.1.10.1. Company Overview
- 11.1.10.2. Products
- 11.1.10.3. Company Financials
- 11.1.10.4. SWOT Analysis
- 11.1.11 Palsgaard
- 11.1.11.1. Company Overview
- 11.1.11.2. Products
- 11.1.11.3. Company Financials
- 11.1.11.4. SWOT Analysis
- 11.1.12 DuPont
- 11.1.12.1. Company Overview
- 11.1.12.2. Products
- 11.1.12.3. Company Financials
- 11.1.12.4. SWOT Analysis
- 11.1.13 Evonik industries
- 11.1.13.1. Company Overview
- 11.1.13.2. Products
- 11.1.13.3. Company Financials
- 11.1.13.4. SWOT Analysis
- 11.1.14 Kao Corporation
- 11.1.14.1. Company Overview
- 11.1.14.2. Products
- 11.1.14.3. Company Financials
- 11.1.14.4. SWOT Analysis
- 11.1.15 Polyone Corporation
- 11.1.15.1. Company Overview
- 11.1.15.2. Products
- 11.1.15.3. Company Financials
- 11.1.15.4. SWOT Analysis
- 11.1.16 Ampacet Corporation
- 11.1.16.1. Company Overview
- 11.1.16.2. Products
- 11.1.16.3. Company Financials
- 11.1.16.4. SWOT Analysis
- 11.1.1 Clariant
- 11.2. Market Entropy
- 11.2.1 Company's Key Areas Served
- 11.2.2 Recent Developments
- 11.3. Company Market Share Analysis 2025
- 11.3.1 Top 5 Companies Market Share Analysis
- 11.3.2 Top 3 Companies Market Share Analysis
- 11.4. List of Potential Customers
- 12. Research Methodology
List of Figures
- Figure 1: Global Anti-Static Agents Industry Revenue Breakdown (million, %) by Region 2025 & 2033
- Figure 2: Asia Pacific Anti-Static Agents Industry Revenue (million), by Type 2025 & 2033
- Figure 3: Asia Pacific Anti-Static Agents Industry Revenue Share (%), by Type 2025 & 2033
- Figure 4: Asia Pacific Anti-Static Agents Industry Revenue (million), by Polymer 2025 & 2033
- Figure 5: Asia Pacific Anti-Static Agents Industry Revenue Share (%), by Polymer 2025 & 2033
- Figure 6: Asia Pacific Anti-Static Agents Industry Revenue (million), by End-user Industry 2025 & 2033
- Figure 7: Asia Pacific Anti-Static Agents Industry Revenue Share (%), by End-user Industry 2025 & 2033
- Figure 8: Asia Pacific Anti-Static Agents Industry Revenue (million), by Country 2025 & 2033
- Figure 9: Asia Pacific Anti-Static Agents Industry Revenue Share (%), by Country 2025 & 2033
- Figure 10: North America Anti-Static Agents Industry Revenue (million), by Type 2025 & 2033
- Figure 11: North America Anti-Static Agents Industry Revenue Share (%), by Type 2025 & 2033
- Figure 12: North America Anti-Static Agents Industry Revenue (million), by Polymer 2025 & 2033
- Figure 13: North America Anti-Static Agents Industry Revenue Share (%), by Polymer 2025 & 2033
- Figure 14: North America Anti-Static Agents Industry Revenue (million), by End-user Industry 2025 & 2033
- Figure 15: North America Anti-Static Agents Industry Revenue Share (%), by End-user Industry 2025 & 2033
- Figure 16: North America Anti-Static Agents Industry Revenue (million), by Country 2025 & 2033
- Figure 17: North America Anti-Static Agents Industry Revenue Share (%), by Country 2025 & 2033
- Figure 18: Europe Anti-Static Agents Industry Revenue (million), by Type 2025 & 2033
- Figure 19: Europe Anti-Static Agents Industry Revenue Share (%), by Type 2025 & 2033
- Figure 20: Europe Anti-Static Agents Industry Revenue (million), by Polymer 2025 & 2033
- Figure 21: Europe Anti-Static Agents Industry Revenue Share (%), by Polymer 2025 & 2033
- Figure 22: Europe Anti-Static Agents Industry Revenue (million), by End-user Industry 2025 & 2033
- Figure 23: Europe Anti-Static Agents Industry Revenue Share (%), by End-user Industry 2025 & 2033
- Figure 24: Europe Anti-Static Agents Industry Revenue (million), by Country 2025 & 2033
- Figure 25: Europe Anti-Static Agents Industry Revenue Share (%), by Country 2025 & 2033
- Figure 26: Rest of the World Anti-Static Agents Industry Revenue (million), by Type 2025 & 2033
- Figure 27: Rest of the World Anti-Static Agents Industry Revenue Share (%), by Type 2025 & 2033
- Figure 28: Rest of the World Anti-Static Agents Industry Revenue (million), by Polymer 2025 & 2033
- Figure 29: Rest of the World Anti-Static Agents Industry Revenue Share (%), by Polymer 2025 & 2033
- Figure 30: Rest of the World Anti-Static Agents Industry Revenue (million), by End-user Industry 2025 & 2033
- Figure 31: Rest of the World Anti-Static Agents Industry Revenue Share (%), by End-user Industry 2025 & 2033
- Figure 32: Rest of the World Anti-Static Agents Industry Revenue (million), by Country 2025 & 2033
- Figure 33: Rest of the World Anti-Static Agents Industry Revenue Share (%), by Country 2025 & 2033
List of Tables
- Table 1: Global Anti-Static Agents Industry Revenue million Forecast, by Type 2020 & 2033
- Table 2: Global Anti-Static Agents Industry Revenue million Forecast, by Polymer 2020 & 2033
- Table 3: Global Anti-Static Agents Industry Revenue million Forecast, by End-user Industry 2020 & 2033
- Table 4: Global Anti-Static Agents Industry Revenue million Forecast, by Region 2020 & 2033
- Table 5: Global Anti-Static Agents Industry Revenue million Forecast, by Type 2020 & 2033
- Table 6: Global Anti-Static Agents Industry Revenue million Forecast, by Polymer 2020 & 2033
- Table 7: Global Anti-Static Agents Industry Revenue million Forecast, by End-user Industry 2020 & 2033
- Table 8: Global Anti-Static Agents Industry Revenue million Forecast, by Country 2020 & 2033
- Table 9: China Anti-Static Agents Industry Revenue (million) Forecast, by Application 2020 & 2033
- Table 10: India Anti-Static Agents Industry Revenue (million) Forecast, by Application 2020 & 2033
- Table 11: Japan Anti-Static Agents Industry Revenue (million) Forecast, by Application 2020 & 2033
- Table 12: South Korea Anti-Static Agents Industry Revenue (million) Forecast, by Application 2020 & 2033
- Table 13: Rest of Asia Pacific Anti-Static Agents Industry Revenue (million) Forecast, by Application 2020 & 2033
- Table 14: Global Anti-Static Agents Industry Revenue million Forecast, by Type 2020 & 2033
- Table 15: Global Anti-Static Agents Industry Revenue million Forecast, by Polymer 2020 & 2033
- Table 16: Global Anti-Static Agents Industry Revenue million Forecast, by End-user Industry 2020 & 2033
- Table 17: Global Anti-Static Agents Industry Revenue million Forecast, by Country 2020 & 2033
- Table 18: United States Anti-Static Agents Industry Revenue (million) Forecast, by Application 2020 & 2033
- Table 19: Canada Anti-Static Agents Industry Revenue (million) Forecast, by Application 2020 & 2033
- Table 20: Mexico Anti-Static Agents Industry Revenue (million) Forecast, by Application 2020 & 2033
- Table 21: Global Anti-Static Agents Industry Revenue million Forecast, by Type 2020 & 2033
- Table 22: Global Anti-Static Agents Industry Revenue million Forecast, by Polymer 2020 & 2033
- Table 23: Global Anti-Static Agents Industry Revenue million Forecast, by End-user Industry 2020 & 2033
- Table 24: Global Anti-Static Agents Industry Revenue million Forecast, by Country 2020 & 2033
- Table 25: Germany Anti-Static Agents Industry Revenue (million) Forecast, by Application 2020 & 2033
- Table 26: United Kingdom Anti-Static Agents Industry Revenue (million) Forecast, by Application 2020 & 2033
- Table 27: Italy Anti-Static Agents Industry Revenue (million) Forecast, by Application 2020 & 2033
- Table 28: France Anti-Static Agents Industry Revenue (million) Forecast, by Application 2020 & 2033
- Table 29: Rest of Europe Anti-Static Agents Industry Revenue (million) Forecast, by Application 2020 & 2033
- Table 30: Global Anti-Static Agents Industry Revenue million Forecast, by Type 2020 & 2033
- Table 31: Global Anti-Static Agents Industry Revenue million Forecast, by Polymer 2020 & 2033
- Table 32: Global Anti-Static Agents Industry Revenue million Forecast, by End-user Industry 2020 & 2033
- Table 33: Global Anti-Static Agents Industry Revenue million Forecast, by Country 2020 & 2033
Frequently Asked Questions
1. What is the projected Compound Annual Growth Rate (CAGR) of the Anti-Static Agents Industry?
The projected CAGR is approximately 8.6%.
2. Which companies are prominent players in the Anti-Static Agents Industry?
Key companies in the market include Clariant, Solvay*List Not Exhaustive, Nouryon, Mitsubishi Chemical Corporation, Adeka Corporation, 3M, Croda International Plc, Emery Oleochemicals, BASF SE, Arkema Group, Palsgaard, DuPont, Evonik industries, Kao Corporation, Polyone Corporation, Ampacet Corporation.
3. What are the main segments of the Anti-Static Agents Industry?
The market segments include Type, Polymer, End-user Industry.
4. Can you provide details about the market size?
The market size is estimated to be USD 1253.2 million as of 2022.
5. What are some drivers contributing to market growth?
; Growing demand of plastics from various end user industries; Issues of static build up in plastics.
6. What are the notable trends driving market growth?
Growing Usage in Packaging Industry.
7. Are there any restraints impacting market growth?
; Less Temperature Resistance; Other Restriants.
8. Can you provide examples of recent developments in the market?
N/A
9. What pricing options are available for accessing the report?
Pricing options include single-user, multi-user, and enterprise licenses priced at USD 4750, USD 5250, and USD 8750 respectively.
10. Is the market size provided in terms of value or volume?
The market size is provided in terms of value, measured in million.
11. Are there any specific market keywords associated with the report?
Yes, the market keyword associated with the report is "Anti-Static Agents Industry," which aids in identifying and referencing the specific market segment covered.
12. How do I determine which pricing option suits my needs best?
The pricing options vary based on user requirements and access needs. Individual users may opt for single-user licenses, while businesses requiring broader access may choose multi-user or enterprise licenses for cost-effective access to the report.
13. Are there any additional resources or data provided in the Anti-Static Agents Industry report?
While the report offers comprehensive insights, it's advisable to review the specific contents or supplementary materials provided to ascertain if additional resources or data are available.
14. How can I stay updated on further developments or reports in the Anti-Static Agents Industry?
To stay informed about further developments, trends, and reports in the Anti-Static Agents Industry, consider subscribing to industry newsletters, following relevant companies and organizations, or regularly checking reputable industry news sources and publications.
Methodology
Step 1 - Identification of Relevant Samples Size from Population Database


Step 2 - Approaches for Defining Global Market Size (Value, Volume* & Price*)

Note*: In applicable scenarios
Step 3 - Data Sources
Primary Research
- Web Analytics
- Survey Reports
- Research Institute
- Latest Research Reports
- Opinion Leaders
Secondary Research
- Annual Reports
- White Paper
- Latest Press Release
- Industry Association
- Paid Database
- Investor Presentations

Step 4 - Data Triangulation
Involves using different sources of information in order to increase the validity of a study
These sources are likely to be stakeholders in a program - participants, other researchers, program staff, other community members, and so on.
Then we put all data in single framework & apply various statistical tools to find out the dynamic on the market.
During the analysis stage, feedback from the stakeholder groups would be compared to determine areas of agreement as well as areas of divergence