

Key Insights
The global ammonia market, valued at approximately 68840 million in 2025, is projected to grow at a compound annual growth rate (CAGR) of 1.2% from 2025 to 2033. Key growth drivers include robust demand from the agricultural sector, supported by increasing global populations and the necessity for enhanced crop yields. The expanding textile and pharmaceutical industries also contribute significantly, utilizing ammonia as a vital raw material. Market restraints encompass volatile energy prices, a primary input cost; stringent environmental regulations targeting greenhouse gas emissions; and potential geopolitical impacts on fertilizer supply chains. The market is segmented by product form, with liquid ammonia dominating volume, followed by gaseous ammonia. Agriculture remains the leading end-user industry, while textiles, mining, and pharmaceuticals exhibit consistent, albeit moderate, demand. The Asia-Pacific region is anticipated to lead in market share, driven by its substantial agricultural base and rapid industrialization. North America and Europe, while mature, will maintain steady demand from established agricultural and industrial sectors.
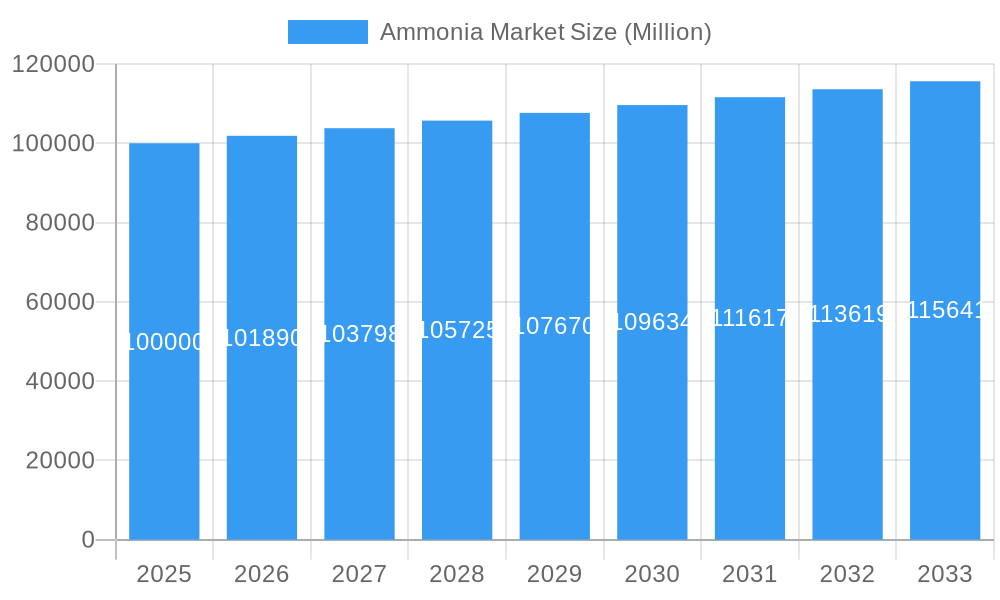
Ammonia Market Market Size (In Billion)
The competitive landscape features a blend of large multinational corporations and regional players. Leading companies such as BASF, Yara, and CF Industries maintain substantial market share through established production capacities and extensive distribution networks. Regional players are increasingly influential, particularly in developing economies, contributing to dynamic market diversification. The forecast period (2025-2033) indicates continued, measured expansion, with potential shifts in regional dominance influenced by government policies favoring sustainable agriculture and investments in new production capacities in emerging markets. Overall, the ammonia market is set for stable growth, primarily driven by agricultural imperatives, while navigating challenges in energy costs and environmental compliance. Opportunities exist in sustainable ammonia production and supply chain optimization.
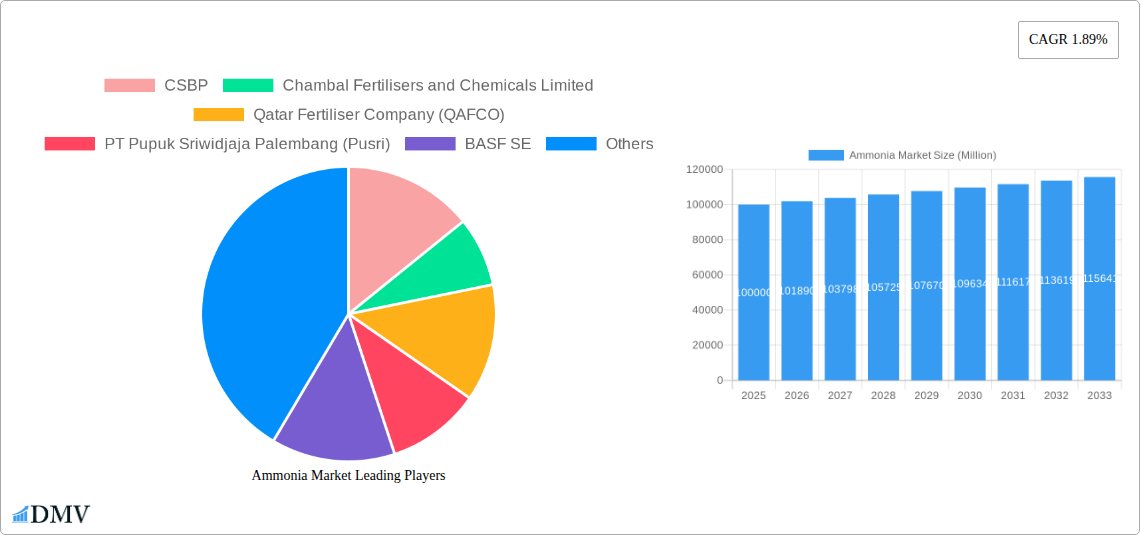
Ammonia Market Company Market Share
Ammonia Market Analysis: Size, Trends, and Forecast (2025-2033)
This comprehensive report analyzes the global ammonia market from 2025 to 2033, detailing market dynamics, competitive intelligence, technological advancements, and future growth projections. It provides actionable insights for stakeholders through rigorous data analysis, sophisticated forecasting models, and expert commentary. The market is projected to reach substantial value by 2033, presenting significant growth potential.
Ammonia Market Composition & Trends
This section evaluates the competitive intensity of the ammonia market, identifying key drivers of innovation, regulatory hurdles, substitute products, and end-user trends. The analysis also covers the significant M&A activity shaping the industry.
Market Concentration: The ammonia market exhibits a moderately concentrated structure, with several major players commanding substantial market shares. The top five players—including Nutrien Ltd, Yara, CF Industries Holdings Inc., OCI, and BASF SE—hold approximately xx% of the global market share in 2025. The market share distribution is expected to undergo slight shifts due to ongoing M&A activity.
Innovation Catalysts: Growing demand for sustainable ammonia production, driven by environmental concerns, is a major innovation catalyst. This is stimulating research into green ammonia production methods, such as utilizing renewable energy sources for ammonia synthesis.
Regulatory Landscape: Stringent environmental regulations regarding ammonia emissions, particularly in developed countries, are influencing production processes and driving the adoption of cleaner technologies. Varying regulations across regions are also creating complexities for global players.
Substitute Products: While ammonia currently holds a dominant position in its application areas, some industrial segments are exploring alternative nitrogen sources. The competitiveness of these substitutes depends on factors such as cost, availability, and environmental impact.
End-User Profiles: The agricultural sector remains the largest consumer of ammonia, followed by industrial applications like textiles, refrigeration, and water treatment. However, the pharmaceutical and mining industries represent emerging segments with significant growth potential.
M&A Activities: Recent M&A activities, such as CF Industries Holdings Inc.'s acquisition of Incitec Pivot Limited's Waggaman facility in December 2023 for USD 1.675 Billion, underscore the consolidating nature of the market. These deals highlight the strategic importance of securing production capacity and expanding market reach. The total value of M&A deals in the ammonia market between 2019 and 2024 reached an estimated xx Million USD.
Ammonia Market Industry Evolution
This section details the growth trajectory of the ammonia market, technological advancements, and evolving consumer demands.
The global ammonia market witnessed a Compound Annual Growth Rate (CAGR) of xx% during the historical period (2019-2024), driven primarily by increasing fertilizer demand and industrial applications. The market is expected to maintain a healthy CAGR of xx% during the forecast period (2025-2033). Technological innovations, such as the development of more efficient production processes and the emergence of green ammonia, are further stimulating market growth. Shifts in consumer demand towards sustainable and environmentally friendly products are also impacting the market, pushing producers to adopt greener technologies and sustainable practices. The adoption of Haber-Bosch process alternatives has seen a xx% increase since 2019. Growing focus on renewable energy integration in ammonia production is also influencing the market, with xx% of new production facilities expected to incorporate renewable energy by 2033.
Leading Regions, Countries, or Segments in Ammonia Market
This section identifies the leading regions, countries, and segments within the ammonia market.
Dominant Region: Asia-Pacific currently holds the largest market share due to its significant agricultural sector and rapidly industrializing economies. China and India are leading consumers of ammonia.
Dominant Country: China, driven by its massive agricultural sector and robust industrialization, holds the largest individual country market share.
Dominant Segments:
- Type: Liquid ammonia accounts for the largest market share due to its ease of transportation and handling.
- End-user Industry: Agriculture represents the largest end-user segment, consuming the majority of the ammonia produced globally, driven by the burgeoning global population and increasing demand for food.
Key Drivers:
- Investment Trends: Substantial investments in new ammonia production facilities and technological upgrades are driving market expansion, particularly in emerging economies.
- Regulatory Support: Governmental policies promoting agricultural development and encouraging the use of fertilizers are bolstering market growth in several regions. Specific examples include [insert examples of supportive policies in specific countries/regions].
The dominance of these regions and segments is primarily attributed to factors such as robust agricultural activities, industrial development, favorable government policies, and significant investments in ammonia production infrastructure.
Ammonia Market Product Innovations
Recent product innovations focus on enhancing ammonia production efficiency, reducing environmental impact, and developing new applications. Significant advancements include the development of more energy-efficient synthesis processes and the exploration of green ammonia production methods using renewable energy sources. These innovations aim to reduce the carbon footprint associated with ammonia production and meet the growing demand for sustainable solutions. The unique selling proposition of these new products focuses on reduced environmental impact and improved efficiency, catering to the growing environmental consciousness and cost-optimization needs of end-users.
Propelling Factors for Ammonia Market Growth
Several key factors are propelling the growth of the ammonia market. These include:
Technological Advancements: Continuous improvements in ammonia synthesis technology are leading to increased production efficiency and lower costs. The development of green ammonia production methods further enhances market prospects.
Economic Growth: Growing economies, particularly in developing nations, are increasing demand for fertilizers and industrial chemicals, fueling market expansion.
Regulatory Support: Government policies aimed at boosting agricultural productivity and supporting industrial growth are fostering ammonia market growth. These policies often include subsidies and incentives for ammonia production and utilization.
Obstacles in the Ammonia Market
The ammonia market faces several challenges, including:
Regulatory Challenges: Strict environmental regulations regarding ammonia emissions pose significant hurdles for producers. Compliance costs and potential production restrictions can impact profitability.
Supply Chain Disruptions: Geopolitical instability and supply chain bottlenecks can disrupt ammonia production and distribution, leading to price volatility.
Competitive Pressures: Intense competition among major players necessitates continuous innovation and cost optimization to maintain market share. The impact of these competitive pressures includes price wars and reduced profit margins.
Future Opportunities in Ammonia Market
The ammonia market presents exciting future opportunities. These include:
New Markets: Expansion into new applications, such as hydrogen carriers and direct ammonia fuel cells, offers significant growth potential.
Technological Advancements: The development of more efficient and sustainable ammonia production methods will drive market expansion.
Consumer Trends: The increasing awareness of the importance of sustainable solutions will drive demand for green ammonia.
Major Players in the Ammonia Market Ecosystem
- CSBP
- Chambal Fertilisers and Chemicals Limited
- Qatar Fertiliser Company (QAFCO)
- PT Pupuk Sriwidjaja Palembang (Pusri)
- BASF SE
- OCI
- Group DF (Ostchem)
- SABIC
- Eurochem Group
- Koch Fertilizer LLC
- Rashtriya Chemicals And Fertilizers Limited
- CF Industries Holdings Inc
- IFFCO
- Jsc Togliattiazot
- Nutrien Ltd
- Yara *List Not Exhaustive
Key Developments in Ammonia Market Industry
December 2023: CF Industries Holdings Inc. completed the acquisition of Incitec Pivot Limited’s (IPL) Waggaman ammonia production facility for USD 1.675 billion, significantly expanding its production capacity.
March 2024: Yara collaborated with GHC SAOC, a wholly-owned subsidiary of Acme Cleantech, to secure the supply of 100,000 tons per annum of renewable ammonia, demonstrating a commitment to sustainable production.
Strategic Ammonia Market Forecast
The ammonia market is poised for robust growth over the forecast period, driven by several factors. Increasing global food demand, coupled with ongoing industrialization, will sustain high demand for ammonia. Furthermore, the ongoing transition towards sustainable practices, including the adoption of renewable energy in ammonia production, will unlock new market opportunities. The focus on green ammonia and technological advancements in production processes will further drive market expansion in the coming years.
Ammonia Market Segmentation
-
1. Type
- 1.1. Liquid
- 1.2. Gas
-
2. End-user Industry
- 2.1. Agriculture
- 2.2. Textiles
- 2.3. Mining
- 2.4. Pharmaceutical
- 2.5. Refrigeration
- 2.6. Other En
Ammonia Market Segmentation By Geography
-
1. Asia Pacific
- 1.1. China
- 1.2. India
- 1.3. Japan
- 1.4. South Korea
- 1.5. Rest of Asia Pacific
-
2. North America
- 2.1. United States
- 2.2. Canada
- 2.3. Mexico
-
3. Europe
- 3.1. Germany
- 3.2. United Kingdom
- 3.3. France
- 3.4. Italy
- 3.5. Rest of Europe
-
4. South America
- 4.1. Brazil
- 4.2. Argentina
- 4.3. Rest of South America
-
5. Middle East and Africa
- 5.1. Saudi Arabia
- 5.2. South Africa
- 5.3. Rest of Middle East and Africa
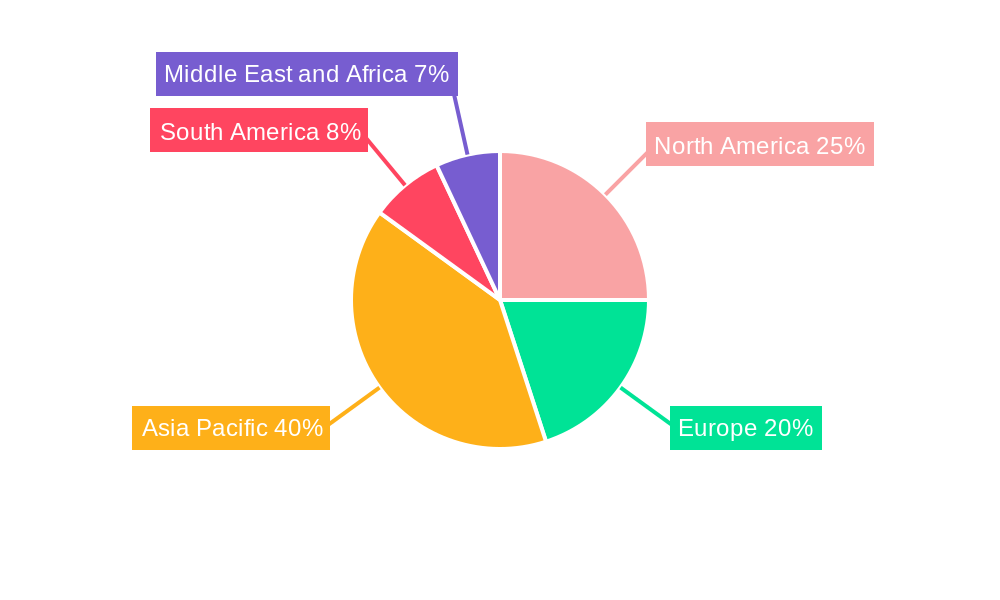
Ammonia Market Regional Market Share
Geographic Coverage of Ammonia Market
Ammonia Market REPORT HIGHLIGHTS
| Aspects | Details |
|---|---|
| Study Period | 2020-2034 |
| Base Year | 2025 |
| Estimated Year | 2026 |
| Forecast Period | 2026-2034 |
| Historical Period | 2020-2025 |
| Growth Rate | CAGR of 1.2% from 2020-2034 |
| Segmentation |
|
Table of Contents
- 1. Introduction
- 1.1. Research Scope
- 1.2. Market Segmentation
- 1.3. Research Objective
- 1.4. Definitions and Assumptions
- 2. Executive Summary
- 2.1. Market Snapshot
- 3. Market Dynamics
- 3.1. Market Drivers
- 3.2. Market Restrains
- 3.3. Market Trends
- 3.4. Market Opportunities
- 4. Market Factor Analysis
- 4.1. Porters Five Forces
- 4.1.1. Bargaining Power of Suppliers
- 4.1.2. Bargaining Power of Buyers
- 4.1.3. Threat of New Entrants
- 4.1.4. Threat of Substitutes
- 4.1.5. Competitive Rivalry
- 4.2. PESTEL analysis
- 4.3. BCG Analysis
- 4.3.1. Stars (High Growth, High Market Share)
- 4.3.2. Cash Cows (Low Growth, High Market Share)
- 4.3.3. Question Mark (High Growth, Low Market Share)
- 4.3.4. Dogs (Low Growth, Low Market Share)
- 4.4. Ansoff Matrix Analysis
- 4.5. Supply Chain Analysis
- 4.6. Regulatory Landscape
- 4.7. Current Market Potential and Opportunity Assessment (TAM–SAM–SOM Framework)
- 4.8. DMV Analyst Note
- 4.1. Porters Five Forces
- 5. Market Analysis, Insights and Forecast 2021-2033
- 5.1. Market Analysis, Insights and Forecast - by Type
- 5.1.1. Liquid
- 5.1.2. Gas
- 5.2. Market Analysis, Insights and Forecast - by End-user Industry
- 5.2.1. Agriculture
- 5.2.2. Textiles
- 5.2.3. Mining
- 5.2.4. Pharmaceutical
- 5.2.5. Refrigeration
- 5.2.6. Other En
- 5.3. Market Analysis, Insights and Forecast - by Region
- 5.3.1. Asia Pacific
- 5.3.2. North America
- 5.3.3. Europe
- 5.3.4. South America
- 5.3.5. Middle East and Africa
- 5.1. Market Analysis, Insights and Forecast - by Type
- 6. Global Ammonia Market Analysis, Insights and Forecast, 2021-2033
- 6.1. Market Analysis, Insights and Forecast - by Type
- 6.1.1. Liquid
- 6.1.2. Gas
- 6.2. Market Analysis, Insights and Forecast - by End-user Industry
- 6.2.1. Agriculture
- 6.2.2. Textiles
- 6.2.3. Mining
- 6.2.4. Pharmaceutical
- 6.2.5. Refrigeration
- 6.2.6. Other En
- 6.1. Market Analysis, Insights and Forecast - by Type
- 7. Asia Pacific Ammonia Market Analysis, Insights and Forecast, 2020-2032
- 7.1. Market Analysis, Insights and Forecast - by Type
- 7.1.1. Liquid
- 7.1.2. Gas
- 7.2. Market Analysis, Insights and Forecast - by End-user Industry
- 7.2.1. Agriculture
- 7.2.2. Textiles
- 7.2.3. Mining
- 7.2.4. Pharmaceutical
- 7.2.5. Refrigeration
- 7.2.6. Other En
- 7.1. Market Analysis, Insights and Forecast - by Type
- 8. North America Ammonia Market Analysis, Insights and Forecast, 2020-2032
- 8.1. Market Analysis, Insights and Forecast - by Type
- 8.1.1. Liquid
- 8.1.2. Gas
- 8.2. Market Analysis, Insights and Forecast - by End-user Industry
- 8.2.1. Agriculture
- 8.2.2. Textiles
- 8.2.3. Mining
- 8.2.4. Pharmaceutical
- 8.2.5. Refrigeration
- 8.2.6. Other En
- 8.1. Market Analysis, Insights and Forecast - by Type
- 9. Europe Ammonia Market Analysis, Insights and Forecast, 2020-2032
- 9.1. Market Analysis, Insights and Forecast - by Type
- 9.1.1. Liquid
- 9.1.2. Gas
- 9.2. Market Analysis, Insights and Forecast - by End-user Industry
- 9.2.1. Agriculture
- 9.2.2. Textiles
- 9.2.3. Mining
- 9.2.4. Pharmaceutical
- 9.2.5. Refrigeration
- 9.2.6. Other En
- 9.1. Market Analysis, Insights and Forecast - by Type
- 10. South America Ammonia Market Analysis, Insights and Forecast, 2020-2032
- 10.1. Market Analysis, Insights and Forecast - by Type
- 10.1.1. Liquid
- 10.1.2. Gas
- 10.2. Market Analysis, Insights and Forecast - by End-user Industry
- 10.2.1. Agriculture
- 10.2.2. Textiles
- 10.2.3. Mining
- 10.2.4. Pharmaceutical
- 10.2.5. Refrigeration
- 10.2.6. Other En
- 10.1. Market Analysis, Insights and Forecast - by Type
- 11. Middle East and Africa Ammonia Market Analysis, Insights and Forecast, 2020-2032
- 11.1. Market Analysis, Insights and Forecast - by Type
- 11.1.1. Liquid
- 11.1.2. Gas
- 11.2. Market Analysis, Insights and Forecast - by End-user Industry
- 11.2.1. Agriculture
- 11.2.2. Textiles
- 11.2.3. Mining
- 11.2.4. Pharmaceutical
- 11.2.5. Refrigeration
- 11.2.6. Other En
- 11.1. Market Analysis, Insights and Forecast - by Type
- 12. Competitive Analysis
- 12.1. Company Profiles
- 12.1.1 CSBP
- 12.1.1.1. Company Overview
- 12.1.1.2. Products
- 12.1.1.3. Company Financials
- 12.1.1.4. SWOT Analysis
- 12.1.2 Chambal Fertilisers and Chemicals Limited
- 12.1.2.1. Company Overview
- 12.1.2.2. Products
- 12.1.2.3. Company Financials
- 12.1.2.4. SWOT Analysis
- 12.1.3 Qatar Fertiliser Company (QAFCO)
- 12.1.3.1. Company Overview
- 12.1.3.2. Products
- 12.1.3.3. Company Financials
- 12.1.3.4. SWOT Analysis
- 12.1.4 PT Pupuk Sriwidjaja Palembang (Pusri)
- 12.1.4.1. Company Overview
- 12.1.4.2. Products
- 12.1.4.3. Company Financials
- 12.1.4.4. SWOT Analysis
- 12.1.5 BASF SE
- 12.1.5.1. Company Overview
- 12.1.5.2. Products
- 12.1.5.3. Company Financials
- 12.1.5.4. SWOT Analysis
- 12.1.6 OCI
- 12.1.6.1. Company Overview
- 12.1.6.2. Products
- 12.1.6.3. Company Financials
- 12.1.6.4. SWOT Analysis
- 12.1.7 Group DF (Ostchem)
- 12.1.7.1. Company Overview
- 12.1.7.2. Products
- 12.1.7.3. Company Financials
- 12.1.7.4. SWOT Analysis
- 12.1.8 SABIC
- 12.1.8.1. Company Overview
- 12.1.8.2. Products
- 12.1.8.3. Company Financials
- 12.1.8.4. SWOT Analysis
- 12.1.9 Eurochem Group
- 12.1.9.1. Company Overview
- 12.1.9.2. Products
- 12.1.9.3. Company Financials
- 12.1.9.4. SWOT Analysis
- 12.1.10 Koch Fertilizer LLC
- 12.1.10.1. Company Overview
- 12.1.10.2. Products
- 12.1.10.3. Company Financials
- 12.1.10.4. SWOT Analysis
- 12.1.11 Rashtriya Chemicals And Fertilizers Limited
- 12.1.11.1. Company Overview
- 12.1.11.2. Products
- 12.1.11.3. Company Financials
- 12.1.11.4. SWOT Analysis
- 12.1.12 CF Industries Holdings Inc
- 12.1.12.1. Company Overview
- 12.1.12.2. Products
- 12.1.12.3. Company Financials
- 12.1.12.4. SWOT Analysis
- 12.1.13 IFFCO
- 12.1.13.1. Company Overview
- 12.1.13.2. Products
- 12.1.13.3. Company Financials
- 12.1.13.4. SWOT Analysis
- 12.1.14 Jsc Togliattiazot
- 12.1.14.1. Company Overview
- 12.1.14.2. Products
- 12.1.14.3. Company Financials
- 12.1.14.4. SWOT Analysis
- 12.1.15 Nutrien Ltd
- 12.1.15.1. Company Overview
- 12.1.15.2. Products
- 12.1.15.3. Company Financials
- 12.1.15.4. SWOT Analysis
- 12.1.16 Yara*List Not Exhaustive
- 12.1.16.1. Company Overview
- 12.1.16.2. Products
- 12.1.16.3. Company Financials
- 12.1.16.4. SWOT Analysis
- 12.1.1 CSBP
- 12.2. Market Entropy
- 12.2.1 Company's Key Areas Served
- 12.2.2 Recent Developments
- 12.3. Company Market Share Analysis 2025
- 12.3.1 Top 5 Companies Market Share Analysis
- 12.3.2 Top 3 Companies Market Share Analysis
- 12.4. List of Potential Customers
- 13. Research Methodology
List of Figures
- Figure 1: Global Ammonia Market Revenue Breakdown (million, %) by Region 2025 & 2033
- Figure 2: Global Ammonia Market Volume Breakdown (Million, %) by Region 2025 & 2033
- Figure 3: Asia Pacific Ammonia Market Revenue (million), by Type 2025 & 2033
- Figure 4: Asia Pacific Ammonia Market Volume (Million), by Type 2025 & 2033
- Figure 5: Asia Pacific Ammonia Market Revenue Share (%), by Type 2025 & 2033
- Figure 6: Asia Pacific Ammonia Market Volume Share (%), by Type 2025 & 2033
- Figure 7: Asia Pacific Ammonia Market Revenue (million), by End-user Industry 2025 & 2033
- Figure 8: Asia Pacific Ammonia Market Volume (Million), by End-user Industry 2025 & 2033
- Figure 9: Asia Pacific Ammonia Market Revenue Share (%), by End-user Industry 2025 & 2033
- Figure 10: Asia Pacific Ammonia Market Volume Share (%), by End-user Industry 2025 & 2033
- Figure 11: Asia Pacific Ammonia Market Revenue (million), by Country 2025 & 2033
- Figure 12: Asia Pacific Ammonia Market Volume (Million), by Country 2025 & 2033
- Figure 13: Asia Pacific Ammonia Market Revenue Share (%), by Country 2025 & 2033
- Figure 14: Asia Pacific Ammonia Market Volume Share (%), by Country 2025 & 2033
- Figure 15: North America Ammonia Market Revenue (million), by Type 2025 & 2033
- Figure 16: North America Ammonia Market Volume (Million), by Type 2025 & 2033
- Figure 17: North America Ammonia Market Revenue Share (%), by Type 2025 & 2033
- Figure 18: North America Ammonia Market Volume Share (%), by Type 2025 & 2033
- Figure 19: North America Ammonia Market Revenue (million), by End-user Industry 2025 & 2033
- Figure 20: North America Ammonia Market Volume (Million), by End-user Industry 2025 & 2033
- Figure 21: North America Ammonia Market Revenue Share (%), by End-user Industry 2025 & 2033
- Figure 22: North America Ammonia Market Volume Share (%), by End-user Industry 2025 & 2033
- Figure 23: North America Ammonia Market Revenue (million), by Country 2025 & 2033
- Figure 24: North America Ammonia Market Volume (Million), by Country 2025 & 2033
- Figure 25: North America Ammonia Market Revenue Share (%), by Country 2025 & 2033
- Figure 26: North America Ammonia Market Volume Share (%), by Country 2025 & 2033
- Figure 27: Europe Ammonia Market Revenue (million), by Type 2025 & 2033
- Figure 28: Europe Ammonia Market Volume (Million), by Type 2025 & 2033
- Figure 29: Europe Ammonia Market Revenue Share (%), by Type 2025 & 2033
- Figure 30: Europe Ammonia Market Volume Share (%), by Type 2025 & 2033
- Figure 31: Europe Ammonia Market Revenue (million), by End-user Industry 2025 & 2033
- Figure 32: Europe Ammonia Market Volume (Million), by End-user Industry 2025 & 2033
- Figure 33: Europe Ammonia Market Revenue Share (%), by End-user Industry 2025 & 2033
- Figure 34: Europe Ammonia Market Volume Share (%), by End-user Industry 2025 & 2033
- Figure 35: Europe Ammonia Market Revenue (million), by Country 2025 & 2033
- Figure 36: Europe Ammonia Market Volume (Million), by Country 2025 & 2033
- Figure 37: Europe Ammonia Market Revenue Share (%), by Country 2025 & 2033
- Figure 38: Europe Ammonia Market Volume Share (%), by Country 2025 & 2033
- Figure 39: South America Ammonia Market Revenue (million), by Type 2025 & 2033
- Figure 40: South America Ammonia Market Volume (Million), by Type 2025 & 2033
- Figure 41: South America Ammonia Market Revenue Share (%), by Type 2025 & 2033
- Figure 42: South America Ammonia Market Volume Share (%), by Type 2025 & 2033
- Figure 43: South America Ammonia Market Revenue (million), by End-user Industry 2025 & 2033
- Figure 44: South America Ammonia Market Volume (Million), by End-user Industry 2025 & 2033
- Figure 45: South America Ammonia Market Revenue Share (%), by End-user Industry 2025 & 2033
- Figure 46: South America Ammonia Market Volume Share (%), by End-user Industry 2025 & 2033
- Figure 47: South America Ammonia Market Revenue (million), by Country 2025 & 2033
- Figure 48: South America Ammonia Market Volume (Million), by Country 2025 & 2033
- Figure 49: South America Ammonia Market Revenue Share (%), by Country 2025 & 2033
- Figure 50: South America Ammonia Market Volume Share (%), by Country 2025 & 2033
- Figure 51: Middle East and Africa Ammonia Market Revenue (million), by Type 2025 & 2033
- Figure 52: Middle East and Africa Ammonia Market Volume (Million), by Type 2025 & 2033
- Figure 53: Middle East and Africa Ammonia Market Revenue Share (%), by Type 2025 & 2033
- Figure 54: Middle East and Africa Ammonia Market Volume Share (%), by Type 2025 & 2033
- Figure 55: Middle East and Africa Ammonia Market Revenue (million), by End-user Industry 2025 & 2033
- Figure 56: Middle East and Africa Ammonia Market Volume (Million), by End-user Industry 2025 & 2033
- Figure 57: Middle East and Africa Ammonia Market Revenue Share (%), by End-user Industry 2025 & 2033
- Figure 58: Middle East and Africa Ammonia Market Volume Share (%), by End-user Industry 2025 & 2033
- Figure 59: Middle East and Africa Ammonia Market Revenue (million), by Country 2025 & 2033
- Figure 60: Middle East and Africa Ammonia Market Volume (Million), by Country 2025 & 2033
- Figure 61: Middle East and Africa Ammonia Market Revenue Share (%), by Country 2025 & 2033
- Figure 62: Middle East and Africa Ammonia Market Volume Share (%), by Country 2025 & 2033
List of Tables
- Table 1: Global Ammonia Market Revenue million Forecast, by Type 2020 & 2033
- Table 2: Global Ammonia Market Volume Million Forecast, by Type 2020 & 2033
- Table 3: Global Ammonia Market Revenue million Forecast, by End-user Industry 2020 & 2033
- Table 4: Global Ammonia Market Volume Million Forecast, by End-user Industry 2020 & 2033
- Table 5: Global Ammonia Market Revenue million Forecast, by Region 2020 & 2033
- Table 6: Global Ammonia Market Volume Million Forecast, by Region 2020 & 2033
- Table 7: Global Ammonia Market Revenue million Forecast, by Type 2020 & 2033
- Table 8: Global Ammonia Market Volume Million Forecast, by Type 2020 & 2033
- Table 9: Global Ammonia Market Revenue million Forecast, by End-user Industry 2020 & 2033
- Table 10: Global Ammonia Market Volume Million Forecast, by End-user Industry 2020 & 2033
- Table 11: Global Ammonia Market Revenue million Forecast, by Country 2020 & 2033
- Table 12: Global Ammonia Market Volume Million Forecast, by Country 2020 & 2033
- Table 13: China Ammonia Market Revenue (million) Forecast, by Application 2020 & 2033
- Table 14: China Ammonia Market Volume (Million) Forecast, by Application 2020 & 2033
- Table 15: India Ammonia Market Revenue (million) Forecast, by Application 2020 & 2033
- Table 16: India Ammonia Market Volume (Million) Forecast, by Application 2020 & 2033
- Table 17: Japan Ammonia Market Revenue (million) Forecast, by Application 2020 & 2033
- Table 18: Japan Ammonia Market Volume (Million) Forecast, by Application 2020 & 2033
- Table 19: South Korea Ammonia Market Revenue (million) Forecast, by Application 2020 & 2033
- Table 20: South Korea Ammonia Market Volume (Million) Forecast, by Application 2020 & 2033
- Table 21: Rest of Asia Pacific Ammonia Market Revenue (million) Forecast, by Application 2020 & 2033
- Table 22: Rest of Asia Pacific Ammonia Market Volume (Million) Forecast, by Application 2020 & 2033
- Table 23: Global Ammonia Market Revenue million Forecast, by Type 2020 & 2033
- Table 24: Global Ammonia Market Volume Million Forecast, by Type 2020 & 2033
- Table 25: Global Ammonia Market Revenue million Forecast, by End-user Industry 2020 & 2033
- Table 26: Global Ammonia Market Volume Million Forecast, by End-user Industry 2020 & 2033
- Table 27: Global Ammonia Market Revenue million Forecast, by Country 2020 & 2033
- Table 28: Global Ammonia Market Volume Million Forecast, by Country 2020 & 2033
- Table 29: United States Ammonia Market Revenue (million) Forecast, by Application 2020 & 2033
- Table 30: United States Ammonia Market Volume (Million) Forecast, by Application 2020 & 2033
- Table 31: Canada Ammonia Market Revenue (million) Forecast, by Application 2020 & 2033
- Table 32: Canada Ammonia Market Volume (Million) Forecast, by Application 2020 & 2033
- Table 33: Mexico Ammonia Market Revenue (million) Forecast, by Application 2020 & 2033
- Table 34: Mexico Ammonia Market Volume (Million) Forecast, by Application 2020 & 2033
- Table 35: Global Ammonia Market Revenue million Forecast, by Type 2020 & 2033
- Table 36: Global Ammonia Market Volume Million Forecast, by Type 2020 & 2033
- Table 37: Global Ammonia Market Revenue million Forecast, by End-user Industry 2020 & 2033
- Table 38: Global Ammonia Market Volume Million Forecast, by End-user Industry 2020 & 2033
- Table 39: Global Ammonia Market Revenue million Forecast, by Country 2020 & 2033
- Table 40: Global Ammonia Market Volume Million Forecast, by Country 2020 & 2033
- Table 41: Germany Ammonia Market Revenue (million) Forecast, by Application 2020 & 2033
- Table 42: Germany Ammonia Market Volume (Million) Forecast, by Application 2020 & 2033
- Table 43: United Kingdom Ammonia Market Revenue (million) Forecast, by Application 2020 & 2033
- Table 44: United Kingdom Ammonia Market Volume (Million) Forecast, by Application 2020 & 2033
- Table 45: France Ammonia Market Revenue (million) Forecast, by Application 2020 & 2033
- Table 46: France Ammonia Market Volume (Million) Forecast, by Application 2020 & 2033
- Table 47: Italy Ammonia Market Revenue (million) Forecast, by Application 2020 & 2033
- Table 48: Italy Ammonia Market Volume (Million) Forecast, by Application 2020 & 2033
- Table 49: Rest of Europe Ammonia Market Revenue (million) Forecast, by Application 2020 & 2033
- Table 50: Rest of Europe Ammonia Market Volume (Million) Forecast, by Application 2020 & 2033
- Table 51: Global Ammonia Market Revenue million Forecast, by Type 2020 & 2033
- Table 52: Global Ammonia Market Volume Million Forecast, by Type 2020 & 2033
- Table 53: Global Ammonia Market Revenue million Forecast, by End-user Industry 2020 & 2033
- Table 54: Global Ammonia Market Volume Million Forecast, by End-user Industry 2020 & 2033
- Table 55: Global Ammonia Market Revenue million Forecast, by Country 2020 & 2033
- Table 56: Global Ammonia Market Volume Million Forecast, by Country 2020 & 2033
- Table 57: Brazil Ammonia Market Revenue (million) Forecast, by Application 2020 & 2033
- Table 58: Brazil Ammonia Market Volume (Million) Forecast, by Application 2020 & 2033
- Table 59: Argentina Ammonia Market Revenue (million) Forecast, by Application 2020 & 2033
- Table 60: Argentina Ammonia Market Volume (Million) Forecast, by Application 2020 & 2033
- Table 61: Rest of South America Ammonia Market Revenue (million) Forecast, by Application 2020 & 2033
- Table 62: Rest of South America Ammonia Market Volume (Million) Forecast, by Application 2020 & 2033
- Table 63: Global Ammonia Market Revenue million Forecast, by Type 2020 & 2033
- Table 64: Global Ammonia Market Volume Million Forecast, by Type 2020 & 2033
- Table 65: Global Ammonia Market Revenue million Forecast, by End-user Industry 2020 & 2033
- Table 66: Global Ammonia Market Volume Million Forecast, by End-user Industry 2020 & 2033
- Table 67: Global Ammonia Market Revenue million Forecast, by Country 2020 & 2033
- Table 68: Global Ammonia Market Volume Million Forecast, by Country 2020 & 2033
- Table 69: Saudi Arabia Ammonia Market Revenue (million) Forecast, by Application 2020 & 2033
- Table 70: Saudi Arabia Ammonia Market Volume (Million) Forecast, by Application 2020 & 2033
- Table 71: South Africa Ammonia Market Revenue (million) Forecast, by Application 2020 & 2033
- Table 72: South Africa Ammonia Market Volume (Million) Forecast, by Application 2020 & 2033
- Table 73: Rest of Middle East and Africa Ammonia Market Revenue (million) Forecast, by Application 2020 & 2033
- Table 74: Rest of Middle East and Africa Ammonia Market Volume (Million) Forecast, by Application 2020 & 2033
Frequently Asked Questions
1. What is the projected Compound Annual Growth Rate (CAGR) of the Ammonia Market?
The projected CAGR is approximately 1.2%.
2. Which companies are prominent players in the Ammonia Market?
Key companies in the market include CSBP, Chambal Fertilisers and Chemicals Limited, Qatar Fertiliser Company (QAFCO), PT Pupuk Sriwidjaja Palembang (Pusri), BASF SE, OCI, Group DF (Ostchem), SABIC, Eurochem Group, Koch Fertilizer LLC, Rashtriya Chemicals And Fertilizers Limited, CF Industries Holdings Inc, IFFCO, Jsc Togliattiazot, Nutrien Ltd, Yara*List Not Exhaustive.
3. What are the main segments of the Ammonia Market?
The market segments include Type, End-user Industry.
4. Can you provide details about the market size?
The market size is estimated to be USD 68840 million as of 2022.
5. What are some drivers contributing to market growth?
Abundant Use in the Fertilizer Industry; Increasing Usage to Produce Explosives.
6. What are the notable trends driving market growth?
The Agriculture Industry is Expected to Dominate the Market.
7. Are there any restraints impacting market growth?
Hazardous Effects in its Concentrated Form.
8. Can you provide examples of recent developments in the market?
March 2024: Yara collaborated with GHC SAOC, a wholly-owned subsidiary of Acme Cleantech. Under this collaboration, ACME will provide YARA with ammonia with reduced CO2 emissions. This collaboration covers the supply of 100,000 tons per annum of renewable ammonia.
9. What pricing options are available for accessing the report?
Pricing options include single-user, multi-user, and enterprise licenses priced at USD 4750, USD 5250, and USD 8750 respectively.
10. Is the market size provided in terms of value or volume?
The market size is provided in terms of value, measured in million and volume, measured in Million.
11. Are there any specific market keywords associated with the report?
Yes, the market keyword associated with the report is "Ammonia Market," which aids in identifying and referencing the specific market segment covered.
12. How do I determine which pricing option suits my needs best?
The pricing options vary based on user requirements and access needs. Individual users may opt for single-user licenses, while businesses requiring broader access may choose multi-user or enterprise licenses for cost-effective access to the report.
13. Are there any additional resources or data provided in the Ammonia Market report?
While the report offers comprehensive insights, it's advisable to review the specific contents or supplementary materials provided to ascertain if additional resources or data are available.
14. How can I stay updated on further developments or reports in the Ammonia Market?
To stay informed about further developments, trends, and reports in the Ammonia Market, consider subscribing to industry newsletters, following relevant companies and organizations, or regularly checking reputable industry news sources and publications.
Methodology
Step 1 - Identification of Relevant Samples Size from Population Database


Step 2 - Approaches for Defining Global Market Size (Value, Volume* & Price*)

Note*: In applicable scenarios
Step 3 - Data Sources
Primary Research
- Web Analytics
- Survey Reports
- Research Institute
- Latest Research Reports
- Opinion Leaders
Secondary Research
- Annual Reports
- White Paper
- Latest Press Release
- Industry Association
- Paid Database
- Investor Presentations

Step 4 - Data Triangulation
Involves using different sources of information in order to increase the validity of a study
These sources are likely to be stakeholders in a program - participants, other researchers, program staff, other community members, and so on.
Then we put all data in single framework & apply various statistical tools to find out the dynamic on the market.
During the analysis stage, feedback from the stakeholder groups would be compared to determine areas of agreement as well as areas of divergence