

Key Insights
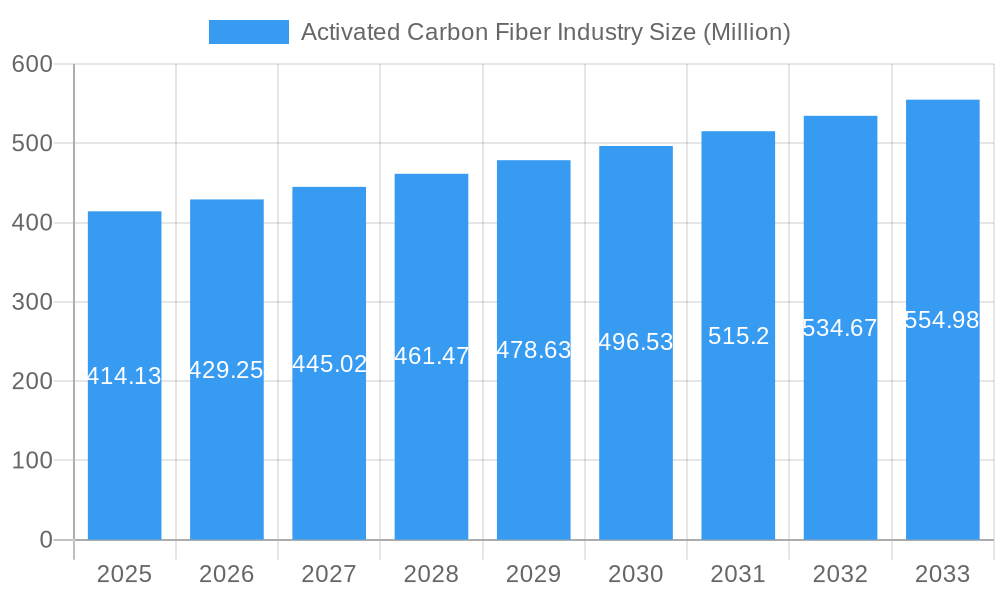
The global activated carbon fiber (ACF) market, valued at $414.13 million in 2025, is projected to experience steady growth, driven by increasing demand across diverse sectors. A compound annual growth rate (CAGR) of 3.71% from 2025 to 2033 indicates a significant market expansion. Key drivers include the burgeoning energy storage sector, particularly supercapacitors, which leverage ACF's high surface area and excellent electrochemical properties. The rising adoption of ACF in water purification and chemical separation applications also contributes significantly to market growth. Furthermore, growth in the medical and protective clothing industries, where ACF offers unique filtration and protective capabilities, is fueling market expansion. While the market faces some restraints, such as the relatively high cost of ACF production compared to alternative materials and potential supply chain disruptions, these are expected to be mitigated by ongoing technological advancements and increasing economies of scale. The market is segmented by raw material (natural and synthetic) and application (purification, chemical separation and catalysis, protective clothing, medical, supercapacitors, and other applications). Major players, including Jiangsu Tongkang, Kuraray, and Toyobo, are driving innovation and expanding their market presence through strategic partnerships and technological advancements. The Asia-Pacific region, particularly China and Japan, holds a dominant market share, reflecting the region's strong manufacturing base and growing industrial activity. North America and Europe are also significant markets, with growing demand driven by stringent environmental regulations and increasing focus on sustainable technologies.
Activated Carbon Fiber Industry Market Size (In Million)
The forecast period (2025-2033) anticipates continued growth, with the market size likely exceeding $550 million by 2033. This growth will be influenced by several factors, including government initiatives promoting renewable energy and environmental protection, advancements in ACF production techniques leading to cost reductions, and exploration of novel applications in emerging technologies. Competition among existing players and the emergence of new entrants are expected to intensify, further driving innovation and market expansion. Strategic acquisitions, joint ventures, and capacity expansions are likely to shape the competitive landscape in the coming years. The market's future trajectory will be largely determined by the ongoing evolution of technological advancements, shifting consumer preferences towards sustainable solutions, and the overall economic climate.
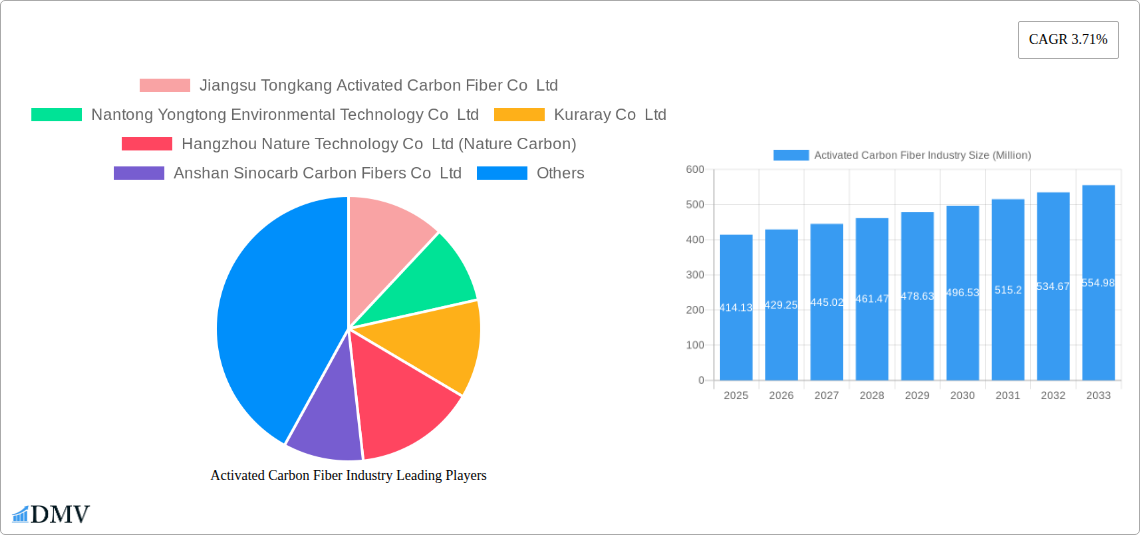
Activated Carbon Fiber Industry Company Market Share
Activated Carbon Fiber Industry: A Comprehensive Market Report (2019-2033)
This insightful report provides a detailed analysis of the global Activated Carbon Fiber (ACF) industry, offering a comprehensive overview of market trends, competitive landscape, and future growth prospects. Covering the period from 2019 to 2033, with a base year of 2025 and a forecast period of 2025-2033, this report is an essential resource for stakeholders seeking to understand and capitalize on opportunities within this dynamic sector. The market size in 2025 is estimated at xx Million, poised for significant expansion in the coming years.
Activated Carbon Fiber Industry Market Composition & Trends
This section delves into the intricacies of the ACF market, examining its concentration, innovation drivers, regulatory environment, substitute products, end-user demographics, and mergers & acquisitions (M&A) activity. We analyze market share distribution among key players, including Jiangsu Tongkang Activated Carbon Fiber Co Ltd, Nantong Yongtong Environmental Technology Co Ltd, Kuraray Co Ltd, Hangzhou Nature Technology Co Ltd (Nature Carbon), Anshan Sinocarb Carbon Fibers Co Ltd, Unitika LTD, China Beihai Fiberglass Co Ltd, Toyobo Co Ltd, Osaka Gas Chemicals Co Ltd, Evertech Envisafe Ecology Co Ltd, and HPMS Graphite. The report quantifies market share for each major player and assesses the overall market concentration, revealing the presence of both large multinational corporations and smaller, specialized firms.
- Market Concentration: The ACF market exhibits a moderately concentrated structure, with the top 5 players holding an estimated xx% market share in 2025.
- Innovation Catalysts: Research and development efforts focused on enhancing ACF properties (e.g., surface area, pore size distribution) drive innovation.
- Regulatory Landscape: Environmental regulations concerning water and air purification are significant drivers of ACF adoption.
- Substitute Products: Other filtration technologies, such as membrane filtration, pose competitive pressure.
- End-User Profiles: Key end-users include the chemical, environmental, and energy sectors, with growing adoption in the medical and protective clothing industries.
- M&A Activity: The report analyzes recent M&A deals, estimating their total value at xx Million in the period 2019-2024, highlighting strategic acquisitions to enhance market share and technological capabilities.
Activated Carbon Fiber Industry Industry Evolution
This section provides a comprehensive analysis of the ACF industry's growth trajectory, technological advancements, and evolving consumer demands from 2019 to 2024. We examine historical growth rates and project future expansion, considering factors such as technological innovations, regulatory changes, and shifting end-user needs. The report details the adoption of new ACF types and their impact on market segments. We project a Compound Annual Growth Rate (CAGR) of xx% for the ACF market during the forecast period (2025-2033), driven by increasing demand across various applications, technological advancements leading to improved performance and cost-effectiveness, and the stringent environmental regulations worldwide. Specific data points regarding market size, growth rates, and technological adoption rates will be provided within the report.
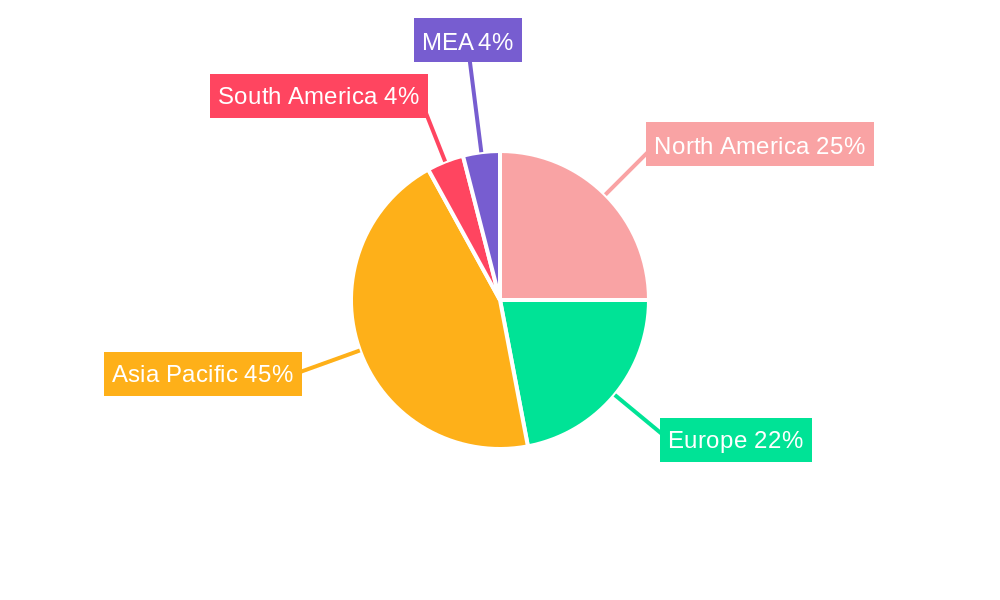
Leading Regions, Countries, or Segments in Activated Carbon Fiber Industry
This section identifies the leading regions, countries, and segments within the ACF market, offering a detailed breakdown of their dominance factors.
Key Drivers:
- Asia-Pacific Dominance: The Asia-Pacific region is projected to hold the largest market share, driven by rapid industrialization, increasing environmental concerns, and supportive government policies. China, specifically, is expected to be a major contributor to this growth.
- North America's Steady Growth: North America will also witness notable growth, fueled by increasing demand in the water purification and chemical processing sectors.
- European Market Dynamics: Europe is expected to demonstrate steady growth, driven by stringent environmental regulations and the expanding application in various industrial processes.
- Raw Material: Synthetic ACF is projected to gain market share due to its superior performance characteristics, despite the higher production costs compared to natural ACF.
- Application: The purification segment, encompassing water and air purification, is anticipated to dominate the ACF market, followed by the chemical separation and catalysis application segment. Significant growth is also projected in medical and supercapacitor applications.
Dominance Factors: Detailed analysis will be provided, outlining the specific factors that contribute to the dominance of each leading region, country, and segment, including investment trends, government regulations, technological advancements, and consumer preferences.
Activated Carbon Fiber Industry Product Innovations
Recent years have witnessed significant innovations in ACF technology, leading to the development of advanced materials with enhanced performance characteristics. These innovations include the development of ACFs with tailored pore structures, surface chemistries, and enhanced mechanical properties, expanding the applications of ACFs into high-value markets. For instance, the development of high-surface-area ACFs has significantly improved the efficiency of water purification systems, leading to reduced operational costs and improved water quality. These technological advancements improve selectivity, efficiency, and cost-effectiveness.
Propelling Factors for Activated Carbon Fiber Industry Growth
The growth of the ACF industry is propelled by several key factors:
- Stringent Environmental Regulations: Growing environmental concerns and stringent regulations worldwide are driving demand for ACF-based filtration and purification systems.
- Technological Advancements: Innovations in ACF production processes are leading to lower costs and enhanced material properties.
- Expanding Applications: The versatility of ACFs has led to their adoption in a wide range of applications, including energy storage, catalysis, and protective clothing.
- Rising Disposable Incomes: Increasing disposable incomes in developing economies contribute to higher demand for consumer goods and services requiring ACF-based technologies.
Obstacles in the Activated Carbon Fiber Industry Market
Despite the favorable growth outlook, the ACF market faces certain challenges:
- Supply Chain Disruptions: Geopolitical instability and unexpected events can disrupt the supply of raw materials, impacting production and pricing.
- Competitive Pressures: Competition from alternative filtration technologies necessitates continuous innovation and cost optimization.
- Regulatory Hurdles: Varying regulations across different regions can complicate market entry and expansion.
- High Production Costs: The production of high-quality ACF can be expensive, limiting its widespread adoption in certain applications.
Future Opportunities in Activated Carbon Fiber Industry
The ACF market presents several promising future opportunities:
- Expanding into Emerging Markets: Untapped markets in developing economies offer significant growth potential.
- New Applications in Energy Storage: ACF's potential in next-generation energy storage technologies is a major growth driver.
- Advanced Materials Development: Ongoing research and development will lead to new ACF-based materials with superior performance characteristics.
- Sustainability Focus: Growing emphasis on environmentally sustainable solutions boosts demand for ACF-based technologies.
Major Players in the Activated Carbon Fiber Industry Ecosystem
- Jiangsu Tongkang Activated Carbon Fiber Co Ltd
- Nantong Yongtong Environmental Technology Co Ltd
- Kuraray Co Ltd
- Hangzhou Nature Technology Co Ltd (Nature Carbon)
- Anshan Sinocarb Carbon Fibers Co Ltd
- Unitika LTD
- China Beihai Fiberglass Co Ltd
- Toyobo Co Ltd
- Osaka Gas Chemicals Co Ltd
- Evertech Envisafe Ecology Co Ltd
- HPMS Graphite
Key Developments in Activated Carbon Fiber Industry Industry
- 2023-03: Kuraray Co Ltd announced a significant expansion of its ACF production capacity.
- 2022-11: Jiangsu Tongkang Activated Carbon Fiber Co Ltd launched a new line of high-performance ACF for water purification applications.
- 2021-09: A major M&A deal involving two key players reshaped the competitive landscape. (Specific details to be included in full report)
- Further key developments to be added.
Strategic Activated Carbon Fiber Industry Market Forecast
The ACF market is poised for significant growth in the coming years, driven by increasing demand across diverse applications, technological advancements, and supportive government policies. The market is expected to experience substantial expansion, with continued innovation in material properties and production techniques. New applications and market penetration in developing economies will further fuel this growth, leading to significant market potential throughout the forecast period (2025-2033).
Activated Carbon Fiber Industry Segmentation
-
1. Raw Material
- 1.1. Natural
-
1.2. Synthetic
- 1.2.1. Pitch-based
- 1.2.2. Pan-based
- 1.2.3. Phenolic-based
- 1.2.4. Viscose-based
- 1.2.5. Other Materials
-
2. Application
- 2.1. Purification
- 2.2. Chemical Separation and Catalysis
- 2.3. Protective Clothing
- 2.4. Medical
- 2.5. Super Capacitors
- 2.6. Other Applications
Activated Carbon Fiber Industry Segmentation By Geography
-
1. Asia Pacific
- 1.1. China
- 1.2. India
- 1.3. Japan
- 1.4. South Korea
- 1.5. Rest of Asia Pacific
-
2. North America
- 2.1. United States
- 2.2. Mexico
- 2.3. Canada
-
3. Europe
- 3.1. Germany
- 3.2. United Kingdom
- 3.3. France
- 3.4. Italy
- 3.5. Rest of Europe
- 4. Middle East
-
5. Saudi Arabia
- 5.1. South Africa
- 5.2. Rest of Middle East
Activated Carbon Fiber Industry Regional Market Share
Geographic Coverage of Activated Carbon Fiber Industry
Activated Carbon Fiber Industry REPORT HIGHLIGHTS
| Aspects | Details |
|---|---|
| Study Period | 2020-2034 |
| Base Year | 2025 |
| Estimated Year | 2026 |
| Forecast Period | 2026-2034 |
| Historical Period | 2020-2025 |
| Growth Rate | CAGR of 3.71% from 2020-2034 |
| Segmentation |
|
Table of Contents
- 1. Introduction
- 1.1. Research Scope
- 1.2. Market Segmentation
- 1.3. Research Objective
- 1.4. Definitions and Assumptions
- 2. Executive Summary
- 2.1. Market Snapshot
- 3. Market Dynamics
- 3.1. Market Drivers
- 3.2. Market Restrains
- 3.3. Market Trends
- 3.4. Market Opportunities
- 4. Market Factor Analysis
- 4.1. Porters Five Forces
- 4.1.1. Bargaining Power of Suppliers
- 4.1.2. Bargaining Power of Buyers
- 4.1.3. Threat of New Entrants
- 4.1.4. Threat of Substitutes
- 4.1.5. Competitive Rivalry
- 4.2. PESTEL analysis
- 4.3. BCG Analysis
- 4.3.1. Stars (High Growth, High Market Share)
- 4.3.2. Cash Cows (Low Growth, High Market Share)
- 4.3.3. Question Mark (High Growth, Low Market Share)
- 4.3.4. Dogs (Low Growth, Low Market Share)
- 4.4. Ansoff Matrix Analysis
- 4.5. Supply Chain Analysis
- 4.6. Regulatory Landscape
- 4.7. Current Market Potential and Opportunity Assessment (TAM–SAM–SOM Framework)
- 4.8. DMV Analyst Note
- 4.1. Porters Five Forces
- 5. Market Analysis, Insights and Forecast 2021-2033
- 5.1. Market Analysis, Insights and Forecast - by Raw Material
- 5.1.1. Natural
- 5.1.2. Synthetic
- 5.1.2.1. Pitch-based
- 5.1.2.2. Pan-based
- 5.1.2.3. Phenolic-based
- 5.1.2.4. Viscose-based
- 5.1.2.5. Other Materials
- 5.2. Market Analysis, Insights and Forecast - by Application
- 5.2.1. Purification
- 5.2.2. Chemical Separation and Catalysis
- 5.2.3. Protective Clothing
- 5.2.4. Medical
- 5.2.5. Super Capacitors
- 5.2.6. Other Applications
- 5.3. Market Analysis, Insights and Forecast - by Region
- 5.3.1. Asia Pacific
- 5.3.2. North America
- 5.3.3. Europe
- 5.3.4. Middle East
- 5.3.5. Saudi Arabia
- 5.1. Market Analysis, Insights and Forecast - by Raw Material
- 6. Global Activated Carbon Fiber Industry Analysis, Insights and Forecast, 2021-2033
- 6.1. Market Analysis, Insights and Forecast - by Raw Material
- 6.1.1. Natural
- 6.1.2. Synthetic
- 6.1.2.1. Pitch-based
- 6.1.2.2. Pan-based
- 6.1.2.3. Phenolic-based
- 6.1.2.4. Viscose-based
- 6.1.2.5. Other Materials
- 6.2. Market Analysis, Insights and Forecast - by Application
- 6.2.1. Purification
- 6.2.2. Chemical Separation and Catalysis
- 6.2.3. Protective Clothing
- 6.2.4. Medical
- 6.2.5. Super Capacitors
- 6.2.6. Other Applications
- 6.1. Market Analysis, Insights and Forecast - by Raw Material
- 7. Asia Pacific Activated Carbon Fiber Industry Analysis, Insights and Forecast, 2020-2032
- 7.1. Market Analysis, Insights and Forecast - by Raw Material
- 7.1.1. Natural
- 7.1.2. Synthetic
- 7.1.2.1. Pitch-based
- 7.1.2.2. Pan-based
- 7.1.2.3. Phenolic-based
- 7.1.2.4. Viscose-based
- 7.1.2.5. Other Materials
- 7.2. Market Analysis, Insights and Forecast - by Application
- 7.2.1. Purification
- 7.2.2. Chemical Separation and Catalysis
- 7.2.3. Protective Clothing
- 7.2.4. Medical
- 7.2.5. Super Capacitors
- 7.2.6. Other Applications
- 7.1. Market Analysis, Insights and Forecast - by Raw Material
- 8. North America Activated Carbon Fiber Industry Analysis, Insights and Forecast, 2020-2032
- 8.1. Market Analysis, Insights and Forecast - by Raw Material
- 8.1.1. Natural
- 8.1.2. Synthetic
- 8.1.2.1. Pitch-based
- 8.1.2.2. Pan-based
- 8.1.2.3. Phenolic-based
- 8.1.2.4. Viscose-based
- 8.1.2.5. Other Materials
- 8.2. Market Analysis, Insights and Forecast - by Application
- 8.2.1. Purification
- 8.2.2. Chemical Separation and Catalysis
- 8.2.3. Protective Clothing
- 8.2.4. Medical
- 8.2.5. Super Capacitors
- 8.2.6. Other Applications
- 8.1. Market Analysis, Insights and Forecast - by Raw Material
- 9. Europe Activated Carbon Fiber Industry Analysis, Insights and Forecast, 2020-2032
- 9.1. Market Analysis, Insights and Forecast - by Raw Material
- 9.1.1. Natural
- 9.1.2. Synthetic
- 9.1.2.1. Pitch-based
- 9.1.2.2. Pan-based
- 9.1.2.3. Phenolic-based
- 9.1.2.4. Viscose-based
- 9.1.2.5. Other Materials
- 9.2. Market Analysis, Insights and Forecast - by Application
- 9.2.1. Purification
- 9.2.2. Chemical Separation and Catalysis
- 9.2.3. Protective Clothing
- 9.2.4. Medical
- 9.2.5. Super Capacitors
- 9.2.6. Other Applications
- 9.1. Market Analysis, Insights and Forecast - by Raw Material
- 10. Middle East Activated Carbon Fiber Industry Analysis, Insights and Forecast, 2020-2032
- 10.1. Market Analysis, Insights and Forecast - by Raw Material
- 10.1.1. Natural
- 10.1.2. Synthetic
- 10.1.2.1. Pitch-based
- 10.1.2.2. Pan-based
- 10.1.2.3. Phenolic-based
- 10.1.2.4. Viscose-based
- 10.1.2.5. Other Materials
- 10.2. Market Analysis, Insights and Forecast - by Application
- 10.2.1. Purification
- 10.2.2. Chemical Separation and Catalysis
- 10.2.3. Protective Clothing
- 10.2.4. Medical
- 10.2.5. Super Capacitors
- 10.2.6. Other Applications
- 10.1. Market Analysis, Insights and Forecast - by Raw Material
- 11. Saudi Arabia Activated Carbon Fiber Industry Analysis, Insights and Forecast, 2020-2032
- 11.1. Market Analysis, Insights and Forecast - by Raw Material
- 11.1.1. Natural
- 11.1.2. Synthetic
- 11.1.2.1. Pitch-based
- 11.1.2.2. Pan-based
- 11.1.2.3. Phenolic-based
- 11.1.2.4. Viscose-based
- 11.1.2.5. Other Materials
- 11.2. Market Analysis, Insights and Forecast - by Application
- 11.2.1. Purification
- 11.2.2. Chemical Separation and Catalysis
- 11.2.3. Protective Clothing
- 11.2.4. Medical
- 11.2.5. Super Capacitors
- 11.2.6. Other Applications
- 11.1. Market Analysis, Insights and Forecast - by Raw Material
- 12. Competitive Analysis
- 12.1. Company Profiles
- 12.1.1 Jiangsu Tongkang Activated Carbon Fiber Co Ltd
- 12.1.1.1. Company Overview
- 12.1.1.2. Products
- 12.1.1.3. Company Financials
- 12.1.1.4. SWOT Analysis
- 12.1.2 Nantong Yongtong Environmental Technology Co Ltd
- 12.1.2.1. Company Overview
- 12.1.2.2. Products
- 12.1.2.3. Company Financials
- 12.1.2.4. SWOT Analysis
- 12.1.3 Kuraray Co Ltd
- 12.1.3.1. Company Overview
- 12.1.3.2. Products
- 12.1.3.3. Company Financials
- 12.1.3.4. SWOT Analysis
- 12.1.4 Hangzhou Nature Technology Co Ltd (Nature Carbon)
- 12.1.4.1. Company Overview
- 12.1.4.2. Products
- 12.1.4.3. Company Financials
- 12.1.4.4. SWOT Analysis
- 12.1.5 Anshan Sinocarb Carbon Fibers Co Ltd
- 12.1.5.1. Company Overview
- 12.1.5.2. Products
- 12.1.5.3. Company Financials
- 12.1.5.4. SWOT Analysis
- 12.1.6 Unitika LTD*List Not Exhaustive
- 12.1.6.1. Company Overview
- 12.1.6.2. Products
- 12.1.6.3. Company Financials
- 12.1.6.4. SWOT Analysis
- 12.1.7 China Beihai Fiberglass Co Ltd
- 12.1.7.1. Company Overview
- 12.1.7.2. Products
- 12.1.7.3. Company Financials
- 12.1.7.4. SWOT Analysis
- 12.1.8 Toyobo Co Ltd
- 12.1.8.1. Company Overview
- 12.1.8.2. Products
- 12.1.8.3. Company Financials
- 12.1.8.4. SWOT Analysis
- 12.1.9 Osaka Gas Chemicals Co Ltd
- 12.1.9.1. Company Overview
- 12.1.9.2. Products
- 12.1.9.3. Company Financials
- 12.1.9.4. SWOT Analysis
- 12.1.10 Evertech Envisafe Ecology Co Ltd
- 12.1.10.1. Company Overview
- 12.1.10.2. Products
- 12.1.10.3. Company Financials
- 12.1.10.4. SWOT Analysis
- 12.1.11 HPMS Graphite
- 12.1.11.1. Company Overview
- 12.1.11.2. Products
- 12.1.11.3. Company Financials
- 12.1.11.4. SWOT Analysis
- 12.1.1 Jiangsu Tongkang Activated Carbon Fiber Co Ltd
- 12.2. Market Entropy
- 12.2.1 Company's Key Areas Served
- 12.2.2 Recent Developments
- 12.3. Company Market Share Analysis 2025
- 12.3.1 Top 5 Companies Market Share Analysis
- 12.3.2 Top 3 Companies Market Share Analysis
- 12.4. List of Potential Customers
- 13. Research Methodology
List of Figures
- Figure 1: Global Activated Carbon Fiber Industry Revenue Breakdown (Million, %) by Region 2025 & 2033
- Figure 2: Asia Pacific Activated Carbon Fiber Industry Revenue (Million), by Raw Material 2025 & 2033
- Figure 3: Asia Pacific Activated Carbon Fiber Industry Revenue Share (%), by Raw Material 2025 & 2033
- Figure 4: Asia Pacific Activated Carbon Fiber Industry Revenue (Million), by Application 2025 & 2033
- Figure 5: Asia Pacific Activated Carbon Fiber Industry Revenue Share (%), by Application 2025 & 2033
- Figure 6: Asia Pacific Activated Carbon Fiber Industry Revenue (Million), by Country 2025 & 2033
- Figure 7: Asia Pacific Activated Carbon Fiber Industry Revenue Share (%), by Country 2025 & 2033
- Figure 8: North America Activated Carbon Fiber Industry Revenue (Million), by Raw Material 2025 & 2033
- Figure 9: North America Activated Carbon Fiber Industry Revenue Share (%), by Raw Material 2025 & 2033
- Figure 10: North America Activated Carbon Fiber Industry Revenue (Million), by Application 2025 & 2033
- Figure 11: North America Activated Carbon Fiber Industry Revenue Share (%), by Application 2025 & 2033
- Figure 12: North America Activated Carbon Fiber Industry Revenue (Million), by Country 2025 & 2033
- Figure 13: North America Activated Carbon Fiber Industry Revenue Share (%), by Country 2025 & 2033
- Figure 14: Europe Activated Carbon Fiber Industry Revenue (Million), by Raw Material 2025 & 2033
- Figure 15: Europe Activated Carbon Fiber Industry Revenue Share (%), by Raw Material 2025 & 2033
- Figure 16: Europe Activated Carbon Fiber Industry Revenue (Million), by Application 2025 & 2033
- Figure 17: Europe Activated Carbon Fiber Industry Revenue Share (%), by Application 2025 & 2033
- Figure 18: Europe Activated Carbon Fiber Industry Revenue (Million), by Country 2025 & 2033
- Figure 19: Europe Activated Carbon Fiber Industry Revenue Share (%), by Country 2025 & 2033
- Figure 20: Middle East Activated Carbon Fiber Industry Revenue (Million), by Raw Material 2025 & 2033
- Figure 21: Middle East Activated Carbon Fiber Industry Revenue Share (%), by Raw Material 2025 & 2033
- Figure 22: Middle East Activated Carbon Fiber Industry Revenue (Million), by Application 2025 & 2033
- Figure 23: Middle East Activated Carbon Fiber Industry Revenue Share (%), by Application 2025 & 2033
- Figure 24: Middle East Activated Carbon Fiber Industry Revenue (Million), by Country 2025 & 2033
- Figure 25: Middle East Activated Carbon Fiber Industry Revenue Share (%), by Country 2025 & 2033
- Figure 26: Saudi Arabia Activated Carbon Fiber Industry Revenue (Million), by Raw Material 2025 & 2033
- Figure 27: Saudi Arabia Activated Carbon Fiber Industry Revenue Share (%), by Raw Material 2025 & 2033
- Figure 28: Saudi Arabia Activated Carbon Fiber Industry Revenue (Million), by Application 2025 & 2033
- Figure 29: Saudi Arabia Activated Carbon Fiber Industry Revenue Share (%), by Application 2025 & 2033
- Figure 30: Saudi Arabia Activated Carbon Fiber Industry Revenue (Million), by Country 2025 & 2033
- Figure 31: Saudi Arabia Activated Carbon Fiber Industry Revenue Share (%), by Country 2025 & 2033
List of Tables
- Table 1: Global Activated Carbon Fiber Industry Revenue Million Forecast, by Raw Material 2020 & 2033
- Table 2: Global Activated Carbon Fiber Industry Revenue Million Forecast, by Application 2020 & 2033
- Table 3: Global Activated Carbon Fiber Industry Revenue Million Forecast, by Region 2020 & 2033
- Table 4: Global Activated Carbon Fiber Industry Revenue Million Forecast, by Raw Material 2020 & 2033
- Table 5: Global Activated Carbon Fiber Industry Revenue Million Forecast, by Application 2020 & 2033
- Table 6: Global Activated Carbon Fiber Industry Revenue Million Forecast, by Country 2020 & 2033
- Table 7: China Activated Carbon Fiber Industry Revenue (Million) Forecast, by Application 2020 & 2033
- Table 8: India Activated Carbon Fiber Industry Revenue (Million) Forecast, by Application 2020 & 2033
- Table 9: Japan Activated Carbon Fiber Industry Revenue (Million) Forecast, by Application 2020 & 2033
- Table 10: South Korea Activated Carbon Fiber Industry Revenue (Million) Forecast, by Application 2020 & 2033
- Table 11: Rest of Asia Pacific Activated Carbon Fiber Industry Revenue (Million) Forecast, by Application 2020 & 2033
- Table 12: Global Activated Carbon Fiber Industry Revenue Million Forecast, by Raw Material 2020 & 2033
- Table 13: Global Activated Carbon Fiber Industry Revenue Million Forecast, by Application 2020 & 2033
- Table 14: Global Activated Carbon Fiber Industry Revenue Million Forecast, by Country 2020 & 2033
- Table 15: United States Activated Carbon Fiber Industry Revenue (Million) Forecast, by Application 2020 & 2033
- Table 16: Mexico Activated Carbon Fiber Industry Revenue (Million) Forecast, by Application 2020 & 2033
- Table 17: Canada Activated Carbon Fiber Industry Revenue (Million) Forecast, by Application 2020 & 2033
- Table 18: Global Activated Carbon Fiber Industry Revenue Million Forecast, by Raw Material 2020 & 2033
- Table 19: Global Activated Carbon Fiber Industry Revenue Million Forecast, by Application 2020 & 2033
- Table 20: Global Activated Carbon Fiber Industry Revenue Million Forecast, by Country 2020 & 2033
- Table 21: Germany Activated Carbon Fiber Industry Revenue (Million) Forecast, by Application 2020 & 2033
- Table 22: United Kingdom Activated Carbon Fiber Industry Revenue (Million) Forecast, by Application 2020 & 2033
- Table 23: France Activated Carbon Fiber Industry Revenue (Million) Forecast, by Application 2020 & 2033
- Table 24: Italy Activated Carbon Fiber Industry Revenue (Million) Forecast, by Application 2020 & 2033
- Table 25: Rest of Europe Activated Carbon Fiber Industry Revenue (Million) Forecast, by Application 2020 & 2033
- Table 26: Global Activated Carbon Fiber Industry Revenue Million Forecast, by Raw Material 2020 & 2033
- Table 27: Global Activated Carbon Fiber Industry Revenue Million Forecast, by Application 2020 & 2033
- Table 28: Global Activated Carbon Fiber Industry Revenue Million Forecast, by Country 2020 & 2033
- Table 29: Global Activated Carbon Fiber Industry Revenue Million Forecast, by Raw Material 2020 & 2033
- Table 30: Global Activated Carbon Fiber Industry Revenue Million Forecast, by Application 2020 & 2033
- Table 31: Global Activated Carbon Fiber Industry Revenue Million Forecast, by Country 2020 & 2033
- Table 32: South Africa Activated Carbon Fiber Industry Revenue (Million) Forecast, by Application 2020 & 2033
- Table 33: Rest of Middle East Activated Carbon Fiber Industry Revenue (Million) Forecast, by Application 2020 & 2033
Frequently Asked Questions
1. What is the projected Compound Annual Growth Rate (CAGR) of the Activated Carbon Fiber Industry?
The projected CAGR is approximately 3.71%.
2. Which companies are prominent players in the Activated Carbon Fiber Industry?
Key companies in the market include Jiangsu Tongkang Activated Carbon Fiber Co Ltd, Nantong Yongtong Environmental Technology Co Ltd, Kuraray Co Ltd, Hangzhou Nature Technology Co Ltd (Nature Carbon), Anshan Sinocarb Carbon Fibers Co Ltd, Unitika LTD*List Not Exhaustive, China Beihai Fiberglass Co Ltd, Toyobo Co Ltd, Osaka Gas Chemicals Co Ltd, Evertech Envisafe Ecology Co Ltd, HPMS Graphite.
3. What are the main segments of the Activated Carbon Fiber Industry?
The market segments include Raw Material, Application.
4. Can you provide details about the market size?
The market size is estimated to be USD 414.13 Million as of 2022.
5. What are some drivers contributing to market growth?
Increasing Environmental Concerns Related to Air and Water Pollution; Superior Properties of Activated Carbon Fiber.
6. What are the notable trends driving market growth?
Increasing Demand from the Purification Industry.
7. Are there any restraints impacting market growth?
Concerns Related to Raw Materials.
8. Can you provide examples of recent developments in the market?
N/A
9. What pricing options are available for accessing the report?
Pricing options include single-user, multi-user, and enterprise licenses priced at USD 4750, USD 5250, and USD 8750 respectively.
10. Is the market size provided in terms of value or volume?
The market size is provided in terms of value, measured in Million.
11. Are there any specific market keywords associated with the report?
Yes, the market keyword associated with the report is "Activated Carbon Fiber Industry," which aids in identifying and referencing the specific market segment covered.
12. How do I determine which pricing option suits my needs best?
The pricing options vary based on user requirements and access needs. Individual users may opt for single-user licenses, while businesses requiring broader access may choose multi-user or enterprise licenses for cost-effective access to the report.
13. Are there any additional resources or data provided in the Activated Carbon Fiber Industry report?
While the report offers comprehensive insights, it's advisable to review the specific contents or supplementary materials provided to ascertain if additional resources or data are available.
14. How can I stay updated on further developments or reports in the Activated Carbon Fiber Industry?
To stay informed about further developments, trends, and reports in the Activated Carbon Fiber Industry, consider subscribing to industry newsletters, following relevant companies and organizations, or regularly checking reputable industry news sources and publications.
Methodology
Step 1 - Identification of Relevant Samples Size from Population Database


Step 2 - Approaches for Defining Global Market Size (Value, Volume* & Price*)

Note*: In applicable scenarios
Step 3 - Data Sources
Primary Research
- Web Analytics
- Survey Reports
- Research Institute
- Latest Research Reports
- Opinion Leaders
Secondary Research
- Annual Reports
- White Paper
- Latest Press Release
- Industry Association
- Paid Database
- Investor Presentations

Step 4 - Data Triangulation
Involves using different sources of information in order to increase the validity of a study
These sources are likely to be stakeholders in a program - participants, other researchers, program staff, other community members, and so on.
Then we put all data in single framework & apply various statistical tools to find out the dynamic on the market.
During the analysis stage, feedback from the stakeholder groups would be compared to determine areas of agreement as well as areas of divergence