

Key Insights
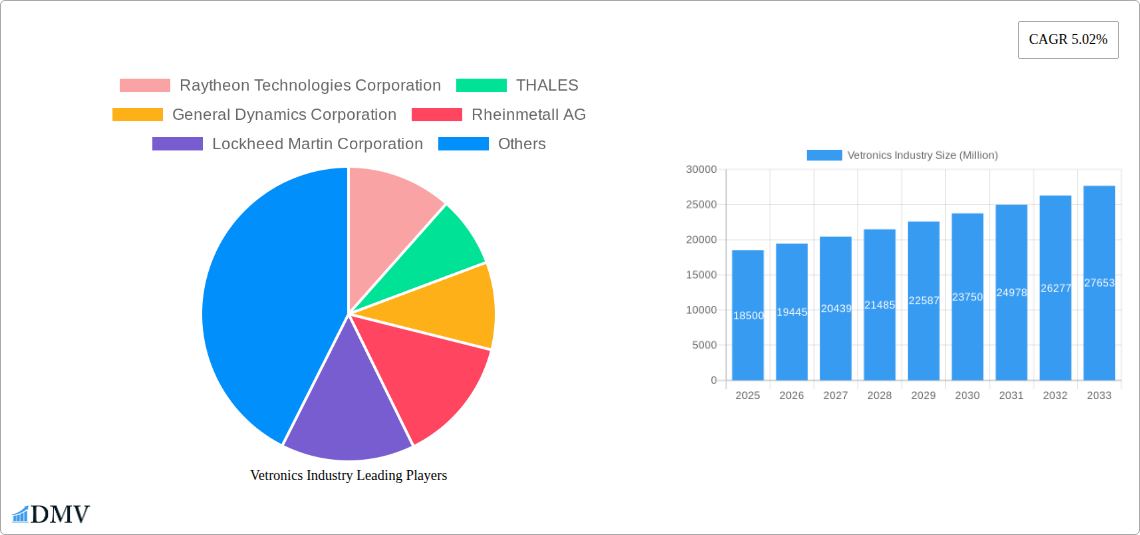
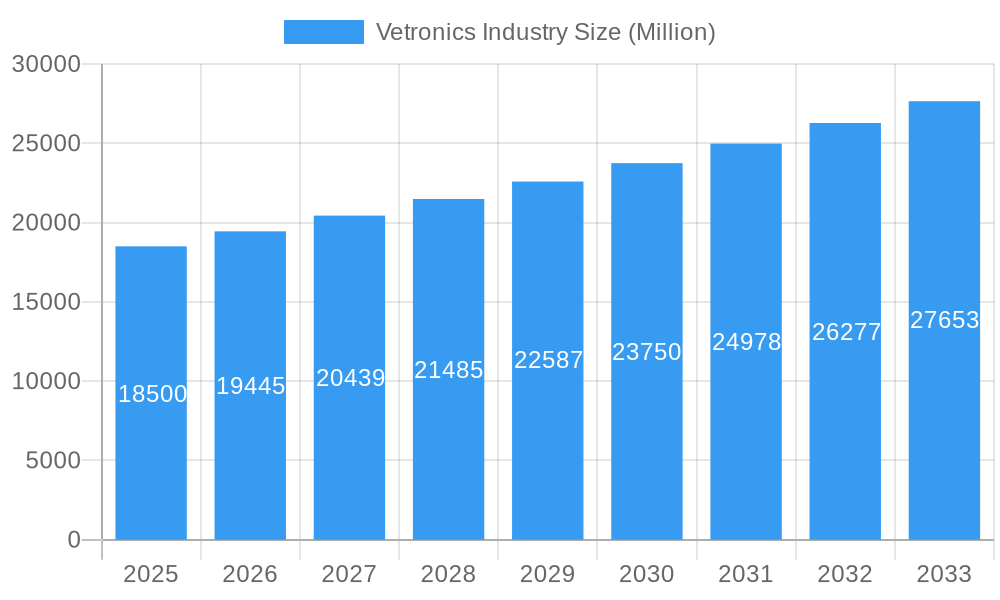
The global Vetronics market is poised for robust growth, projected to reach an estimated market size of $18,500 million by 2025, with a Compound Annual Growth Rate (CAGR) of 5.02% during the forecast period of 2025-2033. This expansion is driven by a confluence of factors, including the continuous modernization of military fleets worldwide, the increasing demand for advanced battlefield awareness, and the integration of sophisticated digital technologies into military vehicles. Key growth drivers include the escalating geopolitical tensions, necessitating enhanced defense capabilities, and the ongoing R&D investments by leading defense manufacturers to develop next-generation vetronics systems. These systems are crucial for improving command, control, communications, computers, and intelligence (C4) capabilities, as well as for providing superior navigation and power management solutions for a wide array of armored vehicles. The market's upward trajectory is further supported by the growing emphasis on network-centric warfare and the deployment of unmanned ground vehicles (UGVs), which rely heavily on advanced vetronics.
Vetronics Industry Market Size (In Billion)
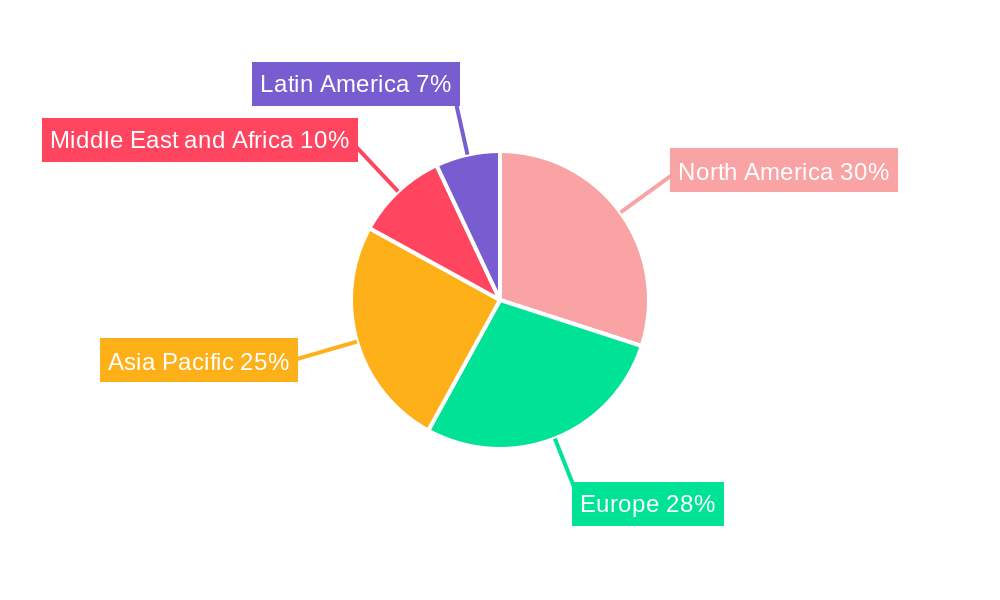
The vetronics market is segmented into various vehicle types, including Main Battle Tanks, Light Armored Vehicles, and Amphibious Armored Vehicles, each with specific requirements for integrated electronic systems. The subsystem segmentation highlights the critical role of C4, Navigation, and Power systems in enhancing vehicle performance and operational effectiveness. Geographically, North America and Europe are expected to remain dominant markets due to significant defense spending and the presence of major defense contractors. However, the Asia Pacific region is anticipated to exhibit the fastest growth, fueled by increasing defense modernization initiatives in countries like China and India. While the market presents substantial opportunities, it also faces restraints such as the high cost of developing and integrating advanced vetronics systems, as well as stringent regulatory frameworks and cybersecurity concerns that need careful navigation by industry players. The competitive landscape is characterized by the presence of established global players like Raytheon Technologies Corporation, THALES, and General Dynamics Corporation, who are actively engaged in innovation and strategic collaborations to capture market share.
Vetronics Industry Company Market Share
Vetronics Industry Market Composition & Trends
The global vetronics market is a dynamic and evolving landscape, characterized by significant consolidation and intense innovation, driven by the increasing sophistication of military and defense platforms. Market concentration is notably high, with a few key defense contractors dominating the scene, including Raytheon Technologies Corporation, THALES, General Dynamics Corporation, Rheinmetall AG, Lockheed Martin Corporation, L3Harris Technologies Inc, Leonardo S.p.A., Curtiss-Wright Corporation, BAE Systems plc, and Saab AB. These players are actively engaged in research and development, pushing the boundaries of electronic systems for military vehicles. Innovation catalysts include the demand for enhanced situational awareness, network-centric warfare capabilities, and autonomous or semi-autonomous vehicle operations. The regulatory landscape, while complex, generally favors the adoption of advanced technologies that enhance national security and operational effectiveness. Substitute products are limited given the specialized nature of military vetronics, but advancements in commercial off-the-shelf (COTS) technologies are increasingly being adapted. End-user profiles are primarily defense ministries and armed forces worldwide, with a focus on modernization programs. Mergers and acquisitions (M&A) are a significant aspect of market composition. For instance, strategic acquisitions by larger defense conglomerates aim to broaden their technological portfolios and secure market share. M&A deal values are often substantial, reflecting the high stakes and technological importance of the vetronics sector. The market share distribution is influenced by major defense contracts and the development of next-generation military platforms.
- Market Concentration: Dominated by major defense prime contractors.
- Innovation Catalysts: Network-centric warfare, autonomous systems, enhanced ISR.
- Regulatory Landscape: Driven by national security mandates and interoperability standards.
- Substitute Products: Limited, but increasing adoption of adapted COTS technology.
- End-User Profiles: Global defense ministries and armed forces.
- M&A Activities: Frequent, with substantial deal values.
Vetronics Industry Industry Evolution
The vetronics industry has undergone a profound transformation, evolving from basic electronic components to highly integrated, intelligent systems that are fundamental to modern military operations. Over the historical period of 2019–2024, the market witnessed a consistent upward trajectory, fueled by geopolitical tensions and the imperative for military modernization across the globe. This period saw significant investments in upgrading existing platforms and developing new ones, with vetronics playing a central role in enhancing their combat effectiveness, survivability, and operational efficiency. The base year of 2025 marks a pivotal point, with the market poised for accelerated growth throughout the forecast period of 2025–2033.
Technological advancements have been the primary engine of this evolution. The integration of advanced processing power, sophisticated sensor fusion, and high-bandwidth communication systems has enabled unprecedented levels of battlefield awareness. The shift towards digitalization and the incorporation of artificial intelligence (AI) and machine learning (ML) are redefining vehicle capabilities. This includes autonomous navigation, predictive maintenance, advanced targeting systems, and enhanced electronic warfare (EW) suites. For example, the adoption of AI-powered image recognition for threat identification has seen a growth rate of over 20% annually during the historical period.
Shifting consumer demands, in this context, refer to the evolving requirements of military end-users. There is an increasing emphasis on modularity and open architecture systems, allowing for easier upgrades and adaptation to new threats. The demand for lighter, more power-efficient vetronic systems is also a key trend, especially for unmanned and lighter armored vehicles. Furthermore, the need for robust cybersecurity solutions is paramount, as vetronic systems become more interconnected and reliant on data. The integration of C4 (Command, Control, Communications, Computers, and Intelligence) systems is no longer a separate component but is intrinsically woven into the fabric of the vehicle's operational capabilities, driving substantial growth in this sub-segment. The development of secure communication networks and data links has seen a Compound Annual Growth Rate (CAGR) of approximately 15% in the recent past. The adoption of advanced navigation systems, including GPS-denied solutions and inertial navigation systems (INS) with enhanced accuracy, has also seen a significant uptick, with adoption metrics reaching over 70% in new platform acquisitions. The power subsystem evolution, focusing on more efficient energy generation and distribution, is also crucial for supporting the increasing electronic load, with adoption of advanced power management systems showing a consistent increase.
Leading Regions, Countries, or Segments in Vetronics Industry
The dominance within the vetronics industry is multi-faceted, with key regions, countries, and specific vehicle types and subsystems exhibiting significant leadership. North America, particularly the United States, stands out as the leading region, driven by its substantial defense budget, ongoing modernization programs, and the presence of major defense contractors. Countries like the United States, France, the United Kingdom, Germany, and Israel are at the forefront of innovation and adoption, largely due to sustained geopolitical engagement and a strong emphasis on technological superiority in their defense doctrines.
Within the Vehicle Type segment, the Main Battle Tank (MBT) currently holds a dominant position. MBTs are sophisticated platforms that require extensive vetronic systems for fire control, navigation, survivability, and crew situational awareness. The continuous upgrade cycles and development of next-generation MBTs ensure a robust demand for advanced vetronics. For instance, the U.S. Army's Abrams tank modernization programs are significant drivers.
- Key Drivers for MBT Dominance:
- High-Value Procurement Programs: Significant government investment in MBT upgrades and new builds.
- Technological Integration Complexity: MBTs are platforms where the most advanced vetronics can be integrated due to their size and power capacity.
- Global Strategic Importance: MBTs remain a cornerstone of land warfare for major military powers.
The Subsystem: C4 (Command, Control, Communications, Computers, and Intelligence) segment is also a crucial area of leadership and growth. The trend towards network-centric warfare and enhanced battlefield management systems makes C4 capabilities indispensable. The integration of secure communication networks, data fusion, and real-time intelligence dissemination is critical for modern military operations.
- Key Drivers for C4 Dominance:
- Network-Centric Warfare Imperative: Essential for interoperability and coordinated operations.
- Intelligence, Surveillance, and Reconnaissance (ISR) Integration: Facilitates real-time data processing and dissemination.
- Cybersecurity Demands: Increasing focus on securing communication channels and data integrity.
While MBTs and C4 subsystems represent significant leadership areas, other segments are rapidly gaining traction. Light Armored Vehicles (LAVs) are seeing increased demand for advanced vetronics, particularly for reconnaissance, C4ISR, and convoy protection roles. The drive for modularity and deployability makes LAVs attractive platforms for integrating sophisticated, yet compact, vetronic systems. Similarly, Amphibious Armored Vehicles require specialized vetronic solutions to operate effectively in challenging environments, including advanced navigation and communication systems for littoral operations. The Other Vehicle category, which includes unmanned ground vehicles (UGVs) and specialized support vehicles, is a burgeoning area of innovation, pushing the boundaries of autonomous navigation and advanced sensor integration. The "Power" subsystem is also critical, with advancements in energy management and generation supporting the ever-increasing electronic load on all vehicle types.
Vetronics Industry Product Innovations
Product innovations in the vetronics industry are revolutionizing military vehicle capabilities. These advancements focus on enhancing situational awareness, combat effectiveness, and survivability. Key innovations include AI-powered sensor fusion systems that provide a comprehensive real-time operational picture, advanced navigation systems offering GPS-denied capabilities and autonomous pathfinding, and highly secure, resilient communication suites enabling seamless network integration. The development of active protection systems (APS) with integrated vetronic control units is a significant leap in vehicle survivability against advanced threats. Furthermore, modular vetronic architectures are enabling faster upgrades and adaptation, reducing lifecycle costs and increasing platform longevity. These innovations are characterized by increased processing power, reduced form factors, and lower power consumption, making them ideal for deployment on a wide range of platforms, from main battle tanks to unmanned systems.
Propelling Factors for Vetronics Industry Growth
The vetronics industry is experiencing robust growth driven by a confluence of strategic imperatives and technological advancements. Geopolitical instability and the ongoing need for military modernization programs globally are primary growth catalysts. Nations are investing heavily in upgrading legacy platforms and developing next-generation combat vehicles, with vetronics being a core component of these enhancements. The increasing demand for networked warfare capabilities, where vehicles must seamlessly communicate and share data, is driving the adoption of advanced C4 systems and robust communication suites. Furthermore, the rise of autonomous and semi-autonomous military systems, including unmanned ground vehicles (UGVs), necessitates sophisticated vetronic integration for navigation, sensor processing, and operational control. Technological advancements, such as AI and machine learning for enhanced situational awareness and threat detection, and the development of more powerful and efficient onboard computing systems, are also significant drivers.
- Technological Advancements: AI, ML, advanced sensor fusion, autonomous systems.
- Economic Factors: Increased defense spending, modernization programs.
- Regulatory Influences: Mandates for interoperability, cybersecurity, and enhanced operational capabilities.
Obstacles in the Vetronics Industry Market
Despite the promising growth trajectory, the vetronics industry faces several significant obstacles. The sheer complexity and high cost of developing and integrating advanced vetronic systems can be a major deterrent, especially for smaller nations or less well-funded defense programs. Stringent regulatory requirements and lengthy qualification processes for military-grade electronics can delay product deployment and increase development timelines. Supply chain disruptions, particularly for specialized electronic components and semiconductors, can lead to production delays and cost overruns, exacerbated by global demand and geopolitical factors. Furthermore, the ever-evolving threat landscape necessitates continuous R&D investment to keep pace with emerging technologies, creating a perpetual cycle of innovation and obsolescence. The substantial investment required for research and development in areas like AI and advanced cybersecurity can also be a barrier to entry and sustained competitiveness for smaller players.
- Regulatory Challenges: Long qualification cycles, stringent military standards.
- Supply Chain Disruptions: Component shortages, geopolitical impacts on manufacturing.
- Competitive Pressures: Need for continuous innovation, high R&D investment.
- High Integration Costs: Complexity of modern vetronic systems.
Future Opportunities in Vetronics Industry
The future of the vetronics industry is brimming with opportunities, driven by evolving defense strategies and emerging technologies. The increasing focus on unmanned and optionally manned platforms presents a significant growth area for vetronics, requiring advanced autonomy, sensor integration, and remote operation capabilities. The ongoing demand for enhanced survivability will continue to fuel innovation in active protection systems and electronic warfare capabilities. Furthermore, the trend towards modularity and open architecture systems opens up opportunities for specialized suppliers to provide best-of-breed solutions that can be integrated into various platforms. The development of AI-driven predictive maintenance for vetronic systems promises to reduce lifecycle costs and improve operational readiness. Emerging markets, particularly in Asia-Pacific and the Middle East, are also expected to witness increased defense modernization, creating new avenues for market penetration.
- Unmanned Systems: Autonomous navigation, sensor fusion for UGVs.
- Enhanced Survivability: Advanced APS, EW, and countermeasure systems.
- Modular Architectures: Open systems for easier integration and upgrades.
- AI for Maintenance: Predictive diagnostics and prognostics.
Major Players in the Vetronics Industry Ecosystem
- Raytheon Technologies Corporation
- THALES
- General Dynamics Corporation
- Rheinmetall AG
- Lockheed Martin Corporation
- L3Harris Technologies Inc
- Leonardo S p A
- Curtiss-Wright Corporation
- BAE Systems plc
- Saab AB
Key Developments in Vetronics Industry Industry
- February 2023: The US Army Contracting Command announced a USD 481.6 million contract to the General Dynamics Mission Systems segment to sustain the AN/MLQ-44 Prophet-Enhanced SIGINT vetronics systems. This development underscores the ongoing need for advanced intelligence, surveillance, and reconnaissance (ISR) capabilities within military vehicles.
- July 2022: General Dynamics Corporation received a contract worth USD 280.1 million from the US Army Contracting Command to integrate active protection sensors to shield the US Army's fleet of M1A2 Abrams main battle tanks from rocket-propelled grenades, anti-tank guided missiles, and similar threats. This contract highlights the critical importance of survivability enhancements through integrated vetronic solutions for armored platforms.
Strategic Vetronics Industry Market Forecast
The vetronics industry is projected for significant growth through 2033, fueled by an ongoing global emphasis on military modernization and technological advancement. Strategic investments in advanced C4ISR capabilities, autonomous systems, and enhanced platform survivability will be key growth catalysts. The increasing adoption of artificial intelligence and machine learning for improved situational awareness and operational efficiency will further propel market expansion. Emerging markets are expected to contribute substantially to demand, driven by their own defense modernization initiatives. The trend towards modular and open architecture vetronic systems will also create new opportunities for innovation and market penetration, allowing for greater adaptability and lifecycle support for defense platforms. The continued evolution of vehicle types, including a growing emphasis on unmanned ground vehicles, will necessitate increasingly sophisticated vetronic solutions, securing a strong future outlook for the industry.
Vetronics Industry Segmentation
-
1. Vehicle Type
- 1.1. Main Battle Tank
- 1.2. Light Armored Vehicle
- 1.3. Amphibious Armored Vehicle
- 1.4. Other Ve
-
2. Subsystem
- 2.1. C4
- 2.2. Navigation
- 2.3. Power
Vetronics Industry Segmentation By Geography
-
1. North America
- 1.1. United States
- 1.2. Canada
-
2. Europe
- 2.1. Germany
- 2.2. United Kingdom
- 2.3. France
- 2.4. Russia
- 2.5. Rest of Europe
-
3. Asia Pacific
- 3.1. China
- 3.2. India
- 3.3. Japan
- 3.4. South Korea
- 3.5. Australia
- 3.6. Rest of Asia Pacific
-
4. Latin America
- 4.1. Brazil
- 4.2. Rest of Latin America
-
5. Middle East and Africa
- 5.1. United Arab Emirates
- 5.2. Saudi Arabia
- 5.3. Israel
- 5.4. Rest of Middle East and Africa
Vetronics Industry Regional Market Share
Geographic Coverage of Vetronics Industry
Vetronics Industry REPORT HIGHLIGHTS
| Aspects | Details |
|---|---|
| Study Period | 2020-2034 |
| Base Year | 2025 |
| Estimated Year | 2026 |
| Forecast Period | 2026-2034 |
| Historical Period | 2020-2025 |
| Growth Rate | CAGR of 4.54% from 2020-2034 |
| Segmentation |
|
Table of Contents
- 1. Introduction
- 1.1. Research Scope
- 1.2. Market Segmentation
- 1.3. Research Objective
- 1.4. Definitions and Assumptions
- 2. Executive Summary
- 2.1. Market Snapshot
- 3. Market Dynamics
- 3.1. Market Drivers
- 3.2. Market Restrains
- 3.3. Market Trends
- 3.4. Market Opportunities
- 4. Market Factor Analysis
- 4.1. Porters Five Forces
- 4.1.1. Bargaining Power of Suppliers
- 4.1.2. Bargaining Power of Buyers
- 4.1.3. Threat of New Entrants
- 4.1.4. Threat of Substitutes
- 4.1.5. Competitive Rivalry
- 4.2. PESTEL analysis
- 4.3. BCG Analysis
- 4.3.1. Stars (High Growth, High Market Share)
- 4.3.2. Cash Cows (Low Growth, High Market Share)
- 4.3.3. Question Mark (High Growth, Low Market Share)
- 4.3.4. Dogs (Low Growth, Low Market Share)
- 4.4. Ansoff Matrix Analysis
- 4.5. Supply Chain Analysis
- 4.6. Regulatory Landscape
- 4.7. Current Market Potential and Opportunity Assessment (TAM–SAM–SOM Framework)
- 4.8. DMV Analyst Note
- 4.1. Porters Five Forces
- 5. Market Analysis, Insights and Forecast 2021-2033
- 5.1. Market Analysis, Insights and Forecast - by Vehicle Type
- 5.1.1. Main Battle Tank
- 5.1.2. Light Armored Vehicle
- 5.1.3. Amphibious Armored Vehicle
- 5.1.4. Other Ve
- 5.2. Market Analysis, Insights and Forecast - by Subsystem
- 5.2.1. C4
- 5.2.2. Navigation
- 5.2.3. Power
- 5.3. Market Analysis, Insights and Forecast - by Region
- 5.3.1. North America
- 5.3.2. Europe
- 5.3.3. Asia Pacific
- 5.3.4. Latin America
- 5.3.5. Middle East and Africa
- 5.1. Market Analysis, Insights and Forecast - by Vehicle Type
- 6. Global Vetronics Industry Analysis, Insights and Forecast, 2021-2033
- 6.1. Market Analysis, Insights and Forecast - by Vehicle Type
- 6.1.1. Main Battle Tank
- 6.1.2. Light Armored Vehicle
- 6.1.3. Amphibious Armored Vehicle
- 6.1.4. Other Ve
- 6.2. Market Analysis, Insights and Forecast - by Subsystem
- 6.2.1. C4
- 6.2.2. Navigation
- 6.2.3. Power
- 6.1. Market Analysis, Insights and Forecast - by Vehicle Type
- 7. North America Vetronics Industry Analysis, Insights and Forecast, 2020-2032
- 7.1. Market Analysis, Insights and Forecast - by Vehicle Type
- 7.1.1. Main Battle Tank
- 7.1.2. Light Armored Vehicle
- 7.1.3. Amphibious Armored Vehicle
- 7.1.4. Other Ve
- 7.2. Market Analysis, Insights and Forecast - by Subsystem
- 7.2.1. C4
- 7.2.2. Navigation
- 7.2.3. Power
- 7.1. Market Analysis, Insights and Forecast - by Vehicle Type
- 8. Europe Vetronics Industry Analysis, Insights and Forecast, 2020-2032
- 8.1. Market Analysis, Insights and Forecast - by Vehicle Type
- 8.1.1. Main Battle Tank
- 8.1.2. Light Armored Vehicle
- 8.1.3. Amphibious Armored Vehicle
- 8.1.4. Other Ve
- 8.2. Market Analysis, Insights and Forecast - by Subsystem
- 8.2.1. C4
- 8.2.2. Navigation
- 8.2.3. Power
- 8.1. Market Analysis, Insights and Forecast - by Vehicle Type
- 9. Asia Pacific Vetronics Industry Analysis, Insights and Forecast, 2020-2032
- 9.1. Market Analysis, Insights and Forecast - by Vehicle Type
- 9.1.1. Main Battle Tank
- 9.1.2. Light Armored Vehicle
- 9.1.3. Amphibious Armored Vehicle
- 9.1.4. Other Ve
- 9.2. Market Analysis, Insights and Forecast - by Subsystem
- 9.2.1. C4
- 9.2.2. Navigation
- 9.2.3. Power
- 9.1. Market Analysis, Insights and Forecast - by Vehicle Type
- 10. Latin America Vetronics Industry Analysis, Insights and Forecast, 2020-2032
- 10.1. Market Analysis, Insights and Forecast - by Vehicle Type
- 10.1.1. Main Battle Tank
- 10.1.2. Light Armored Vehicle
- 10.1.3. Amphibious Armored Vehicle
- 10.1.4. Other Ve
- 10.2. Market Analysis, Insights and Forecast - by Subsystem
- 10.2.1. C4
- 10.2.2. Navigation
- 10.2.3. Power
- 10.1. Market Analysis, Insights and Forecast - by Vehicle Type
- 11. Middle East and Africa Vetronics Industry Analysis, Insights and Forecast, 2020-2032
- 11.1. Market Analysis, Insights and Forecast - by Vehicle Type
- 11.1.1. Main Battle Tank
- 11.1.2. Light Armored Vehicle
- 11.1.3. Amphibious Armored Vehicle
- 11.1.4. Other Ve
- 11.2. Market Analysis, Insights and Forecast - by Subsystem
- 11.2.1. C4
- 11.2.2. Navigation
- 11.2.3. Power
- 11.1. Market Analysis, Insights and Forecast - by Vehicle Type
- 12. Competitive Analysis
- 12.1. Company Profiles
- 12.1.1 Raytheon Technologies Corporation
- 12.1.1.1. Company Overview
- 12.1.1.2. Products
- 12.1.1.3. Company Financials
- 12.1.1.4. SWOT Analysis
- 12.1.2 THALES
- 12.1.2.1. Company Overview
- 12.1.2.2. Products
- 12.1.2.3. Company Financials
- 12.1.2.4. SWOT Analysis
- 12.1.3 General Dynamics Corporation
- 12.1.3.1. Company Overview
- 12.1.3.2. Products
- 12.1.3.3. Company Financials
- 12.1.3.4. SWOT Analysis
- 12.1.4 Rheinmetall AG
- 12.1.4.1. Company Overview
- 12.1.4.2. Products
- 12.1.4.3. Company Financials
- 12.1.4.4. SWOT Analysis
- 12.1.5 Lockheed Martin Corporation
- 12.1.5.1. Company Overview
- 12.1.5.2. Products
- 12.1.5.3. Company Financials
- 12.1.5.4. SWOT Analysis
- 12.1.6 L3Harris Technologies Inc
- 12.1.6.1. Company Overview
- 12.1.6.2. Products
- 12.1.6.3. Company Financials
- 12.1.6.4. SWOT Analysis
- 12.1.7 Leonardo S p A
- 12.1.7.1. Company Overview
- 12.1.7.2. Products
- 12.1.7.3. Company Financials
- 12.1.7.4. SWOT Analysis
- 12.1.8 Curtiss-Wright Corporation
- 12.1.8.1. Company Overview
- 12.1.8.2. Products
- 12.1.8.3. Company Financials
- 12.1.8.4. SWOT Analysis
- 12.1.9 BAE Systems plc
- 12.1.9.1. Company Overview
- 12.1.9.2. Products
- 12.1.9.3. Company Financials
- 12.1.9.4. SWOT Analysis
- 12.1.10 Saab AB
- 12.1.10.1. Company Overview
- 12.1.10.2. Products
- 12.1.10.3. Company Financials
- 12.1.10.4. SWOT Analysis
- 12.1.1 Raytheon Technologies Corporation
- 12.2. Market Entropy
- 12.2.1 Company's Key Areas Served
- 12.2.2 Recent Developments
- 12.3. Company Market Share Analysis 2025
- 12.3.1 Top 5 Companies Market Share Analysis
- 12.3.2 Top 3 Companies Market Share Analysis
- 12.4. List of Potential Customers
- 13. Research Methodology
List of Figures
- Figure 1: Global Vetronics Industry Revenue Breakdown (undefined, %) by Region 2025 & 2033
- Figure 2: North America Vetronics Industry Revenue (undefined), by Vehicle Type 2025 & 2033
- Figure 3: North America Vetronics Industry Revenue Share (%), by Vehicle Type 2025 & 2033
- Figure 4: North America Vetronics Industry Revenue (undefined), by Subsystem 2025 & 2033
- Figure 5: North America Vetronics Industry Revenue Share (%), by Subsystem 2025 & 2033
- Figure 6: North America Vetronics Industry Revenue (undefined), by Country 2025 & 2033
- Figure 7: North America Vetronics Industry Revenue Share (%), by Country 2025 & 2033
- Figure 8: Europe Vetronics Industry Revenue (undefined), by Vehicle Type 2025 & 2033
- Figure 9: Europe Vetronics Industry Revenue Share (%), by Vehicle Type 2025 & 2033
- Figure 10: Europe Vetronics Industry Revenue (undefined), by Subsystem 2025 & 2033
- Figure 11: Europe Vetronics Industry Revenue Share (%), by Subsystem 2025 & 2033
- Figure 12: Europe Vetronics Industry Revenue (undefined), by Country 2025 & 2033
- Figure 13: Europe Vetronics Industry Revenue Share (%), by Country 2025 & 2033
- Figure 14: Asia Pacific Vetronics Industry Revenue (undefined), by Vehicle Type 2025 & 2033
- Figure 15: Asia Pacific Vetronics Industry Revenue Share (%), by Vehicle Type 2025 & 2033
- Figure 16: Asia Pacific Vetronics Industry Revenue (undefined), by Subsystem 2025 & 2033
- Figure 17: Asia Pacific Vetronics Industry Revenue Share (%), by Subsystem 2025 & 2033
- Figure 18: Asia Pacific Vetronics Industry Revenue (undefined), by Country 2025 & 2033
- Figure 19: Asia Pacific Vetronics Industry Revenue Share (%), by Country 2025 & 2033
- Figure 20: Latin America Vetronics Industry Revenue (undefined), by Vehicle Type 2025 & 2033
- Figure 21: Latin America Vetronics Industry Revenue Share (%), by Vehicle Type 2025 & 2033
- Figure 22: Latin America Vetronics Industry Revenue (undefined), by Subsystem 2025 & 2033
- Figure 23: Latin America Vetronics Industry Revenue Share (%), by Subsystem 2025 & 2033
- Figure 24: Latin America Vetronics Industry Revenue (undefined), by Country 2025 & 2033
- Figure 25: Latin America Vetronics Industry Revenue Share (%), by Country 2025 & 2033
- Figure 26: Middle East and Africa Vetronics Industry Revenue (undefined), by Vehicle Type 2025 & 2033
- Figure 27: Middle East and Africa Vetronics Industry Revenue Share (%), by Vehicle Type 2025 & 2033
- Figure 28: Middle East and Africa Vetronics Industry Revenue (undefined), by Subsystem 2025 & 2033
- Figure 29: Middle East and Africa Vetronics Industry Revenue Share (%), by Subsystem 2025 & 2033
- Figure 30: Middle East and Africa Vetronics Industry Revenue (undefined), by Country 2025 & 2033
- Figure 31: Middle East and Africa Vetronics Industry Revenue Share (%), by Country 2025 & 2033
List of Tables
- Table 1: Global Vetronics Industry Revenue undefined Forecast, by Vehicle Type 2020 & 2033
- Table 2: Global Vetronics Industry Revenue undefined Forecast, by Subsystem 2020 & 2033
- Table 3: Global Vetronics Industry Revenue undefined Forecast, by Region 2020 & 2033
- Table 4: Global Vetronics Industry Revenue undefined Forecast, by Vehicle Type 2020 & 2033
- Table 5: Global Vetronics Industry Revenue undefined Forecast, by Subsystem 2020 & 2033
- Table 6: Global Vetronics Industry Revenue undefined Forecast, by Country 2020 & 2033
- Table 7: United States Vetronics Industry Revenue (undefined) Forecast, by Application 2020 & 2033
- Table 8: Canada Vetronics Industry Revenue (undefined) Forecast, by Application 2020 & 2033
- Table 9: Global Vetronics Industry Revenue undefined Forecast, by Vehicle Type 2020 & 2033
- Table 10: Global Vetronics Industry Revenue undefined Forecast, by Subsystem 2020 & 2033
- Table 11: Global Vetronics Industry Revenue undefined Forecast, by Country 2020 & 2033
- Table 12: Germany Vetronics Industry Revenue (undefined) Forecast, by Application 2020 & 2033
- Table 13: United Kingdom Vetronics Industry Revenue (undefined) Forecast, by Application 2020 & 2033
- Table 14: France Vetronics Industry Revenue (undefined) Forecast, by Application 2020 & 2033
- Table 15: Russia Vetronics Industry Revenue (undefined) Forecast, by Application 2020 & 2033
- Table 16: Rest of Europe Vetronics Industry Revenue (undefined) Forecast, by Application 2020 & 2033
- Table 17: Global Vetronics Industry Revenue undefined Forecast, by Vehicle Type 2020 & 2033
- Table 18: Global Vetronics Industry Revenue undefined Forecast, by Subsystem 2020 & 2033
- Table 19: Global Vetronics Industry Revenue undefined Forecast, by Country 2020 & 2033
- Table 20: China Vetronics Industry Revenue (undefined) Forecast, by Application 2020 & 2033
- Table 21: India Vetronics Industry Revenue (undefined) Forecast, by Application 2020 & 2033
- Table 22: Japan Vetronics Industry Revenue (undefined) Forecast, by Application 2020 & 2033
- Table 23: South Korea Vetronics Industry Revenue (undefined) Forecast, by Application 2020 & 2033
- Table 24: Australia Vetronics Industry Revenue (undefined) Forecast, by Application 2020 & 2033
- Table 25: Rest of Asia Pacific Vetronics Industry Revenue (undefined) Forecast, by Application 2020 & 2033
- Table 26: Global Vetronics Industry Revenue undefined Forecast, by Vehicle Type 2020 & 2033
- Table 27: Global Vetronics Industry Revenue undefined Forecast, by Subsystem 2020 & 2033
- Table 28: Global Vetronics Industry Revenue undefined Forecast, by Country 2020 & 2033
- Table 29: Brazil Vetronics Industry Revenue (undefined) Forecast, by Application 2020 & 2033
- Table 30: Rest of Latin America Vetronics Industry Revenue (undefined) Forecast, by Application 2020 & 2033
- Table 31: Global Vetronics Industry Revenue undefined Forecast, by Vehicle Type 2020 & 2033
- Table 32: Global Vetronics Industry Revenue undefined Forecast, by Subsystem 2020 & 2033
- Table 33: Global Vetronics Industry Revenue undefined Forecast, by Country 2020 & 2033
- Table 34: United Arab Emirates Vetronics Industry Revenue (undefined) Forecast, by Application 2020 & 2033
- Table 35: Saudi Arabia Vetronics Industry Revenue (undefined) Forecast, by Application 2020 & 2033
- Table 36: Israel Vetronics Industry Revenue (undefined) Forecast, by Application 2020 & 2033
- Table 37: Rest of Middle East and Africa Vetronics Industry Revenue (undefined) Forecast, by Application 2020 & 2033
Frequently Asked Questions
1. What is the projected Compound Annual Growth Rate (CAGR) of the Vetronics Industry?
The projected CAGR is approximately 4.54%.
2. Which companies are prominent players in the Vetronics Industry?
Key companies in the market include Raytheon Technologies Corporation, THALES, General Dynamics Corporation, Rheinmetall AG, Lockheed Martin Corporation, L3Harris Technologies Inc, Leonardo S p A, Curtiss-Wright Corporation, BAE Systems plc, Saab AB.
3. What are the main segments of the Vetronics Industry?
The market segments include Vehicle Type, Subsystem.
4. Can you provide details about the market size?
The market size is estimated to be USD XXX N/A as of 2022.
5. What are some drivers contributing to market growth?
N/A
6. What are the notable trends driving market growth?
Light Armored Vehicles Segment is Estimated to Show Remarkable Growth During the Forecast Period.
7. Are there any restraints impacting market growth?
N/A
8. Can you provide examples of recent developments in the market?
In February 2023, the US Army Contracting Command announced a USD 481.6 million contract to the General Dynamics Mission Systems segment to sustain the AN/MLQ-44 Prophet-Enhanced SIGINT vetronics systems.
9. What pricing options are available for accessing the report?
Pricing options include single-user, multi-user, and enterprise licenses priced at USD 4750, USD 5250, and USD 8750 respectively.
10. Is the market size provided in terms of value or volume?
The market size is provided in terms of value, measured in N/A.
11. Are there any specific market keywords associated with the report?
Yes, the market keyword associated with the report is "Vetronics Industry," which aids in identifying and referencing the specific market segment covered.
12. How do I determine which pricing option suits my needs best?
The pricing options vary based on user requirements and access needs. Individual users may opt for single-user licenses, while businesses requiring broader access may choose multi-user or enterprise licenses for cost-effective access to the report.
13. Are there any additional resources or data provided in the Vetronics Industry report?
While the report offers comprehensive insights, it's advisable to review the specific contents or supplementary materials provided to ascertain if additional resources or data are available.
14. How can I stay updated on further developments or reports in the Vetronics Industry?
To stay informed about further developments, trends, and reports in the Vetronics Industry, consider subscribing to industry newsletters, following relevant companies and organizations, or regularly checking reputable industry news sources and publications.
Methodology
Step 1 - Identification of Relevant Samples Size from Population Database


Step 2 - Approaches for Defining Global Market Size (Value, Volume* & Price*)

Note*: In applicable scenarios
Step 3 - Data Sources
Primary Research
- Web Analytics
- Survey Reports
- Research Institute
- Latest Research Reports
- Opinion Leaders
Secondary Research
- Annual Reports
- White Paper
- Latest Press Release
- Industry Association
- Paid Database
- Investor Presentations

Step 4 - Data Triangulation
Involves using different sources of information in order to increase the validity of a study
These sources are likely to be stakeholders in a program - participants, other researchers, program staff, other community members, and so on.
Then we put all data in single framework & apply various statistical tools to find out the dynamic on the market.
During the analysis stage, feedback from the stakeholder groups would be compared to determine areas of agreement as well as areas of divergence