

Key Insights
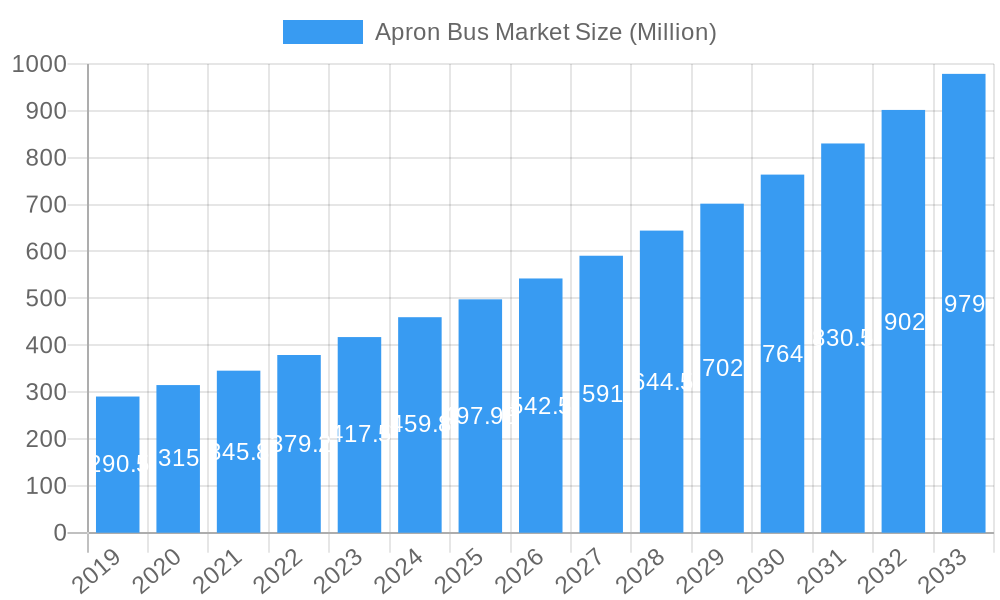
The global Apron Bus Market is poised for robust growth, projected to reach a significant valuation with an estimated market size of USD 497.98 million by 2025. This expansion is driven by an impressive Compound Annual Growth Rate (CAGR) of 10.77%, indicating a dynamic and expanding industry landscape. A primary catalyst for this growth is the increasing global air passenger traffic, which necessitates greater efficiency and capacity at airports for passenger boarding and disembarking. Investments in airport infrastructure development worldwide, particularly in emerging economies, are a key driver, leading to the adoption of modern apron bus fleets. Furthermore, the rising demand for eco-friendly and sustainable transportation solutions within airport environments fuels the adoption of electric and hybrid apron buses, aligning with global environmental regulations and corporate social responsibility initiatives. The market is also benefiting from technological advancements in apron bus design, focusing on enhanced passenger comfort, safety features, and improved operational efficiency for ground handling services.
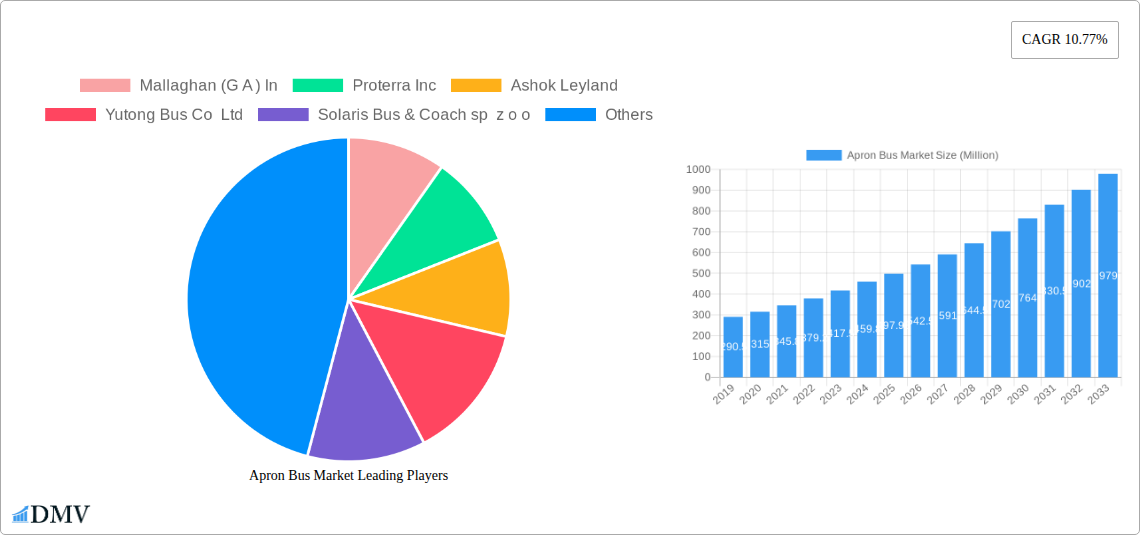
Apron Bus Market Market Size (In Million)
The market's trajectory is further shaped by emerging trends such as the increasing integration of smart technologies for real-time tracking and management of apron bus operations, leading to optimized turnaround times and reduced operational costs. The growing emphasis on passenger experience is also pushing manufacturers to develop more comfortable and accessible apron bus models. However, the market faces certain restraints, including the high initial capital investment required for acquiring advanced apron bus fleets, especially for electric variants. Stringent regulatory frameworks and the need for specialized charging infrastructure for electric apron buses can also pose challenges. Despite these hurdles, the consistent growth in air travel and ongoing airport modernization projects are expected to create substantial opportunities for market players. Key regions like Asia Pacific and Europe are anticipated to lead in terms of demand and innovation, with North America also demonstrating steady expansion.
Apron Bus Market Company Market Share
This in-depth Apron Bus Market report provides a meticulous examination of the global apron bus sector, encompassing a detailed analysis from 2019 to 2033, with a base year of 2025 and a forecast period extending to 2033. We delve into production and consumption trends, import and export dynamics (value and volume), and crucial price trajectories. The report also highlights key industry developments and strategic market forecasts, offering unparalleled insights for stakeholders seeking to navigate the evolving landscape of airport ground transportation solutions. This analysis is critical for understanding the electric apron bus market, airport shuttle bus demand, and decarbonization of aviation logistics.
Apron Bus Market Market Composition & Trends
The apron bus market exhibits a moderate concentration, driven by a confluence of technological innovation, stringent regulatory mandates, and increasing airport infrastructure development worldwide. Key innovation catalysts include the push for zero-emission airport vehicles, advancements in battery technology for electric apron buses, and the integration of smart features for enhanced passenger experience and operational efficiency. The regulatory landscape is increasingly favoring greener alternatives, compelling airport authorities and operators to invest in eco-friendly apron buses. While traditional diesel apron buses remain in play, the threat of substitution by electric and hybrid models is substantial, impacting long-term market share. End-users predominantly comprise international airports, private jet terminals, and large airline ground operations seeking reliable and efficient passenger and crew transportation. Mergers and acquisitions (M&A) are strategically shaping the market, with significant deal values driven by companies aiming to expand their product portfolios and geographical reach in the airport ground support equipment (GSE) sector. Expected M&A deal values are in the range of $50 Million to $200 Million.
- Market Share Distribution: The market is characterized by a mix of established global players and emerging regional manufacturers, with top players holding approximately 55% of the market share.
- Key Trends:
- Dominance of electric apron bus solutions.
- Increasing demand for high-capacity airport buses.
- Focus on passenger comfort and accessibility.
- Integration of telematics and fleet management systems.
Apron Bus Market Industry Evolution
The apron bus market has undergone a significant transformation, evolving from primarily diesel-powered fleets to a strong inclination towards sustainable and technologically advanced solutions. Over the historical period (2019-2024), the market witnessed a steady growth trajectory, fueled by increased air travel and the subsequent need for efficient ground transportation within airport perimeters. The base year 2025 marks a pivotal point, with the global apron bus market poised for accelerated growth, driven by a confluence of factors. Technological advancements have been instrumental, with the development of lighter materials, more efficient electric powertrains, and enhanced battery management systems enabling longer ranges and faster charging times for airport electric buses. Consumer demand has shifted considerably, with a growing emphasis on environmental responsibility and passenger comfort. This has led to a significant surge in the adoption of low-emission apron buses and vehicles equipped with modern amenities. The projected market growth rate from 2025 to 2033 is an estimated 8.5% CAGR. Adoption metrics for electric apron buses are expected to reach 60% by 2030.
- Market Growth Trajectories: The market is projected to expand from an estimated $1.2 Billion in 2025 to over $2.3 Billion by 2033, reflecting a robust upward trend.
- Technological Advancements: Innovations in battery technology, autonomous driving capabilities, and advanced driver-assistance systems (ADAS) are continuously reshaping the industry.
- Shifting Consumer Demands: Passengers and airport operators alike are prioritizing sustainability, safety, and passenger experience, driving demand for premium, eco-friendly apron buses.
Leading Regions, Countries, or Segments in Apron Bus Market
North America, particularly the United States, currently dominates the apron bus market owing to its extensive network of large international airports and significant investments in airport infrastructure upgrades. This dominance is evident across all analyzed segments: Production Analysis, Consumption Analysis, Import Market Analysis, Export Market Analysis, and Price Trend Analysis.
Production Analysis: North American manufacturers, backed by strong R&D capabilities and a high demand for technologically advanced vehicles, lead in the production of sophisticated apron buses, including a significant share of electric apron bus manufacturing. Countries like the US and Canada are at the forefront.
Consumption Analysis: Airports across North America, driven by passenger volume and regulatory pressures for cleaner operations, represent the largest consumer base for apron buses. The demand for airport shuttle bus services is particularly high.
Import Market Analysis (Value & Volume): While North America is a major producer, it also imports specialized components and high-end electric apron buses to meet specific operational needs. The import value is estimated to be around $300 Million in 2025, with an import volume of approximately 1,200 units.
Export Market Analysis (Value & Volume): North American manufacturers also export a substantial number of apron buses, especially to regions undergoing rapid airport development. The export value is projected at $450 Million in 2025, with an export volume of around 1,800 units.
Price Trend Analysis: The price trend in North America reflects a premium for advanced features, electric powertrains, and higher capacity vehicles. The average price for a new apron bus ranges from $350,000 to $800,000, with electric variants often commanding a higher initial investment.
- Key Drivers of Dominance in North America:
- Significant airport expansion and modernization projects.
- Government incentives for electric vehicle adoption.
- High passenger traffic necessitating efficient ground transportation.
- Presence of leading apron bus manufacturers and technology providers.
Apron Bus Market Product Innovations
Product innovations in the apron bus market are primarily focused on enhancing sustainability, efficiency, and passenger experience. The development of lightweight composite materials for bus bodies reduces energy consumption, while advanced lithium-ion battery technologies are extending the operational range of electric apron buses to over 200 km on a single charge. Many new models incorporate flexible seating configurations to accommodate varied passenger needs, from crew transport to large passenger groups. Intelligent route optimization software and real-time passenger information systems are also becoming standard, improving operational flow within airports. The unique selling proposition of newer models often lies in their zero-emission operation, quiet performance, and enhanced safety features, such as advanced braking systems and 360-degree camera views, contributing to a safer and more comfortable airport environment. The capacity of innovative apron buses ranges from 50 to 150 passengers.
Propelling Factors for Apron Bus Market Growth
The apron bus market is propelled by a confluence of powerful factors. The increasing global focus on sustainability and the decarbonization of aviation are primary drivers, leading to a heightened demand for environmentally friendly airport vehicles, particularly electric apron buses. Government regulations and incentives promoting the adoption of zero-emission transport further accelerate this shift. Advancements in battery technology, enabling longer ranges and faster charging, are making electric apron buses a more viable and cost-effective option. Furthermore, the continuous growth in global air passenger traffic necessitates efficient and scalable ground transportation solutions within airports, driving the demand for modern and high-capacity apron buses.
Obstacles in the Apron Bus Market Market
Despite robust growth prospects, the apron bus market faces several obstacles. The high initial capital investment for electric apron buses compared to their diesel counterparts can be a significant barrier for some airport operators, particularly in developing economies. The availability of charging infrastructure at airports, while improving, can still be a limiting factor, requiring substantial investment in power grid upgrades. Supply chain disruptions for critical components, especially batteries, can impact production timelines and costs. Furthermore, the long lifespan of existing diesel apron buses may lead to slower fleet replacement cycles, posing a challenge to rapid market penetration of newer technologies.
Future Opportunities in Apron Bus Market
The apron bus market is ripe with future opportunities. The increasing number of new airport constructions and expansions globally presents a significant untapped market. The growing trend towards smart airports, integrating advanced technologies like IoT and AI for seamless operations, opens avenues for connected and autonomous apron bus solutions. The expansion of the electric apron bus market into emerging economies, coupled with potential government support, offers substantial growth potential. Furthermore, the development of specialized apron bus models for niche applications, such as cargo handling or specific maintenance operations, could create new market segments.
Major Players in the Apron Bus Market Ecosystem
- Mallaghan (G A ) In
- Proterra Inc
- Ashok Leyland
- Yutong Bus Co Ltd
- Solaris Bus & Coach sp z o o
- Xiamen King Long International Trading Co Ltd
- TAM - EUROPE
- AB Volvo (Volvo Group)
- COBUS Industries GmbH
- BYD Company Ltd
- Xinfa Airport Equipment Ltd
Key Developments in Apron Bus Market Industry
- August 2023: LSP Plus Corporation Announced a Five-Year Parking and Shuttle Operations Contract for the management of all public and employee parking facilities and public and employee shuttle service at Eppley Airport (OMA), US.
- July 2023: Busnex, an EU-based provider of green public transport solutions and part of Avia Solutions Group, launched a fully electric airport apron bus, 'DinoBus.' The bus is launched in line with the aviation industry's focus on decarbonizing operations. The 14 m bus includes a range of up to 150 km, can accommodate 120 passengers, and operates in a wide temperature range.
Strategic Apron Bus Market Market Forecast
The strategic apron bus market forecast indicates continued robust growth, driven by the accelerating global shift towards electrification and sustainability in the aviation sector. Key growth catalysts include ongoing airport modernization projects, supportive government policies for zero-emission airport vehicles, and technological advancements in battery and charging infrastructure. The increasing emphasis on operational efficiency and passenger experience will further fuel demand for intelligent and comfortable apron bus solutions. Emerging markets present significant untapped potential, especially with the growing awareness of environmental impact. The forecast period (2025-2033) is expected to witness a significant market expansion, with electric apron buses poised to capture a dominant market share, making this a crucial sector for investment and strategic planning.
Apron Bus Market Segmentation
- 1. Production Analysis
- 2. Consumption Analysis
- 3. Import Market Analysis (Value & Volume)
- 4. Export Market Analysis (Value & Volume)
- 5. Price Trend Analysis
Apron Bus Market Segmentation By Geography
-
1. North America
- 1.1. United States
- 1.2. Canada
- 1.3. Mexico
-
2. South America
- 2.1. Brazil
- 2.2. Argentina
- 2.3. Rest of South America
-
3. Europe
- 3.1. United Kingdom
- 3.2. Germany
- 3.3. France
- 3.4. Italy
- 3.5. Spain
- 3.6. Russia
- 3.7. Benelux
- 3.8. Nordics
- 3.9. Rest of Europe
-
4. Middle East & Africa
- 4.1. Turkey
- 4.2. Israel
- 4.3. GCC
- 4.4. North Africa
- 4.5. South Africa
- 4.6. Rest of Middle East & Africa
-
5. Asia Pacific
- 5.1. China
- 5.2. India
- 5.3. Japan
- 5.4. South Korea
- 5.5. ASEAN
- 5.6. Oceania
- 5.7. Rest of Asia Pacific
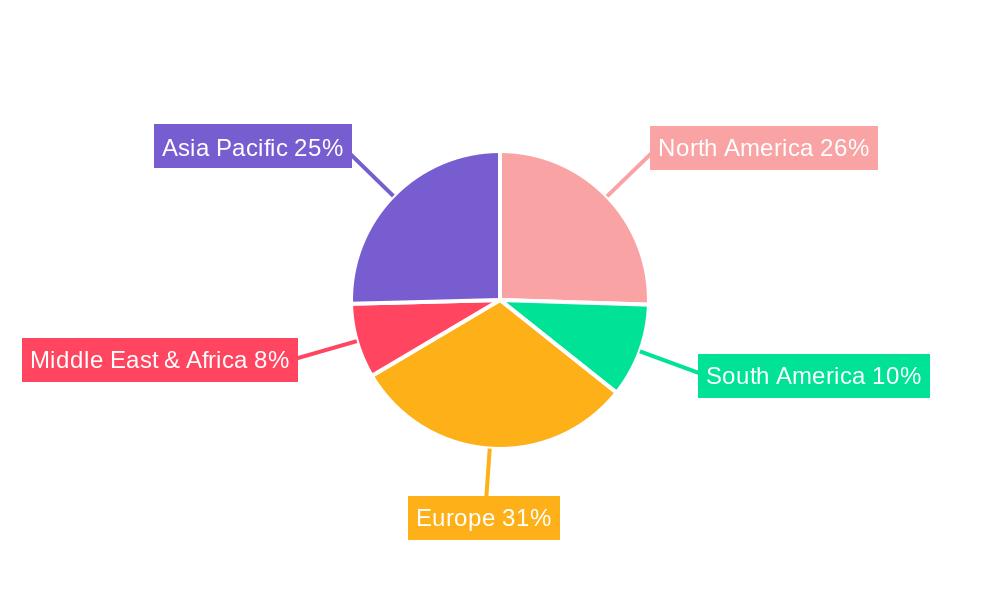
Apron Bus Market Regional Market Share
Geographic Coverage of Apron Bus Market
Apron Bus Market REPORT HIGHLIGHTS
| Aspects | Details |
|---|---|
| Study Period | 2020-2034 |
| Base Year | 2025 |
| Estimated Year | 2026 |
| Forecast Period | 2026-2034 |
| Historical Period | 2020-2025 |
| Growth Rate | CAGR of 10.77% from 2020-2034 |
| Segmentation |
|
Table of Contents
- 1. Introduction
- 1.1. Research Scope
- 1.2. Market Segmentation
- 1.3. Research Objective
- 1.4. Definitions and Assumptions
- 2. Executive Summary
- 2.1. Market Snapshot
- 3. Market Dynamics
- 3.1. Market Drivers
- 3.2. Market Restrains
- 3.3. Market Trends
- 3.4. Market Opportunities
- 4. Market Factor Analysis
- 4.1. Porters Five Forces
- 4.1.1. Bargaining Power of Suppliers
- 4.1.2. Bargaining Power of Buyers
- 4.1.3. Threat of New Entrants
- 4.1.4. Threat of Substitutes
- 4.1.5. Competitive Rivalry
- 4.2. PESTEL analysis
- 4.3. BCG Analysis
- 4.3.1. Stars (High Growth, High Market Share)
- 4.3.2. Cash Cows (Low Growth, High Market Share)
- 4.3.3. Question Mark (High Growth, Low Market Share)
- 4.3.4. Dogs (Low Growth, Low Market Share)
- 4.4. Ansoff Matrix Analysis
- 4.5. Supply Chain Analysis
- 4.6. Regulatory Landscape
- 4.7. Current Market Potential and Opportunity Assessment (TAM–SAM–SOM Framework)
- 4.8. DMV Analyst Note
- 4.1. Porters Five Forces
- 5. Market Analysis, Insights and Forecast 2021-2033
- 5.1. Market Analysis, Insights and Forecast - by Production Analysis
- 5.2. Market Analysis, Insights and Forecast - by Consumption Analysis
- 5.3. Market Analysis, Insights and Forecast - by Import Market Analysis (Value & Volume)
- 5.4. Market Analysis, Insights and Forecast - by Export Market Analysis (Value & Volume)
- 5.5. Market Analysis, Insights and Forecast - by Price Trend Analysis
- 5.6. Market Analysis, Insights and Forecast - by Region
- 5.6.1. North America
- 5.6.2. South America
- 5.6.3. Europe
- 5.6.4. Middle East & Africa
- 5.6.5. Asia Pacific
- 6. Global Apron Bus Market Analysis, Insights and Forecast, 2021-2033
- 6.1. Market Analysis, Insights and Forecast - by Production Analysis
- 6.2. Market Analysis, Insights and Forecast - by Consumption Analysis
- 6.3. Market Analysis, Insights and Forecast - by Import Market Analysis (Value & Volume)
- 6.4. Market Analysis, Insights and Forecast - by Export Market Analysis (Value & Volume)
- 6.5. Market Analysis, Insights and Forecast - by Price Trend Analysis
- 7. North America Apron Bus Market Analysis, Insights and Forecast, 2020-2032
- 7.1. Market Analysis, Insights and Forecast - by Production Analysis
- 7.2. Market Analysis, Insights and Forecast - by Consumption Analysis
- 7.3. Market Analysis, Insights and Forecast - by Import Market Analysis (Value & Volume)
- 7.4. Market Analysis, Insights and Forecast - by Export Market Analysis (Value & Volume)
- 7.5. Market Analysis, Insights and Forecast - by Price Trend Analysis
- 8. South America Apron Bus Market Analysis, Insights and Forecast, 2020-2032
- 8.1. Market Analysis, Insights and Forecast - by Production Analysis
- 8.2. Market Analysis, Insights and Forecast - by Consumption Analysis
- 8.3. Market Analysis, Insights and Forecast - by Import Market Analysis (Value & Volume)
- 8.4. Market Analysis, Insights and Forecast - by Export Market Analysis (Value & Volume)
- 8.5. Market Analysis, Insights and Forecast - by Price Trend Analysis
- 9. Europe Apron Bus Market Analysis, Insights and Forecast, 2020-2032
- 9.1. Market Analysis, Insights and Forecast - by Production Analysis
- 9.2. Market Analysis, Insights and Forecast - by Consumption Analysis
- 9.3. Market Analysis, Insights and Forecast - by Import Market Analysis (Value & Volume)
- 9.4. Market Analysis, Insights and Forecast - by Export Market Analysis (Value & Volume)
- 9.5. Market Analysis, Insights and Forecast - by Price Trend Analysis
- 10. Middle East & Africa Apron Bus Market Analysis, Insights and Forecast, 2020-2032
- 10.1. Market Analysis, Insights and Forecast - by Production Analysis
- 10.2. Market Analysis, Insights and Forecast - by Consumption Analysis
- 10.3. Market Analysis, Insights and Forecast - by Import Market Analysis (Value & Volume)
- 10.4. Market Analysis, Insights and Forecast - by Export Market Analysis (Value & Volume)
- 10.5. Market Analysis, Insights and Forecast - by Price Trend Analysis
- 11. Asia Pacific Apron Bus Market Analysis, Insights and Forecast, 2020-2032
- 11.1. Market Analysis, Insights and Forecast - by Production Analysis
- 11.2. Market Analysis, Insights and Forecast - by Consumption Analysis
- 11.3. Market Analysis, Insights and Forecast - by Import Market Analysis (Value & Volume)
- 11.4. Market Analysis, Insights and Forecast - by Export Market Analysis (Value & Volume)
- 11.5. Market Analysis, Insights and Forecast - by Price Trend Analysis
- 12. Competitive Analysis
- 12.1. Company Profiles
- 12.1.1 Mallaghan (G A ) In
- 12.1.1.1. Company Overview
- 12.1.1.2. Products
- 12.1.1.3. Company Financials
- 12.1.1.4. SWOT Analysis
- 12.1.2 Proterra Inc
- 12.1.2.1. Company Overview
- 12.1.2.2. Products
- 12.1.2.3. Company Financials
- 12.1.2.4. SWOT Analysis
- 12.1.3 Ashok Leyland
- 12.1.3.1. Company Overview
- 12.1.3.2. Products
- 12.1.3.3. Company Financials
- 12.1.3.4. SWOT Analysis
- 12.1.4 Yutong Bus Co Ltd
- 12.1.4.1. Company Overview
- 12.1.4.2. Products
- 12.1.4.3. Company Financials
- 12.1.4.4. SWOT Analysis
- 12.1.5 Solaris Bus & Coach sp z o o
- 12.1.5.1. Company Overview
- 12.1.5.2. Products
- 12.1.5.3. Company Financials
- 12.1.5.4. SWOT Analysis
- 12.1.6 Xiamen King Long International Trading Co Ltd
- 12.1.6.1. Company Overview
- 12.1.6.2. Products
- 12.1.6.3. Company Financials
- 12.1.6.4. SWOT Analysis
- 12.1.7 TAM - EUROPE
- 12.1.7.1. Company Overview
- 12.1.7.2. Products
- 12.1.7.3. Company Financials
- 12.1.7.4. SWOT Analysis
- 12.1.8 AB Volvo (Volvo Group)
- 12.1.8.1. Company Overview
- 12.1.8.2. Products
- 12.1.8.3. Company Financials
- 12.1.8.4. SWOT Analysis
- 12.1.9 COBUS Industries GmbH
- 12.1.9.1. Company Overview
- 12.1.9.2. Products
- 12.1.9.3. Company Financials
- 12.1.9.4. SWOT Analysis
- 12.1.10 BYD Company Ltd
- 12.1.10.1. Company Overview
- 12.1.10.2. Products
- 12.1.10.3. Company Financials
- 12.1.10.4. SWOT Analysis
- 12.1.11 Xinfa Airport Equipment Ltd
- 12.1.11.1. Company Overview
- 12.1.11.2. Products
- 12.1.11.3. Company Financials
- 12.1.11.4. SWOT Analysis
- 12.1.1 Mallaghan (G A ) In
- 12.2. Market Entropy
- 12.2.1 Company's Key Areas Served
- 12.2.2 Recent Developments
- 12.3. Company Market Share Analysis 2025
- 12.3.1 Top 5 Companies Market Share Analysis
- 12.3.2 Top 3 Companies Market Share Analysis
- 12.4. List of Potential Customers
- 13. Research Methodology
List of Figures
- Figure 1: Global Apron Bus Market Revenue Breakdown (million, %) by Region 2025 & 2033
- Figure 2: North America Apron Bus Market Revenue (million), by Production Analysis 2025 & 2033
- Figure 3: North America Apron Bus Market Revenue Share (%), by Production Analysis 2025 & 2033
- Figure 4: North America Apron Bus Market Revenue (million), by Consumption Analysis 2025 & 2033
- Figure 5: North America Apron Bus Market Revenue Share (%), by Consumption Analysis 2025 & 2033
- Figure 6: North America Apron Bus Market Revenue (million), by Import Market Analysis (Value & Volume) 2025 & 2033
- Figure 7: North America Apron Bus Market Revenue Share (%), by Import Market Analysis (Value & Volume) 2025 & 2033
- Figure 8: North America Apron Bus Market Revenue (million), by Export Market Analysis (Value & Volume) 2025 & 2033
- Figure 9: North America Apron Bus Market Revenue Share (%), by Export Market Analysis (Value & Volume) 2025 & 2033
- Figure 10: North America Apron Bus Market Revenue (million), by Price Trend Analysis 2025 & 2033
- Figure 11: North America Apron Bus Market Revenue Share (%), by Price Trend Analysis 2025 & 2033
- Figure 12: North America Apron Bus Market Revenue (million), by Country 2025 & 2033
- Figure 13: North America Apron Bus Market Revenue Share (%), by Country 2025 & 2033
- Figure 14: South America Apron Bus Market Revenue (million), by Production Analysis 2025 & 2033
- Figure 15: South America Apron Bus Market Revenue Share (%), by Production Analysis 2025 & 2033
- Figure 16: South America Apron Bus Market Revenue (million), by Consumption Analysis 2025 & 2033
- Figure 17: South America Apron Bus Market Revenue Share (%), by Consumption Analysis 2025 & 2033
- Figure 18: South America Apron Bus Market Revenue (million), by Import Market Analysis (Value & Volume) 2025 & 2033
- Figure 19: South America Apron Bus Market Revenue Share (%), by Import Market Analysis (Value & Volume) 2025 & 2033
- Figure 20: South America Apron Bus Market Revenue (million), by Export Market Analysis (Value & Volume) 2025 & 2033
- Figure 21: South America Apron Bus Market Revenue Share (%), by Export Market Analysis (Value & Volume) 2025 & 2033
- Figure 22: South America Apron Bus Market Revenue (million), by Price Trend Analysis 2025 & 2033
- Figure 23: South America Apron Bus Market Revenue Share (%), by Price Trend Analysis 2025 & 2033
- Figure 24: South America Apron Bus Market Revenue (million), by Country 2025 & 2033
- Figure 25: South America Apron Bus Market Revenue Share (%), by Country 2025 & 2033
- Figure 26: Europe Apron Bus Market Revenue (million), by Production Analysis 2025 & 2033
- Figure 27: Europe Apron Bus Market Revenue Share (%), by Production Analysis 2025 & 2033
- Figure 28: Europe Apron Bus Market Revenue (million), by Consumption Analysis 2025 & 2033
- Figure 29: Europe Apron Bus Market Revenue Share (%), by Consumption Analysis 2025 & 2033
- Figure 30: Europe Apron Bus Market Revenue (million), by Import Market Analysis (Value & Volume) 2025 & 2033
- Figure 31: Europe Apron Bus Market Revenue Share (%), by Import Market Analysis (Value & Volume) 2025 & 2033
- Figure 32: Europe Apron Bus Market Revenue (million), by Export Market Analysis (Value & Volume) 2025 & 2033
- Figure 33: Europe Apron Bus Market Revenue Share (%), by Export Market Analysis (Value & Volume) 2025 & 2033
- Figure 34: Europe Apron Bus Market Revenue (million), by Price Trend Analysis 2025 & 2033
- Figure 35: Europe Apron Bus Market Revenue Share (%), by Price Trend Analysis 2025 & 2033
- Figure 36: Europe Apron Bus Market Revenue (million), by Country 2025 & 2033
- Figure 37: Europe Apron Bus Market Revenue Share (%), by Country 2025 & 2033
- Figure 38: Middle East & Africa Apron Bus Market Revenue (million), by Production Analysis 2025 & 2033
- Figure 39: Middle East & Africa Apron Bus Market Revenue Share (%), by Production Analysis 2025 & 2033
- Figure 40: Middle East & Africa Apron Bus Market Revenue (million), by Consumption Analysis 2025 & 2033
- Figure 41: Middle East & Africa Apron Bus Market Revenue Share (%), by Consumption Analysis 2025 & 2033
- Figure 42: Middle East & Africa Apron Bus Market Revenue (million), by Import Market Analysis (Value & Volume) 2025 & 2033
- Figure 43: Middle East & Africa Apron Bus Market Revenue Share (%), by Import Market Analysis (Value & Volume) 2025 & 2033
- Figure 44: Middle East & Africa Apron Bus Market Revenue (million), by Export Market Analysis (Value & Volume) 2025 & 2033
- Figure 45: Middle East & Africa Apron Bus Market Revenue Share (%), by Export Market Analysis (Value & Volume) 2025 & 2033
- Figure 46: Middle East & Africa Apron Bus Market Revenue (million), by Price Trend Analysis 2025 & 2033
- Figure 47: Middle East & Africa Apron Bus Market Revenue Share (%), by Price Trend Analysis 2025 & 2033
- Figure 48: Middle East & Africa Apron Bus Market Revenue (million), by Country 2025 & 2033
- Figure 49: Middle East & Africa Apron Bus Market Revenue Share (%), by Country 2025 & 2033
- Figure 50: Asia Pacific Apron Bus Market Revenue (million), by Production Analysis 2025 & 2033
- Figure 51: Asia Pacific Apron Bus Market Revenue Share (%), by Production Analysis 2025 & 2033
- Figure 52: Asia Pacific Apron Bus Market Revenue (million), by Consumption Analysis 2025 & 2033
- Figure 53: Asia Pacific Apron Bus Market Revenue Share (%), by Consumption Analysis 2025 & 2033
- Figure 54: Asia Pacific Apron Bus Market Revenue (million), by Import Market Analysis (Value & Volume) 2025 & 2033
- Figure 55: Asia Pacific Apron Bus Market Revenue Share (%), by Import Market Analysis (Value & Volume) 2025 & 2033
- Figure 56: Asia Pacific Apron Bus Market Revenue (million), by Export Market Analysis (Value & Volume) 2025 & 2033
- Figure 57: Asia Pacific Apron Bus Market Revenue Share (%), by Export Market Analysis (Value & Volume) 2025 & 2033
- Figure 58: Asia Pacific Apron Bus Market Revenue (million), by Price Trend Analysis 2025 & 2033
- Figure 59: Asia Pacific Apron Bus Market Revenue Share (%), by Price Trend Analysis 2025 & 2033
- Figure 60: Asia Pacific Apron Bus Market Revenue (million), by Country 2025 & 2033
- Figure 61: Asia Pacific Apron Bus Market Revenue Share (%), by Country 2025 & 2033
List of Tables
- Table 1: Global Apron Bus Market Revenue million Forecast, by Production Analysis 2020 & 2033
- Table 2: Global Apron Bus Market Revenue million Forecast, by Consumption Analysis 2020 & 2033
- Table 3: Global Apron Bus Market Revenue million Forecast, by Import Market Analysis (Value & Volume) 2020 & 2033
- Table 4: Global Apron Bus Market Revenue million Forecast, by Export Market Analysis (Value & Volume) 2020 & 2033
- Table 5: Global Apron Bus Market Revenue million Forecast, by Price Trend Analysis 2020 & 2033
- Table 6: Global Apron Bus Market Revenue million Forecast, by Region 2020 & 2033
- Table 7: Global Apron Bus Market Revenue million Forecast, by Production Analysis 2020 & 2033
- Table 8: Global Apron Bus Market Revenue million Forecast, by Consumption Analysis 2020 & 2033
- Table 9: Global Apron Bus Market Revenue million Forecast, by Import Market Analysis (Value & Volume) 2020 & 2033
- Table 10: Global Apron Bus Market Revenue million Forecast, by Export Market Analysis (Value & Volume) 2020 & 2033
- Table 11: Global Apron Bus Market Revenue million Forecast, by Price Trend Analysis 2020 & 2033
- Table 12: Global Apron Bus Market Revenue million Forecast, by Country 2020 & 2033
- Table 13: United States Apron Bus Market Revenue (million) Forecast, by Application 2020 & 2033
- Table 14: Canada Apron Bus Market Revenue (million) Forecast, by Application 2020 & 2033
- Table 15: Mexico Apron Bus Market Revenue (million) Forecast, by Application 2020 & 2033
- Table 16: Global Apron Bus Market Revenue million Forecast, by Production Analysis 2020 & 2033
- Table 17: Global Apron Bus Market Revenue million Forecast, by Consumption Analysis 2020 & 2033
- Table 18: Global Apron Bus Market Revenue million Forecast, by Import Market Analysis (Value & Volume) 2020 & 2033
- Table 19: Global Apron Bus Market Revenue million Forecast, by Export Market Analysis (Value & Volume) 2020 & 2033
- Table 20: Global Apron Bus Market Revenue million Forecast, by Price Trend Analysis 2020 & 2033
- Table 21: Global Apron Bus Market Revenue million Forecast, by Country 2020 & 2033
- Table 22: Brazil Apron Bus Market Revenue (million) Forecast, by Application 2020 & 2033
- Table 23: Argentina Apron Bus Market Revenue (million) Forecast, by Application 2020 & 2033
- Table 24: Rest of South America Apron Bus Market Revenue (million) Forecast, by Application 2020 & 2033
- Table 25: Global Apron Bus Market Revenue million Forecast, by Production Analysis 2020 & 2033
- Table 26: Global Apron Bus Market Revenue million Forecast, by Consumption Analysis 2020 & 2033
- Table 27: Global Apron Bus Market Revenue million Forecast, by Import Market Analysis (Value & Volume) 2020 & 2033
- Table 28: Global Apron Bus Market Revenue million Forecast, by Export Market Analysis (Value & Volume) 2020 & 2033
- Table 29: Global Apron Bus Market Revenue million Forecast, by Price Trend Analysis 2020 & 2033
- Table 30: Global Apron Bus Market Revenue million Forecast, by Country 2020 & 2033
- Table 31: United Kingdom Apron Bus Market Revenue (million) Forecast, by Application 2020 & 2033
- Table 32: Germany Apron Bus Market Revenue (million) Forecast, by Application 2020 & 2033
- Table 33: France Apron Bus Market Revenue (million) Forecast, by Application 2020 & 2033
- Table 34: Italy Apron Bus Market Revenue (million) Forecast, by Application 2020 & 2033
- Table 35: Spain Apron Bus Market Revenue (million) Forecast, by Application 2020 & 2033
- Table 36: Russia Apron Bus Market Revenue (million) Forecast, by Application 2020 & 2033
- Table 37: Benelux Apron Bus Market Revenue (million) Forecast, by Application 2020 & 2033
- Table 38: Nordics Apron Bus Market Revenue (million) Forecast, by Application 2020 & 2033
- Table 39: Rest of Europe Apron Bus Market Revenue (million) Forecast, by Application 2020 & 2033
- Table 40: Global Apron Bus Market Revenue million Forecast, by Production Analysis 2020 & 2033
- Table 41: Global Apron Bus Market Revenue million Forecast, by Consumption Analysis 2020 & 2033
- Table 42: Global Apron Bus Market Revenue million Forecast, by Import Market Analysis (Value & Volume) 2020 & 2033
- Table 43: Global Apron Bus Market Revenue million Forecast, by Export Market Analysis (Value & Volume) 2020 & 2033
- Table 44: Global Apron Bus Market Revenue million Forecast, by Price Trend Analysis 2020 & 2033
- Table 45: Global Apron Bus Market Revenue million Forecast, by Country 2020 & 2033
- Table 46: Turkey Apron Bus Market Revenue (million) Forecast, by Application 2020 & 2033
- Table 47: Israel Apron Bus Market Revenue (million) Forecast, by Application 2020 & 2033
- Table 48: GCC Apron Bus Market Revenue (million) Forecast, by Application 2020 & 2033
- Table 49: North Africa Apron Bus Market Revenue (million) Forecast, by Application 2020 & 2033
- Table 50: South Africa Apron Bus Market Revenue (million) Forecast, by Application 2020 & 2033
- Table 51: Rest of Middle East & Africa Apron Bus Market Revenue (million) Forecast, by Application 2020 & 2033
- Table 52: Global Apron Bus Market Revenue million Forecast, by Production Analysis 2020 & 2033
- Table 53: Global Apron Bus Market Revenue million Forecast, by Consumption Analysis 2020 & 2033
- Table 54: Global Apron Bus Market Revenue million Forecast, by Import Market Analysis (Value & Volume) 2020 & 2033
- Table 55: Global Apron Bus Market Revenue million Forecast, by Export Market Analysis (Value & Volume) 2020 & 2033
- Table 56: Global Apron Bus Market Revenue million Forecast, by Price Trend Analysis 2020 & 2033
- Table 57: Global Apron Bus Market Revenue million Forecast, by Country 2020 & 2033
- Table 58: China Apron Bus Market Revenue (million) Forecast, by Application 2020 & 2033
- Table 59: India Apron Bus Market Revenue (million) Forecast, by Application 2020 & 2033
- Table 60: Japan Apron Bus Market Revenue (million) Forecast, by Application 2020 & 2033
- Table 61: South Korea Apron Bus Market Revenue (million) Forecast, by Application 2020 & 2033
- Table 62: ASEAN Apron Bus Market Revenue (million) Forecast, by Application 2020 & 2033
- Table 63: Oceania Apron Bus Market Revenue (million) Forecast, by Application 2020 & 2033
- Table 64: Rest of Asia Pacific Apron Bus Market Revenue (million) Forecast, by Application 2020 & 2033
Frequently Asked Questions
1. What is the projected Compound Annual Growth Rate (CAGR) of the Apron Bus Market?
The projected CAGR is approximately 10.77%.
2. Which companies are prominent players in the Apron Bus Market?
Key companies in the market include Mallaghan (G A ) In, Proterra Inc, Ashok Leyland, Yutong Bus Co Ltd, Solaris Bus & Coach sp z o o, Xiamen King Long International Trading Co Ltd, TAM - EUROPE, AB Volvo (Volvo Group), COBUS Industries GmbH, BYD Company Ltd, Xinfa Airport Equipment Ltd.
3. What are the main segments of the Apron Bus Market?
The market segments include Production Analysis, Consumption Analysis, Import Market Analysis (Value & Volume), Export Market Analysis (Value & Volume), Price Trend Analysis.
4. Can you provide details about the market size?
The market size is estimated to be USD 551.61 million as of 2022.
5. What are some drivers contributing to market growth?
Increase in Internet of Things (IoT) and Autonomous Systems; Rise in Demand for Military and Defense Satellite Communication Solutions.
6. What are the notable trends driving market growth?
Electric Segment is Expected to Show Significant Growth During the Forecast Period.
7. Are there any restraints impacting market growth?
Cybersecurity Threats to Satellite Communication; Interference in Transmission of Data.
8. Can you provide examples of recent developments in the market?
August 2023: LSP Plus Corporation Announced a Five-Year Parking and Shuttle Operations Contract for the management of all public and employee parking facilities and public and employee shuttle service at Eppley Airport (OMA), US.
9. What pricing options are available for accessing the report?
Pricing options include single-user, multi-user, and enterprise licenses priced at USD 4750, USD 5250, and USD 8750 respectively.
10. Is the market size provided in terms of value or volume?
The market size is provided in terms of value, measured in million.
11. Are there any specific market keywords associated with the report?
Yes, the market keyword associated with the report is "Apron Bus Market," which aids in identifying and referencing the specific market segment covered.
12. How do I determine which pricing option suits my needs best?
The pricing options vary based on user requirements and access needs. Individual users may opt for single-user licenses, while businesses requiring broader access may choose multi-user or enterprise licenses for cost-effective access to the report.
13. Are there any additional resources or data provided in the Apron Bus Market report?
While the report offers comprehensive insights, it's advisable to review the specific contents or supplementary materials provided to ascertain if additional resources or data are available.
14. How can I stay updated on further developments or reports in the Apron Bus Market?
To stay informed about further developments, trends, and reports in the Apron Bus Market, consider subscribing to industry newsletters, following relevant companies and organizations, or regularly checking reputable industry news sources and publications.
Methodology
Step 1 - Identification of Relevant Samples Size from Population Database


Step 2 - Approaches for Defining Global Market Size (Value, Volume* & Price*)

Note*: In applicable scenarios
Step 3 - Data Sources
Primary Research
- Web Analytics
- Survey Reports
- Research Institute
- Latest Research Reports
- Opinion Leaders
Secondary Research
- Annual Reports
- White Paper
- Latest Press Release
- Industry Association
- Paid Database
- Investor Presentations

Step 4 - Data Triangulation
Involves using different sources of information in order to increase the validity of a study
These sources are likely to be stakeholders in a program - participants, other researchers, program staff, other community members, and so on.
Then we put all data in single framework & apply various statistical tools to find out the dynamic on the market.
During the analysis stage, feedback from the stakeholder groups would be compared to determine areas of agreement as well as areas of divergence