

Key Insights
The Military 3D and 4D Printing Industry is projected for significant expansion, expected to reach a market size of 307.72 million by 2025. This robust growth trajectory, with a Compound Annual Growth Rate (CAGR) of 40.9%, is driven by the defense sector's adoption of additive manufacturing for its inherent benefits. These include enhanced design flexibility, accelerated prototyping, efficient on-demand production of critical components, and substantial cost reduction opportunities. Key growth catalysts are the demand for advanced, high-performance materials offering superior durability and reduced weight for military platforms. Furthermore, the drive for operational efficiency, the logistical advantages of decentralized manufacturing, and the development of adaptive military equipment through 4D printing technologies are significant contributors. The industry is witnessing a fundamental shift towards bespoke solutions, facilitating the creation of highly specialized parts and equipment to meet precise mission requirements, thereby bolstering defense readiness and effectiveness.
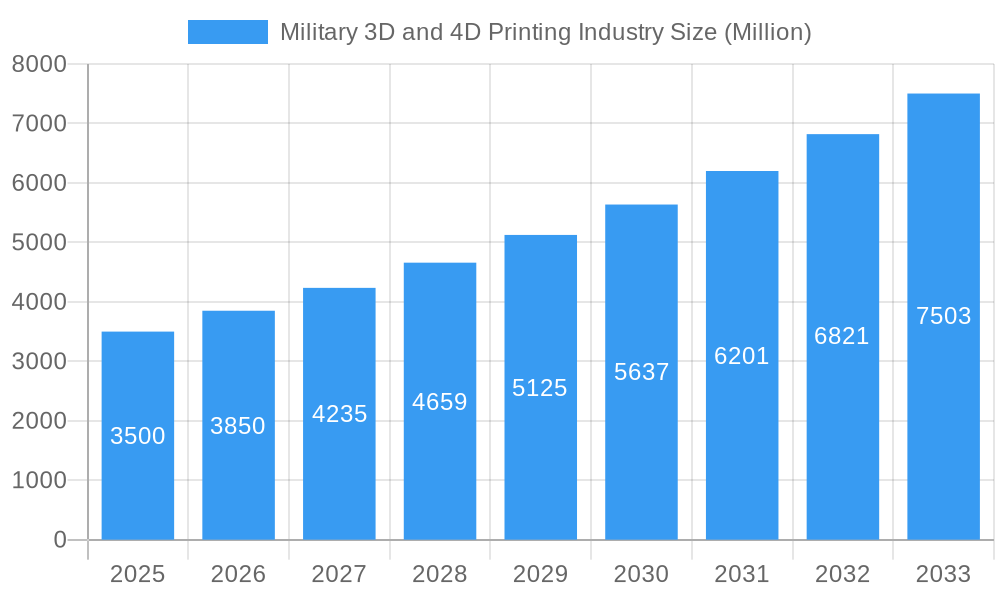
Military 3D and 4D Printing Industry Market Size (In Million)
Several key trends are shaping this dynamic market. The integration of Artificial Intelligence (AI) and Machine Learning (ML) into 3D printing processes is optimizing material deposition, defect identification, and design enhancement, resulting in higher quality and more reliable military components. Advancements in material science, particularly in high-strength alloys, ceramics, and composites, enable the production of lighter, stronger, and more resilient parts for aerospace, ground vehicles, and weaponry. The emergence of 4D printing, enabling printed objects to alter their form or properties in response to environmental stimuli, unlocks novel applications for adaptive camouflage, self-deploying structures, and responsive armor systems. However, challenges persist, including the high investment costs for specialized equipment and materials, stringent regulatory compliance for defense applications, and the necessity for a skilled workforce to manage these sophisticated systems. Despite these hurdles, the sustained demand for cutting-edge defense technologies and strategic modernization investments are anticipated to drive continued market growth.
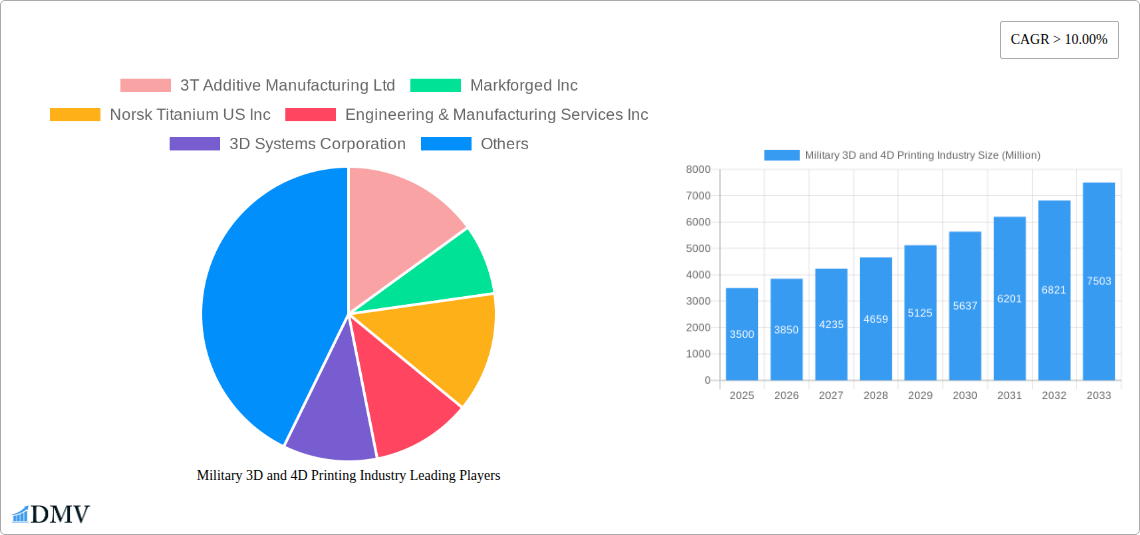
Military 3D and 4D Printing Industry Company Market Share
This comprehensive report delivers an in-depth analysis of the global Military 3D and 4D Printing Industry. Leveraging advanced additive manufacturing, the defense sector is undergoing a profound transformation, enhancing operational capabilities, optimizing costs, and accelerating innovation. Our study covers a detailed market assessment from 2019–2024 (Historical Period), with a base year of 2025 and a forecast period extending to 2033. We examine critical areas including production and consumption patterns, intricate import/export market dynamics, and essential price trend analysis.
Study Period: 2019–2033
Base Year: 2025
Forecast Period: 2025–2033
Historical Period: 2019–2024
Military 3D and 4D Printing Industry Market Composition & Trends
The Military 3D and 4D Printing Industry exhibits a dynamic market concentration, driven by continuous innovation in additive manufacturing materials and processes. Key catalysts for growth include the relentless pursuit of enhanced battlefield survivability, improved logistics, and cost-effective component production. Regulatory landscapes, though evolving, are largely supportive of adopting advanced manufacturing for defense applications, prioritizing security and interoperability. Substitute products are minimal given the unique capabilities of 3D and 4D printing for rapid prototyping, on-demand manufacturing, and complex geometries. End-user profiles span across air forces, navies, and armies, each seeking tailored solutions for aircraft parts, naval components, and ground vehicle upgrades. Mergers and acquisitions (M&A) activities are on the rise as established defense contractors and additive manufacturing leaders consolidate expertise and market share. For instance, M&A deal values are projected to reach over $500 Million in the forecast period. Market share distribution is influenced by technological leadership and strategic partnerships.
Military 3D and 4D Printing Industry Industry Evolution
The Military 3D and 4D Printing Industry has witnessed a remarkable evolution, characterized by accelerating growth trajectories and groundbreaking technological advancements. The adoption of additive manufacturing within defense is no longer an experimental phase but a critical component of modernization strategies. Market growth rates are robust, with an estimated Compound Annual Growth Rate (CAGR) of 18.5% projected for the forecast period. This expansion is fueled by the inherent advantages of 3D printing, including faster lead times for critical spare parts, enabling on-demand manufacturing closer to the point of need, thereby revolutionizing military logistics and reducing reliance on complex global supply chains. The ability to produce customized components, optimized for performance and weight, is a significant driver, particularly in aerospace and unmanned aerial vehicle (UAV) applications where lightweighting is paramount. Furthermore, the development of advanced materials, such as high-strength metal alloys and high-performance polymers, has enabled the creation of more durable and functional parts, pushing the boundaries of what can be achieved with additive manufacturing. The shift from prototyping to end-use part production is a key trend, with military organizations increasingly relying on 3D printing for serial production of components that were previously manufactured using traditional methods. This transition is supported by advancements in quality control and certification processes, ensuring that 3D-printed parts meet stringent military specifications. The emergence of 4D printing, where printed objects can change shape or function over time in response to external stimuli, opens up unprecedented possibilities for adaptive structures, self-healing components, and advanced protective gear, further solidifying the transformative impact of additive manufacturing on the defense sector. The overall adoption metrics are steadily increasing, with a significant percentage of defense budgets now allocated to research, development, and implementation of 3D and 4D printing technologies.
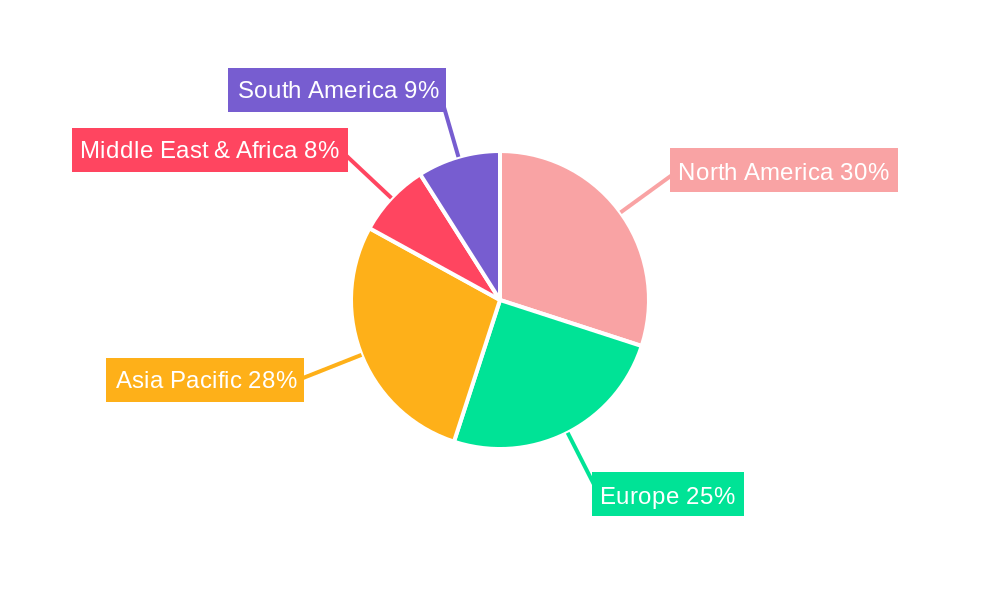
Leading Regions, Countries, or Segments in Military 3D and 4D Printing Industry
The United States is the dominant region in the Military 3D and 4D Printing Industry, consistently leading in Production Analysis, Consumption Analysis, Import Market Analysis, and Export Market Analysis. Its leadership is underpinned by substantial government investment in defense modernization, a thriving domestic additive manufacturing ecosystem, and robust R&D initiatives.
Production Analysis:
- High output of specialized defense components and advanced materials.
- Significant presence of leading additive manufacturing companies and research institutions.
- Focus on producing complex geometries and high-performance parts for various military platforms.
Consumption Analysis:
- Extensive adoption of 3D printing for spare parts, prototyping, and mission-critical components across all branches of the military.
- Growing demand for on-demand manufacturing capabilities to enhance operational readiness and reduce logistical burdens.
- Increased integration of 3D printing into maintenance, repair, and overhaul (MRO) operations.
Import Market Analysis (Value & Volume):
- Imports primarily consist of highly specialized raw materials and advanced printing systems not produced domestically.
- Value of imports is significant due to the high cost of cutting-edge additive manufacturing equipment and exotic materials.
- Volume of imports is managed to maintain technological superiority and strategic autonomy. For instance, import values are estimated to reach $800 Million annually, with a projected volume of 150,000 kg.
Export Market Analysis (Value & Volume):
- Exports are strategic, focusing on allied nations and partners requiring advanced defense technologies.
- Emphasis on exporting intellectual property, specialized software, and high-value 3D printing services.
- Export values are projected to be around $600 Million annually, with a volume of 100,000 kg, reflecting a focus on high-value, low-volume specialized exports.
Price Trend Analysis:
- Prices for 3D printed military components are generally declining due to economies of scale and technological maturation.
- However, specialized materials and complex, low-volume production runs can command premium pricing.
- The cost savings from reduced lead times and inventory management often outweigh initial production costs.
Key Drivers of Dominance:
- Investment Trends: Significant R&D funding from the Department of Defense and DARPA fuels innovation and adoption.
- Regulatory Support: Favorable policies and standards development by organizations like ASTM International facilitate certification and integration.
- Technological Leadership: A robust industrial base and research institutions driving advancements in printing technologies, materials science, and software.
- Strategic Imperatives: The need for enhanced national security, rapid response capabilities, and supply chain resilience drives consistent demand.
Military 3D and 4D Printing Industry Product Innovations
Product innovations in the Military 3D and 4D Printing Industry are revolutionizing defense capabilities. Advancements include the development of lightweight, high-strength aerospace components manufactured with complex internal structures, reducing fuel consumption and increasing payload capacity. Furthermore, there's a surge in the creation of advanced soldier systems, such as personalized body armor and customized medical implants, designed for optimal fit and performance in extreme conditions. The integration of smart materials in 4D printing is enabling the development of adaptive camouflage, self-repairing structures, and responsive protective gear that can change properties in real-time, significantly enhancing survivability and mission effectiveness.
Propelling Factors for Military 3D and 4D Printing Industry Growth
The Military 3D and 4D Printing Industry's growth is propelled by several key factors. Technological advancements in high-speed printing, novel material development (e.g., advanced composites, refractory metals), and sophisticated design software are enabling the production of more complex and functional parts. Economic influences, particularly the drive for cost reduction and supply chain efficiency, are significant; on-demand printing reduces warehousing costs and eliminates lengthy lead times for critical spares. Regulatory support from government bodies and defense organizations, including the establishment of certification standards, further facilitates adoption. The increasing demand for customization and personalization for soldiers and equipment, coupled with the need for rapid prototyping and iteration during the defense acquisition process, are also major growth catalysts.
Obstacles in the Military 3D and 4D Printing Industry Market
Despite its immense potential, the Military 3D and 4D Printing Industry faces significant obstacles. Regulatory challenges surrounding the certification of 3D-printed parts for critical applications, ensuring consistent quality and safety, remain a hurdle. Supply chain disruptions, particularly in the availability of specialized raw materials and the cybersecurity of digital design files, pose a risk. High initial investment costs for advanced industrial-grade 3D printers and the need for skilled personnel to operate and maintain them can be prohibitive. Furthermore, intellectual property protection for sensitive defense designs is a critical concern, as is the scalability of production for mass deployment compared to traditional manufacturing methods.
Future Opportunities in Military 3D and 4D Printing Industry
Future opportunities in the Military 3D and 4D Printing Industry are vast and transformative. The expansion of on-demand manufacturing closer to operational theaters presents a significant opportunity to enhance logistical resilience and reduce deployment times. The integration of artificial intelligence (AI) and machine learning (ML) into the design and printing process promises to optimize component performance and accelerate innovation. The development of novel materials with enhanced properties, such as self-healing capabilities and advanced thermal management, will unlock new applications. Furthermore, the potential for disruptive battlefield logistics through mobile 3D printing units and the emergence of autonomous manufacturing systems represent significant future growth areas.
Major Players in the Military 3D and 4D Printing Industry Ecosystem
- 3T Additive Manufacturing Ltd
- Markforged Inc
- Norsk Titanium US Inc
- Engineering & Manufacturing Services Inc
- 3D Systems Corporation
- EOS Gmbh
- Nano Dimensions Ltd
- Stratasys Ltd
- ExOne Company
Key Developments in Military 3D and 4D Printing Industry Industry
- November 2022: 3D Systems and ALM announced their partnership to expand access to industry-leading 3D printing materials. The companies plan to accelerate material adoption and drive additive manufacturing industry growth by providing access to industry-leading 3D printing materials.
- September 2021: General Lattice, a digital manufacturing software firm, secured a contract from the US Army to develop a 3D-printed combat helmet with improved energy absorption.
Strategic Military 3D and 4D Printing Industry Market Forecast
The strategic Military 3D and 4D Printing Industry market forecast indicates a period of robust growth and transformative adoption. Key growth catalysts include the ongoing digitization of defense supply chains, driving demand for on-demand manufacturing solutions. The continuous innovation in materials science and printing technologies will enable the creation of increasingly sophisticated and mission-critical components. The forecast also anticipates increased collaboration between government entities and private sector additive manufacturing leaders, fostering accelerated development and deployment of advanced capabilities. The market potential is immense, driven by the imperative for enhanced national security, improved operational readiness, and cost-effective modernization of military assets, making additive manufacturing a cornerstone of future defense strategies.
Military 3D and 4D Printing Industry Segmentation
- 1. Production Analysis
- 2. Consumption Analysis
- 3. Import Market Analysis (Value & Volume)
- 4. Export Market Analysis (Value & Volume)
- 5. Price Trend Analysis
Military 3D and 4D Printing Industry Segmentation By Geography
-
1. North America
- 1.1. United States
- 1.2. Canada
- 1.3. Mexico
-
2. South America
- 2.1. Brazil
- 2.2. Argentina
- 2.3. Rest of South America
-
3. Europe
- 3.1. United Kingdom
- 3.2. Germany
- 3.3. France
- 3.4. Italy
- 3.5. Spain
- 3.6. Russia
- 3.7. Benelux
- 3.8. Nordics
- 3.9. Rest of Europe
-
4. Middle East & Africa
- 4.1. Turkey
- 4.2. Israel
- 4.3. GCC
- 4.4. North Africa
- 4.5. South Africa
- 4.6. Rest of Middle East & Africa
-
5. Asia Pacific
- 5.1. China
- 5.2. India
- 5.3. Japan
- 5.4. South Korea
- 5.5. ASEAN
- 5.6. Oceania
- 5.7. Rest of Asia Pacific
Military 3D and 4D Printing Industry Regional Market Share
Geographic Coverage of Military 3D and 4D Printing Industry
Military 3D and 4D Printing Industry REPORT HIGHLIGHTS
| Aspects | Details |
|---|---|
| Study Period | 2020-2034 |
| Base Year | 2025 |
| Estimated Year | 2026 |
| Forecast Period | 2026-2034 |
| Historical Period | 2020-2025 |
| Growth Rate | CAGR of 35.8% from 2020-2034 |
| Segmentation |
|
Table of Contents
- 1. Introduction
- 1.1. Research Scope
- 1.2. Market Segmentation
- 1.3. Research Objective
- 1.4. Definitions and Assumptions
- 2. Executive Summary
- 2.1. Market Snapshot
- 3. Market Dynamics
- 3.1. Market Drivers
- 3.2. Market Restrains
- 3.3. Market Trends
- 3.4. Market Opportunities
- 4. Market Factor Analysis
- 4.1. Porters Five Forces
- 4.1.1. Bargaining Power of Suppliers
- 4.1.2. Bargaining Power of Buyers
- 4.1.3. Threat of New Entrants
- 4.1.4. Threat of Substitutes
- 4.1.5. Competitive Rivalry
- 4.2. PESTEL analysis
- 4.3. BCG Analysis
- 4.3.1. Stars (High Growth, High Market Share)
- 4.3.2. Cash Cows (Low Growth, High Market Share)
- 4.3.3. Question Mark (High Growth, Low Market Share)
- 4.3.4. Dogs (Low Growth, Low Market Share)
- 4.4. Ansoff Matrix Analysis
- 4.5. Supply Chain Analysis
- 4.6. Regulatory Landscape
- 4.7. Current Market Potential and Opportunity Assessment (TAM–SAM–SOM Framework)
- 4.8. DMV Analyst Note
- 4.1. Porters Five Forces
- 5. Market Analysis, Insights and Forecast 2021-2033
- 5.1. Market Analysis, Insights and Forecast - by Production Analysis
- 5.2. Market Analysis, Insights and Forecast - by Consumption Analysis
- 5.3. Market Analysis, Insights and Forecast - by Import Market Analysis (Value & Volume)
- 5.4. Market Analysis, Insights and Forecast - by Export Market Analysis (Value & Volume)
- 5.5. Market Analysis, Insights and Forecast - by Price Trend Analysis
- 5.6. Market Analysis, Insights and Forecast - by Region
- 5.6.1. North America
- 5.6.2. South America
- 5.6.3. Europe
- 5.6.4. Middle East & Africa
- 5.6.5. Asia Pacific
- 6. Global Military 3D and 4D Printing Industry Analysis, Insights and Forecast, 2021-2033
- 6.1. Market Analysis, Insights and Forecast - by Production Analysis
- 6.2. Market Analysis, Insights and Forecast - by Consumption Analysis
- 6.3. Market Analysis, Insights and Forecast - by Import Market Analysis (Value & Volume)
- 6.4. Market Analysis, Insights and Forecast - by Export Market Analysis (Value & Volume)
- 6.5. Market Analysis, Insights and Forecast - by Price Trend Analysis
- 7. North America Military 3D and 4D Printing Industry Analysis, Insights and Forecast, 2020-2032
- 7.1. Market Analysis, Insights and Forecast - by Production Analysis
- 7.2. Market Analysis, Insights and Forecast - by Consumption Analysis
- 7.3. Market Analysis, Insights and Forecast - by Import Market Analysis (Value & Volume)
- 7.4. Market Analysis, Insights and Forecast - by Export Market Analysis (Value & Volume)
- 7.5. Market Analysis, Insights and Forecast - by Price Trend Analysis
- 8. South America Military 3D and 4D Printing Industry Analysis, Insights and Forecast, 2020-2032
- 8.1. Market Analysis, Insights and Forecast - by Production Analysis
- 8.2. Market Analysis, Insights and Forecast - by Consumption Analysis
- 8.3. Market Analysis, Insights and Forecast - by Import Market Analysis (Value & Volume)
- 8.4. Market Analysis, Insights and Forecast - by Export Market Analysis (Value & Volume)
- 8.5. Market Analysis, Insights and Forecast - by Price Trend Analysis
- 9. Europe Military 3D and 4D Printing Industry Analysis, Insights and Forecast, 2020-2032
- 9.1. Market Analysis, Insights and Forecast - by Production Analysis
- 9.2. Market Analysis, Insights and Forecast - by Consumption Analysis
- 9.3. Market Analysis, Insights and Forecast - by Import Market Analysis (Value & Volume)
- 9.4. Market Analysis, Insights and Forecast - by Export Market Analysis (Value & Volume)
- 9.5. Market Analysis, Insights and Forecast - by Price Trend Analysis
- 10. Middle East & Africa Military 3D and 4D Printing Industry Analysis, Insights and Forecast, 2020-2032
- 10.1. Market Analysis, Insights and Forecast - by Production Analysis
- 10.2. Market Analysis, Insights and Forecast - by Consumption Analysis
- 10.3. Market Analysis, Insights and Forecast - by Import Market Analysis (Value & Volume)
- 10.4. Market Analysis, Insights and Forecast - by Export Market Analysis (Value & Volume)
- 10.5. Market Analysis, Insights and Forecast - by Price Trend Analysis
- 11. Asia Pacific Military 3D and 4D Printing Industry Analysis, Insights and Forecast, 2020-2032
- 11.1. Market Analysis, Insights and Forecast - by Production Analysis
- 11.2. Market Analysis, Insights and Forecast - by Consumption Analysis
- 11.3. Market Analysis, Insights and Forecast - by Import Market Analysis (Value & Volume)
- 11.4. Market Analysis, Insights and Forecast - by Export Market Analysis (Value & Volume)
- 11.5. Market Analysis, Insights and Forecast - by Price Trend Analysis
- 12. Competitive Analysis
- 12.1. Company Profiles
- 12.1.1 3T Additive Manufacturing Ltd
- 12.1.1.1. Company Overview
- 12.1.1.2. Products
- 12.1.1.3. Company Financials
- 12.1.1.4. SWOT Analysis
- 12.1.2 Markforged Inc
- 12.1.2.1. Company Overview
- 12.1.2.2. Products
- 12.1.2.3. Company Financials
- 12.1.2.4. SWOT Analysis
- 12.1.3 Norsk Titanium US Inc
- 12.1.3.1. Company Overview
- 12.1.3.2. Products
- 12.1.3.3. Company Financials
- 12.1.3.4. SWOT Analysis
- 12.1.4 Engineering & Manufacturing Services Inc
- 12.1.4.1. Company Overview
- 12.1.4.2. Products
- 12.1.4.3. Company Financials
- 12.1.4.4. SWOT Analysis
- 12.1.5 3D Systems Corporation
- 12.1.5.1. Company Overview
- 12.1.5.2. Products
- 12.1.5.3. Company Financials
- 12.1.5.4. SWOT Analysis
- 12.1.6 EOS Gmbh
- 12.1.6.1. Company Overview
- 12.1.6.2. Products
- 12.1.6.3. Company Financials
- 12.1.6.4. SWOT Analysis
- 12.1.7 Nano Dimensions Ltd
- 12.1.7.1. Company Overview
- 12.1.7.2. Products
- 12.1.7.3. Company Financials
- 12.1.7.4. SWOT Analysis
- 12.1.8 Stratasys Ltd
- 12.1.8.1. Company Overview
- 12.1.8.2. Products
- 12.1.8.3. Company Financials
- 12.1.8.4. SWOT Analysis
- 12.1.9 ExOne Company
- 12.1.9.1. Company Overview
- 12.1.9.2. Products
- 12.1.9.3. Company Financials
- 12.1.9.4. SWOT Analysis
- 12.1.1 3T Additive Manufacturing Ltd
- 12.2. Market Entropy
- 12.2.1 Company's Key Areas Served
- 12.2.2 Recent Developments
- 12.3. Company Market Share Analysis 2025
- 12.3.1 Top 5 Companies Market Share Analysis
- 12.3.2 Top 3 Companies Market Share Analysis
- 12.4. List of Potential Customers
- 13. Research Methodology
List of Figures
- Figure 1: Global Military 3D and 4D Printing Industry Revenue Breakdown (million, %) by Region 2025 & 2033
- Figure 2: North America Military 3D and 4D Printing Industry Revenue (million), by Production Analysis 2025 & 2033
- Figure 3: North America Military 3D and 4D Printing Industry Revenue Share (%), by Production Analysis 2025 & 2033
- Figure 4: North America Military 3D and 4D Printing Industry Revenue (million), by Consumption Analysis 2025 & 2033
- Figure 5: North America Military 3D and 4D Printing Industry Revenue Share (%), by Consumption Analysis 2025 & 2033
- Figure 6: North America Military 3D and 4D Printing Industry Revenue (million), by Import Market Analysis (Value & Volume) 2025 & 2033
- Figure 7: North America Military 3D and 4D Printing Industry Revenue Share (%), by Import Market Analysis (Value & Volume) 2025 & 2033
- Figure 8: North America Military 3D and 4D Printing Industry Revenue (million), by Export Market Analysis (Value & Volume) 2025 & 2033
- Figure 9: North America Military 3D and 4D Printing Industry Revenue Share (%), by Export Market Analysis (Value & Volume) 2025 & 2033
- Figure 10: North America Military 3D and 4D Printing Industry Revenue (million), by Price Trend Analysis 2025 & 2033
- Figure 11: North America Military 3D and 4D Printing Industry Revenue Share (%), by Price Trend Analysis 2025 & 2033
- Figure 12: North America Military 3D and 4D Printing Industry Revenue (million), by Country 2025 & 2033
- Figure 13: North America Military 3D and 4D Printing Industry Revenue Share (%), by Country 2025 & 2033
- Figure 14: South America Military 3D and 4D Printing Industry Revenue (million), by Production Analysis 2025 & 2033
- Figure 15: South America Military 3D and 4D Printing Industry Revenue Share (%), by Production Analysis 2025 & 2033
- Figure 16: South America Military 3D and 4D Printing Industry Revenue (million), by Consumption Analysis 2025 & 2033
- Figure 17: South America Military 3D and 4D Printing Industry Revenue Share (%), by Consumption Analysis 2025 & 2033
- Figure 18: South America Military 3D and 4D Printing Industry Revenue (million), by Import Market Analysis (Value & Volume) 2025 & 2033
- Figure 19: South America Military 3D and 4D Printing Industry Revenue Share (%), by Import Market Analysis (Value & Volume) 2025 & 2033
- Figure 20: South America Military 3D and 4D Printing Industry Revenue (million), by Export Market Analysis (Value & Volume) 2025 & 2033
- Figure 21: South America Military 3D and 4D Printing Industry Revenue Share (%), by Export Market Analysis (Value & Volume) 2025 & 2033
- Figure 22: South America Military 3D and 4D Printing Industry Revenue (million), by Price Trend Analysis 2025 & 2033
- Figure 23: South America Military 3D and 4D Printing Industry Revenue Share (%), by Price Trend Analysis 2025 & 2033
- Figure 24: South America Military 3D and 4D Printing Industry Revenue (million), by Country 2025 & 2033
- Figure 25: South America Military 3D and 4D Printing Industry Revenue Share (%), by Country 2025 & 2033
- Figure 26: Europe Military 3D and 4D Printing Industry Revenue (million), by Production Analysis 2025 & 2033
- Figure 27: Europe Military 3D and 4D Printing Industry Revenue Share (%), by Production Analysis 2025 & 2033
- Figure 28: Europe Military 3D and 4D Printing Industry Revenue (million), by Consumption Analysis 2025 & 2033
- Figure 29: Europe Military 3D and 4D Printing Industry Revenue Share (%), by Consumption Analysis 2025 & 2033
- Figure 30: Europe Military 3D and 4D Printing Industry Revenue (million), by Import Market Analysis (Value & Volume) 2025 & 2033
- Figure 31: Europe Military 3D and 4D Printing Industry Revenue Share (%), by Import Market Analysis (Value & Volume) 2025 & 2033
- Figure 32: Europe Military 3D and 4D Printing Industry Revenue (million), by Export Market Analysis (Value & Volume) 2025 & 2033
- Figure 33: Europe Military 3D and 4D Printing Industry Revenue Share (%), by Export Market Analysis (Value & Volume) 2025 & 2033
- Figure 34: Europe Military 3D and 4D Printing Industry Revenue (million), by Price Trend Analysis 2025 & 2033
- Figure 35: Europe Military 3D and 4D Printing Industry Revenue Share (%), by Price Trend Analysis 2025 & 2033
- Figure 36: Europe Military 3D and 4D Printing Industry Revenue (million), by Country 2025 & 2033
- Figure 37: Europe Military 3D and 4D Printing Industry Revenue Share (%), by Country 2025 & 2033
- Figure 38: Middle East & Africa Military 3D and 4D Printing Industry Revenue (million), by Production Analysis 2025 & 2033
- Figure 39: Middle East & Africa Military 3D and 4D Printing Industry Revenue Share (%), by Production Analysis 2025 & 2033
- Figure 40: Middle East & Africa Military 3D and 4D Printing Industry Revenue (million), by Consumption Analysis 2025 & 2033
- Figure 41: Middle East & Africa Military 3D and 4D Printing Industry Revenue Share (%), by Consumption Analysis 2025 & 2033
- Figure 42: Middle East & Africa Military 3D and 4D Printing Industry Revenue (million), by Import Market Analysis (Value & Volume) 2025 & 2033
- Figure 43: Middle East & Africa Military 3D and 4D Printing Industry Revenue Share (%), by Import Market Analysis (Value & Volume) 2025 & 2033
- Figure 44: Middle East & Africa Military 3D and 4D Printing Industry Revenue (million), by Export Market Analysis (Value & Volume) 2025 & 2033
- Figure 45: Middle East & Africa Military 3D and 4D Printing Industry Revenue Share (%), by Export Market Analysis (Value & Volume) 2025 & 2033
- Figure 46: Middle East & Africa Military 3D and 4D Printing Industry Revenue (million), by Price Trend Analysis 2025 & 2033
- Figure 47: Middle East & Africa Military 3D and 4D Printing Industry Revenue Share (%), by Price Trend Analysis 2025 & 2033
- Figure 48: Middle East & Africa Military 3D and 4D Printing Industry Revenue (million), by Country 2025 & 2033
- Figure 49: Middle East & Africa Military 3D and 4D Printing Industry Revenue Share (%), by Country 2025 & 2033
- Figure 50: Asia Pacific Military 3D and 4D Printing Industry Revenue (million), by Production Analysis 2025 & 2033
- Figure 51: Asia Pacific Military 3D and 4D Printing Industry Revenue Share (%), by Production Analysis 2025 & 2033
- Figure 52: Asia Pacific Military 3D and 4D Printing Industry Revenue (million), by Consumption Analysis 2025 & 2033
- Figure 53: Asia Pacific Military 3D and 4D Printing Industry Revenue Share (%), by Consumption Analysis 2025 & 2033
- Figure 54: Asia Pacific Military 3D and 4D Printing Industry Revenue (million), by Import Market Analysis (Value & Volume) 2025 & 2033
- Figure 55: Asia Pacific Military 3D and 4D Printing Industry Revenue Share (%), by Import Market Analysis (Value & Volume) 2025 & 2033
- Figure 56: Asia Pacific Military 3D and 4D Printing Industry Revenue (million), by Export Market Analysis (Value & Volume) 2025 & 2033
- Figure 57: Asia Pacific Military 3D and 4D Printing Industry Revenue Share (%), by Export Market Analysis (Value & Volume) 2025 & 2033
- Figure 58: Asia Pacific Military 3D and 4D Printing Industry Revenue (million), by Price Trend Analysis 2025 & 2033
- Figure 59: Asia Pacific Military 3D and 4D Printing Industry Revenue Share (%), by Price Trend Analysis 2025 & 2033
- Figure 60: Asia Pacific Military 3D and 4D Printing Industry Revenue (million), by Country 2025 & 2033
- Figure 61: Asia Pacific Military 3D and 4D Printing Industry Revenue Share (%), by Country 2025 & 2033
List of Tables
- Table 1: Global Military 3D and 4D Printing Industry Revenue million Forecast, by Production Analysis 2020 & 2033
- Table 2: Global Military 3D and 4D Printing Industry Revenue million Forecast, by Consumption Analysis 2020 & 2033
- Table 3: Global Military 3D and 4D Printing Industry Revenue million Forecast, by Import Market Analysis (Value & Volume) 2020 & 2033
- Table 4: Global Military 3D and 4D Printing Industry Revenue million Forecast, by Export Market Analysis (Value & Volume) 2020 & 2033
- Table 5: Global Military 3D and 4D Printing Industry Revenue million Forecast, by Price Trend Analysis 2020 & 2033
- Table 6: Global Military 3D and 4D Printing Industry Revenue million Forecast, by Region 2020 & 2033
- Table 7: Global Military 3D and 4D Printing Industry Revenue million Forecast, by Production Analysis 2020 & 2033
- Table 8: Global Military 3D and 4D Printing Industry Revenue million Forecast, by Consumption Analysis 2020 & 2033
- Table 9: Global Military 3D and 4D Printing Industry Revenue million Forecast, by Import Market Analysis (Value & Volume) 2020 & 2033
- Table 10: Global Military 3D and 4D Printing Industry Revenue million Forecast, by Export Market Analysis (Value & Volume) 2020 & 2033
- Table 11: Global Military 3D and 4D Printing Industry Revenue million Forecast, by Price Trend Analysis 2020 & 2033
- Table 12: Global Military 3D and 4D Printing Industry Revenue million Forecast, by Country 2020 & 2033
- Table 13: United States Military 3D and 4D Printing Industry Revenue (million) Forecast, by Application 2020 & 2033
- Table 14: Canada Military 3D and 4D Printing Industry Revenue (million) Forecast, by Application 2020 & 2033
- Table 15: Mexico Military 3D and 4D Printing Industry Revenue (million) Forecast, by Application 2020 & 2033
- Table 16: Global Military 3D and 4D Printing Industry Revenue million Forecast, by Production Analysis 2020 & 2033
- Table 17: Global Military 3D and 4D Printing Industry Revenue million Forecast, by Consumption Analysis 2020 & 2033
- Table 18: Global Military 3D and 4D Printing Industry Revenue million Forecast, by Import Market Analysis (Value & Volume) 2020 & 2033
- Table 19: Global Military 3D and 4D Printing Industry Revenue million Forecast, by Export Market Analysis (Value & Volume) 2020 & 2033
- Table 20: Global Military 3D and 4D Printing Industry Revenue million Forecast, by Price Trend Analysis 2020 & 2033
- Table 21: Global Military 3D and 4D Printing Industry Revenue million Forecast, by Country 2020 & 2033
- Table 22: Brazil Military 3D and 4D Printing Industry Revenue (million) Forecast, by Application 2020 & 2033
- Table 23: Argentina Military 3D and 4D Printing Industry Revenue (million) Forecast, by Application 2020 & 2033
- Table 24: Rest of South America Military 3D and 4D Printing Industry Revenue (million) Forecast, by Application 2020 & 2033
- Table 25: Global Military 3D and 4D Printing Industry Revenue million Forecast, by Production Analysis 2020 & 2033
- Table 26: Global Military 3D and 4D Printing Industry Revenue million Forecast, by Consumption Analysis 2020 & 2033
- Table 27: Global Military 3D and 4D Printing Industry Revenue million Forecast, by Import Market Analysis (Value & Volume) 2020 & 2033
- Table 28: Global Military 3D and 4D Printing Industry Revenue million Forecast, by Export Market Analysis (Value & Volume) 2020 & 2033
- Table 29: Global Military 3D and 4D Printing Industry Revenue million Forecast, by Price Trend Analysis 2020 & 2033
- Table 30: Global Military 3D and 4D Printing Industry Revenue million Forecast, by Country 2020 & 2033
- Table 31: United Kingdom Military 3D and 4D Printing Industry Revenue (million) Forecast, by Application 2020 & 2033
- Table 32: Germany Military 3D and 4D Printing Industry Revenue (million) Forecast, by Application 2020 & 2033
- Table 33: France Military 3D and 4D Printing Industry Revenue (million) Forecast, by Application 2020 & 2033
- Table 34: Italy Military 3D and 4D Printing Industry Revenue (million) Forecast, by Application 2020 & 2033
- Table 35: Spain Military 3D and 4D Printing Industry Revenue (million) Forecast, by Application 2020 & 2033
- Table 36: Russia Military 3D and 4D Printing Industry Revenue (million) Forecast, by Application 2020 & 2033
- Table 37: Benelux Military 3D and 4D Printing Industry Revenue (million) Forecast, by Application 2020 & 2033
- Table 38: Nordics Military 3D and 4D Printing Industry Revenue (million) Forecast, by Application 2020 & 2033
- Table 39: Rest of Europe Military 3D and 4D Printing Industry Revenue (million) Forecast, by Application 2020 & 2033
- Table 40: Global Military 3D and 4D Printing Industry Revenue million Forecast, by Production Analysis 2020 & 2033
- Table 41: Global Military 3D and 4D Printing Industry Revenue million Forecast, by Consumption Analysis 2020 & 2033
- Table 42: Global Military 3D and 4D Printing Industry Revenue million Forecast, by Import Market Analysis (Value & Volume) 2020 & 2033
- Table 43: Global Military 3D and 4D Printing Industry Revenue million Forecast, by Export Market Analysis (Value & Volume) 2020 & 2033
- Table 44: Global Military 3D and 4D Printing Industry Revenue million Forecast, by Price Trend Analysis 2020 & 2033
- Table 45: Global Military 3D and 4D Printing Industry Revenue million Forecast, by Country 2020 & 2033
- Table 46: Turkey Military 3D and 4D Printing Industry Revenue (million) Forecast, by Application 2020 & 2033
- Table 47: Israel Military 3D and 4D Printing Industry Revenue (million) Forecast, by Application 2020 & 2033
- Table 48: GCC Military 3D and 4D Printing Industry Revenue (million) Forecast, by Application 2020 & 2033
- Table 49: North Africa Military 3D and 4D Printing Industry Revenue (million) Forecast, by Application 2020 & 2033
- Table 50: South Africa Military 3D and 4D Printing Industry Revenue (million) Forecast, by Application 2020 & 2033
- Table 51: Rest of Middle East & Africa Military 3D and 4D Printing Industry Revenue (million) Forecast, by Application 2020 & 2033
- Table 52: Global Military 3D and 4D Printing Industry Revenue million Forecast, by Production Analysis 2020 & 2033
- Table 53: Global Military 3D and 4D Printing Industry Revenue million Forecast, by Consumption Analysis 2020 & 2033
- Table 54: Global Military 3D and 4D Printing Industry Revenue million Forecast, by Import Market Analysis (Value & Volume) 2020 & 2033
- Table 55: Global Military 3D and 4D Printing Industry Revenue million Forecast, by Export Market Analysis (Value & Volume) 2020 & 2033
- Table 56: Global Military 3D and 4D Printing Industry Revenue million Forecast, by Price Trend Analysis 2020 & 2033
- Table 57: Global Military 3D and 4D Printing Industry Revenue million Forecast, by Country 2020 & 2033
- Table 58: China Military 3D and 4D Printing Industry Revenue (million) Forecast, by Application 2020 & 2033
- Table 59: India Military 3D and 4D Printing Industry Revenue (million) Forecast, by Application 2020 & 2033
- Table 60: Japan Military 3D and 4D Printing Industry Revenue (million) Forecast, by Application 2020 & 2033
- Table 61: South Korea Military 3D and 4D Printing Industry Revenue (million) Forecast, by Application 2020 & 2033
- Table 62: ASEAN Military 3D and 4D Printing Industry Revenue (million) Forecast, by Application 2020 & 2033
- Table 63: Oceania Military 3D and 4D Printing Industry Revenue (million) Forecast, by Application 2020 & 2033
- Table 64: Rest of Asia Pacific Military 3D and 4D Printing Industry Revenue (million) Forecast, by Application 2020 & 2033
Frequently Asked Questions
1. What is the projected Compound Annual Growth Rate (CAGR) of the Military 3D and 4D Printing Industry?
The projected CAGR is approximately 35.8%.
2. Which companies are prominent players in the Military 3D and 4D Printing Industry?
Key companies in the market include 3T Additive Manufacturing Ltd, Markforged Inc, Norsk Titanium US Inc, Engineering & Manufacturing Services Inc, 3D Systems Corporation, EOS Gmbh, Nano Dimensions Ltd, Stratasys Ltd, ExOne Company.
3. What are the main segments of the Military 3D and 4D Printing Industry?
The market segments include Production Analysis, Consumption Analysis, Import Market Analysis (Value & Volume), Export Market Analysis (Value & Volume), Price Trend Analysis.
4. Can you provide details about the market size?
The market size is estimated to be USD 156.8 million as of 2022.
5. What are some drivers contributing to market growth?
N/A
6. What are the notable trends driving market growth?
Airborne Segment Held Highest Shares in the Market.
7. Are there any restraints impacting market growth?
N/A
8. Can you provide examples of recent developments in the market?
November 2022: 3D Systems and ALM announced their partnership to expand access to industry-leading 3D printing materials. The companies plan to accelerate material adoption and drive additive manufacturing industry growth by providing access to industry-leading 3D printing materials.
9. What pricing options are available for accessing the report?
Pricing options include single-user, multi-user, and enterprise licenses priced at USD 4750, USD 5250, and USD 8750 respectively.
10. Is the market size provided in terms of value or volume?
The market size is provided in terms of value, measured in million.
11. Are there any specific market keywords associated with the report?
Yes, the market keyword associated with the report is "Military 3D and 4D Printing Industry," which aids in identifying and referencing the specific market segment covered.
12. How do I determine which pricing option suits my needs best?
The pricing options vary based on user requirements and access needs. Individual users may opt for single-user licenses, while businesses requiring broader access may choose multi-user or enterprise licenses for cost-effective access to the report.
13. Are there any additional resources or data provided in the Military 3D and 4D Printing Industry report?
While the report offers comprehensive insights, it's advisable to review the specific contents or supplementary materials provided to ascertain if additional resources or data are available.
14. How can I stay updated on further developments or reports in the Military 3D and 4D Printing Industry?
To stay informed about further developments, trends, and reports in the Military 3D and 4D Printing Industry, consider subscribing to industry newsletters, following relevant companies and organizations, or regularly checking reputable industry news sources and publications.
Methodology
Step 1 - Identification of Relevant Samples Size from Population Database


Step 2 - Approaches for Defining Global Market Size (Value, Volume* & Price*)

Note*: In applicable scenarios
Step 3 - Data Sources
Primary Research
- Web Analytics
- Survey Reports
- Research Institute
- Latest Research Reports
- Opinion Leaders
Secondary Research
- Annual Reports
- White Paper
- Latest Press Release
- Industry Association
- Paid Database
- Investor Presentations

Step 4 - Data Triangulation
Involves using different sources of information in order to increase the validity of a study
These sources are likely to be stakeholders in a program - participants, other researchers, program staff, other community members, and so on.
Then we put all data in single framework & apply various statistical tools to find out the dynamic on the market.
During the analysis stage, feedback from the stakeholder groups would be compared to determine areas of agreement as well as areas of divergence