

Key Insights
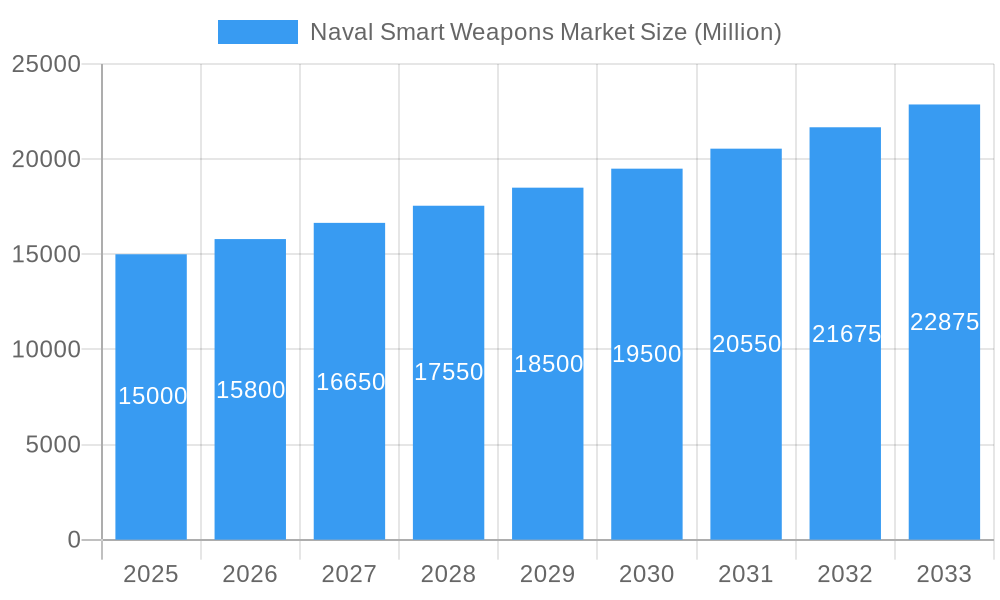
The global Naval Smart Weapons Market is projected to reach a size of $12.02 billion by 2025, driven by a significant CAGR of 7.75% during the forecast period of 2025-2033. Escalating geopolitical tensions, increased naval defense expenditure, and advancements in precision-guided and autonomous weapon systems are key growth catalysts. The demand for enhanced battlefield survivability and minimized collateral damage is fueling the adoption of smart naval weapon technologies. The integration of AI and advanced sensor technology further expands market opportunities, improving target identification, tracking, and engagement. The market shows strong demand for sophisticated missile, torpedo, and gun systems offering superior accuracy, extended range, and multi-target engagement.
Naval Smart Weapons Market Market Size (In Billion)
Key factors driving this market's expansion include substantial national investments in modernizing naval fleets with cutting-edge smart weaponry to counter emerging threats such as advanced submarines, surface vessels, and airborne adversaries. The development of hypersonic missiles, advanced anti-ship missiles, and smart torpedoes are central to these modernization efforts. Networked warfare capabilities, enabling smart weapons to coordinate with other assets, are also amplifying their effectiveness. However, high research and development costs and stringent defense equipment regulations present market restraints. Nevertheless, the persistent requirement for superior naval deterrence and power projection ensures sustained demand for these advanced systems, positioning the Naval Smart Weapons Market as a critical sector in global defense.
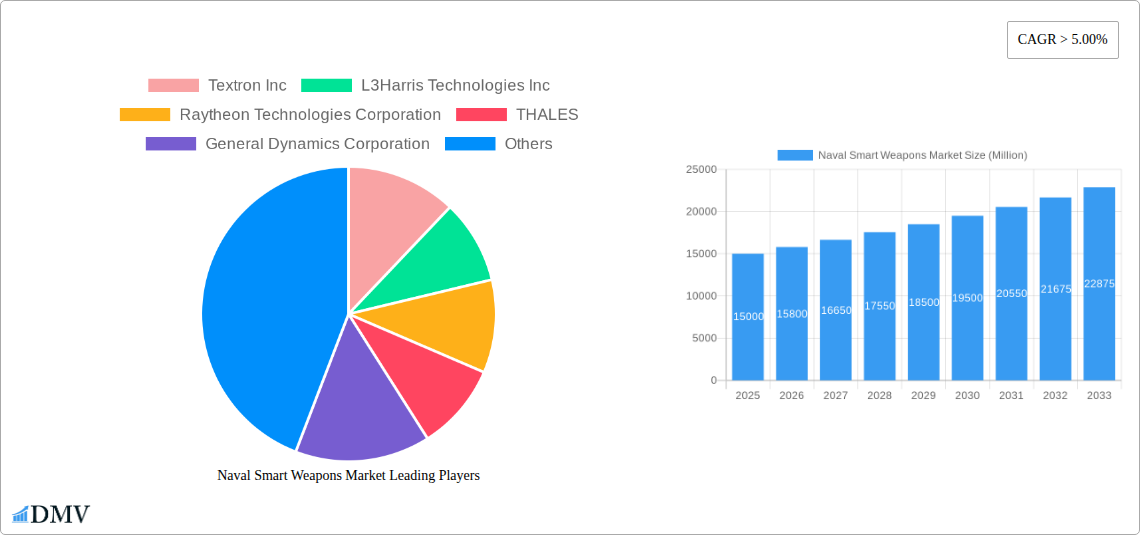
Naval Smart Weapons Market Company Market Share
Gain comprehensive market intelligence on production, consumption, trade, pricing, and technological advancements in the Naval Smart Weapons Market from 2019 to 2033. This report provides actionable insights for strategic decision-making in the dynamic maritime defense sector. The analysis covers a study period of 2019–2033, with 2025 as the base year and estimated year, and a forecast period of 2025–2033, building upon historical data from 2019–2024.
Naval Smart Weapons Market Market Composition & Trends
The Naval Smart Weapons Market exhibits a moderate concentration, driven by a handful of global defense giants and a growing number of specialized technology firms. Innovation catalysts are primarily fueled by the escalating geopolitical tensions, increasing demand for precision-guided munitions, and the imperative for enhanced maritime security. Regulatory landscapes are robust, with stringent export controls and national security directives shaping market access and development. Substitute products, though present in conventional weaponry, are increasingly challenged by the superior accuracy and reduced collateral damage offered by smart naval weapon systems. End-user profiles are dominated by national navies, coast guards, and maritime security agencies, all seeking advanced capabilities for deterrence, defense, and power projection. Mergers & Acquisitions (M&A) activities are significant, as key players consolidate their portfolios and acquire niche technologies. For instance, the consolidation of major defense contractors has led to enhanced R&D capabilities and expanded market reach. Estimated M&A deal values in the broader defense sector often run into billions of USD, indicating substantial strategic investments in advanced weapon systems.
Naval Smart Weapons Market Industry Evolution
The Naval Smart Weapons Market is undergoing a profound transformation, propelled by a confluence of technological breakthroughs and shifting strategic priorities. Throughout the historical period (2019–2024), the market witnessed consistent growth, driven by the modernization of naval fleets worldwide and the increasing integration of artificial intelligence and advanced sensor technologies into weapon platforms. The estimated growth rate for the naval smart weapons sector is projected to be in the mid-single digits annually during the forecast period (2025–2033), reflecting sustained demand for sophisticated defense solutions. Technological advancements are at the forefront of this evolution, with a notable surge in the development and deployment of smart missiles, guided torpedoes, anti-ship missiles, and increasingly, directed energy weapons. The adoption metrics for smart munitions are exceptionally high, as navies prioritize precision strikes and enhanced survivability. Furthermore, the integration of AI-powered targeting systems and network-centric warfare capabilities is revolutionizing combat effectiveness. Consumer demand is increasingly focused on multi-role capabilities, miniaturization for unmanned platforms, and cost-effective yet highly lethal solutions. The increasing complexity of maritime threats, from asymmetric warfare to peer-to-peer competition, necessitates the adoption of advanced naval smart weapons to maintain strategic superiority. The market's trajectory is also influenced by the continuous need to counter evolving adversary capabilities, fostering an environment of perpetual innovation and adaptation.
Leading Regions, Countries, or Segments in Naval Smart Weapons Market
The Naval Smart Weapons Market sees North America, specifically the United States, as the dominant region in terms of production and consumption analysis. This dominance is underpinned by substantial government investment in defense, the presence of leading defense contractors, and a forward-leaning approach to technological adoption.
- Production Analysis: The United States leads global naval smart weapons production, fueled by companies like Lockheed Martin Corporation, Raytheon Technologies Corporation, Northrop Grumman Corporation, and The Boeing Company. Their extensive R&D budgets and established manufacturing infrastructure ensure a consistent output of advanced systems.
- Consumption Analysis: The U.S. Navy, as the world's largest naval force, represents the most significant consumer. Other major consumers include European nations and rapidly modernizing Asian navies. The demand is driven by the need to counter emerging threats and maintain technological superiority.
- Import Market Analysis (Value & Volume): While the U.S. is a net exporter, other nations heavily rely on imports to bolster their naval capabilities. Key importing regions include Europe, the Middle East, and Southeast Asia. The import market value is estimated in the billions of USD annually, with volumes varying based on the type of weapon system. For example, in 2025, the estimated import market value for naval smart weapons could reach USD 15,000 million.
- Export Market Analysis (Value & Volume): The United States is the primary exporter of naval smart weapons, followed by European consortiums like MBDA and BAE Systems plc. Export market value in 2025 is projected to be around USD 12,000 million, with volumes dictated by geopolitical alliances and defense agreements.
- Price Trend Analysis: The price of naval smart weapons varies significantly based on complexity, range, and payload. While advanced anti-ship missiles can range from USD 500,000 to several million USD, sophisticated torpedoes and cruise missiles command even higher figures. The overall price trend is upward, influenced by technological advancements, inflation, and raw material costs.
Naval Smart Weapons Market Product Innovations
Product innovations in the Naval Smart Weapons Market are characterized by enhanced autonomy, precision, and multi-domain integration. The development of hypersonic missiles capable of evading current defenses, advanced anti-submarine warfare (ASW) weapons with improved detection capabilities, and intelligent munitions with real-time target updating are key advancements. Innovations also focus on miniaturization for deployment on unmanned surface and underwater vehicles (USVs/UUVs), expanding the operational reach and survivability of naval forces. The integration of AI algorithms for superior target recognition and threat assessment is a significant performance metric, minimizing collateral damage and maximizing mission effectiveness.
Propelling Factors for Naval Smart Weapons Market Growth
Several factors are propelling the Naval Smart Weapons Market growth. Increased geopolitical instability and the rise of maritime territorial disputes necessitate robust naval defense capabilities. Significant government investments in naval modernization programs worldwide are a primary driver. Technological advancements, particularly in areas like artificial intelligence, guidance systems, and propulsion, are creating more sophisticated and effective weapon platforms. Furthermore, the growing emphasis on power projection and maritime security by global navies directly fuels demand for advanced naval smart weapons. The increasing adoption of unmanned maritime systems also drives the development of specialized smart munitions for these platforms.
Obstacles in the Naval Smart Weapons Market Market
Despite the promising growth, the Naval Smart Weapons Market faces several obstacles. Stringent export control regulations and international treaties can limit market access and proliferation. The high cost of research, development, and production of these advanced systems represents a significant financial barrier for many nations. Supply chain disruptions, particularly for specialized components and raw materials, can impact production timelines and costs. Intense competition among major defense contractors and the potential for technological obsolescence due to rapid innovation also pose challenges. The complexity of integrating new weapon systems with existing naval platforms can also lead to prolonged development and deployment phases.
Future Opportunities in Naval Smart Weapons Market
Emerging opportunities in the Naval Smart Weapons Market lie in the development of cyber-resilient weapons systems, capable of operating in contested electronic warfare environments. The growing demand for anti-drone naval weaponry presents a significant new market segment. The expansion of unmanned maritime systems opens avenues for compact, intelligent munitions tailored for these platforms. Furthermore, the increasing focus on autonomous naval operations will drive demand for smart weapons with advanced AI capabilities. Partnerships between traditional defense contractors and emerging technology companies can unlock novel solutions.
Major Players in the Naval Smart Weapons Market Ecosystem
- Textron Inc
- L3Harris Technologies Inc
- Raytheon Technologies Corporation
- THALES
- General Dynamics Corporation
- Rheinmetall AG
- Lockheed Martin Corporation
- MBDA
- Leonardo S p A
- BAE Systems plc
- Northrop Grumman Corporation
- The Boeing Company
Key Developments in Naval Smart Weapons Market Industry
- February 2023: The US Navy placed an order worth USD 92 million for weapon assemblies for LAIRCM missile-defense systems with Northrop Grumman Corporation. This development underscores the ongoing investment in advanced defensive capabilities.
- November 2022: The German Navy successfully tested its first high-energy laser weapon, the frigate Sachsen, against drones in the Baltic Sea. The laser weapon demonstrator was developed by the High-Energy Laser Naval Demonstrator working committee, signaling a move towards directed energy weapons in naval warfare.
Strategic Naval Smart Weapons Market Market Forecast
The strategic Naval Smart Weapons Market forecast anticipates sustained growth driven by escalating global defense expenditures and an unwavering demand for advanced maritime security. The proliferation of emerging technologies like artificial intelligence and directed energy weapons will redefine combat effectiveness, creating new market niches. Furthermore, the ongoing modernization of naval fleets across major economies, coupled with the increasing threat landscape, ensures a robust pipeline of opportunities for sophisticated naval smart weapon systems. The market is poised for innovation and expansion, with a clear emphasis on precision, autonomy, and network-centric integration.
Naval Smart Weapons Market Segmentation
- 1. Production Analysis
- 2. Consumption Analysis
- 3. Import Market Analysis (Value & Volume)
- 4. Export Market Analysis (Value & Volume)
- 5. Price Trend Analysis
Naval Smart Weapons Market Segmentation By Geography
-
1. North America
- 1.1. United States
- 1.2. Canada
- 1.3. Mexico
-
2. South America
- 2.1. Brazil
- 2.2. Argentina
- 2.3. Rest of South America
-
3. Europe
- 3.1. United Kingdom
- 3.2. Germany
- 3.3. France
- 3.4. Italy
- 3.5. Spain
- 3.6. Russia
- 3.7. Benelux
- 3.8. Nordics
- 3.9. Rest of Europe
-
4. Middle East & Africa
- 4.1. Turkey
- 4.2. Israel
- 4.3. GCC
- 4.4. North Africa
- 4.5. South Africa
- 4.6. Rest of Middle East & Africa
-
5. Asia Pacific
- 5.1. China
- 5.2. India
- 5.3. Japan
- 5.4. South Korea
- 5.5. ASEAN
- 5.6. Oceania
- 5.7. Rest of Asia Pacific
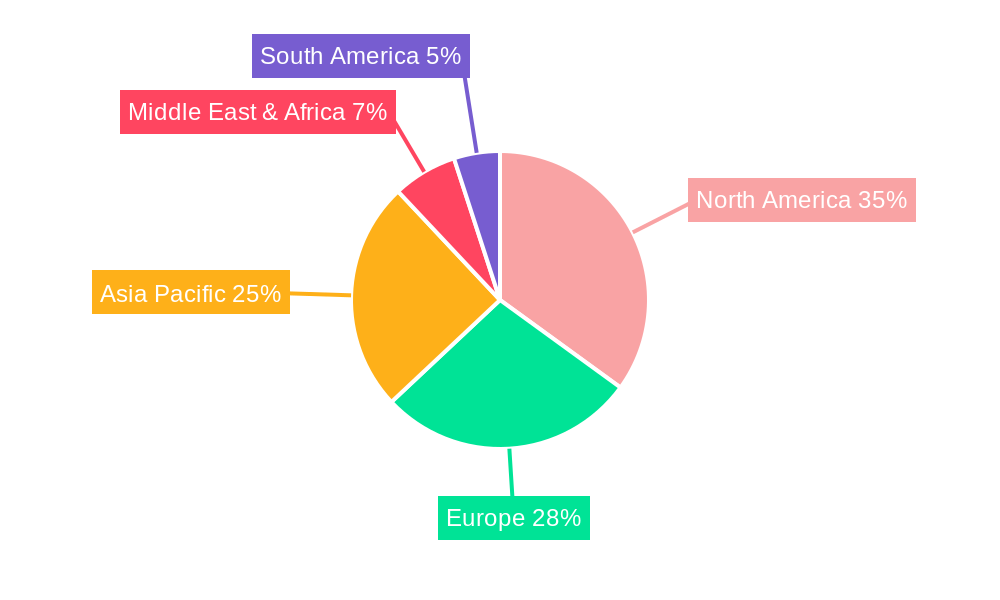
Naval Smart Weapons Market Regional Market Share
Geographic Coverage of Naval Smart Weapons Market
Naval Smart Weapons Market REPORT HIGHLIGHTS
| Aspects | Details |
|---|---|
| Study Period | 2020-2034 |
| Base Year | 2025 |
| Estimated Year | 2026 |
| Forecast Period | 2026-2034 |
| Historical Period | 2020-2025 |
| Growth Rate | CAGR of 7.75% from 2020-2034 |
| Segmentation |
|
Table of Contents
- 1. Introduction
- 1.1. Research Scope
- 1.2. Market Segmentation
- 1.3. Research Objective
- 1.4. Definitions and Assumptions
- 2. Executive Summary
- 2.1. Market Snapshot
- 3. Market Dynamics
- 3.1. Market Drivers
- 3.2. Market Restrains
- 3.3. Market Trends
- 3.4. Market Opportunities
- 4. Market Factor Analysis
- 4.1. Porters Five Forces
- 4.1.1. Bargaining Power of Suppliers
- 4.1.2. Bargaining Power of Buyers
- 4.1.3. Threat of New Entrants
- 4.1.4. Threat of Substitutes
- 4.1.5. Competitive Rivalry
- 4.2. PESTEL analysis
- 4.3. BCG Analysis
- 4.3.1. Stars (High Growth, High Market Share)
- 4.3.2. Cash Cows (Low Growth, High Market Share)
- 4.3.3. Question Mark (High Growth, Low Market Share)
- 4.3.4. Dogs (Low Growth, Low Market Share)
- 4.4. Ansoff Matrix Analysis
- 4.5. Supply Chain Analysis
- 4.6. Regulatory Landscape
- 4.7. Current Market Potential and Opportunity Assessment (TAM–SAM–SOM Framework)
- 4.8. DMV Analyst Note
- 4.1. Porters Five Forces
- 5. Market Analysis, Insights and Forecast 2021-2033
- 5.1. Market Analysis, Insights and Forecast - by Production Analysis
- 5.2. Market Analysis, Insights and Forecast - by Consumption Analysis
- 5.3. Market Analysis, Insights and Forecast - by Import Market Analysis (Value & Volume)
- 5.4. Market Analysis, Insights and Forecast - by Export Market Analysis (Value & Volume)
- 5.5. Market Analysis, Insights and Forecast - by Price Trend Analysis
- 5.6. Market Analysis, Insights and Forecast - by Region
- 5.6.1. North America
- 5.6.2. South America
- 5.6.3. Europe
- 5.6.4. Middle East & Africa
- 5.6.5. Asia Pacific
- 6. Global Naval Smart Weapons Market Analysis, Insights and Forecast, 2021-2033
- 6.1. Market Analysis, Insights and Forecast - by Production Analysis
- 6.2. Market Analysis, Insights and Forecast - by Consumption Analysis
- 6.3. Market Analysis, Insights and Forecast - by Import Market Analysis (Value & Volume)
- 6.4. Market Analysis, Insights and Forecast - by Export Market Analysis (Value & Volume)
- 6.5. Market Analysis, Insights and Forecast - by Price Trend Analysis
- 7. North America Naval Smart Weapons Market Analysis, Insights and Forecast, 2020-2032
- 7.1. Market Analysis, Insights and Forecast - by Production Analysis
- 7.2. Market Analysis, Insights and Forecast - by Consumption Analysis
- 7.3. Market Analysis, Insights and Forecast - by Import Market Analysis (Value & Volume)
- 7.4. Market Analysis, Insights and Forecast - by Export Market Analysis (Value & Volume)
- 7.5. Market Analysis, Insights and Forecast - by Price Trend Analysis
- 8. South America Naval Smart Weapons Market Analysis, Insights and Forecast, 2020-2032
- 8.1. Market Analysis, Insights and Forecast - by Production Analysis
- 8.2. Market Analysis, Insights and Forecast - by Consumption Analysis
- 8.3. Market Analysis, Insights and Forecast - by Import Market Analysis (Value & Volume)
- 8.4. Market Analysis, Insights and Forecast - by Export Market Analysis (Value & Volume)
- 8.5. Market Analysis, Insights and Forecast - by Price Trend Analysis
- 9. Europe Naval Smart Weapons Market Analysis, Insights and Forecast, 2020-2032
- 9.1. Market Analysis, Insights and Forecast - by Production Analysis
- 9.2. Market Analysis, Insights and Forecast - by Consumption Analysis
- 9.3. Market Analysis, Insights and Forecast - by Import Market Analysis (Value & Volume)
- 9.4. Market Analysis, Insights and Forecast - by Export Market Analysis (Value & Volume)
- 9.5. Market Analysis, Insights and Forecast - by Price Trend Analysis
- 10. Middle East & Africa Naval Smart Weapons Market Analysis, Insights and Forecast, 2020-2032
- 10.1. Market Analysis, Insights and Forecast - by Production Analysis
- 10.2. Market Analysis, Insights and Forecast - by Consumption Analysis
- 10.3. Market Analysis, Insights and Forecast - by Import Market Analysis (Value & Volume)
- 10.4. Market Analysis, Insights and Forecast - by Export Market Analysis (Value & Volume)
- 10.5. Market Analysis, Insights and Forecast - by Price Trend Analysis
- 11. Asia Pacific Naval Smart Weapons Market Analysis, Insights and Forecast, 2020-2032
- 11.1. Market Analysis, Insights and Forecast - by Production Analysis
- 11.2. Market Analysis, Insights and Forecast - by Consumption Analysis
- 11.3. Market Analysis, Insights and Forecast - by Import Market Analysis (Value & Volume)
- 11.4. Market Analysis, Insights and Forecast - by Export Market Analysis (Value & Volume)
- 11.5. Market Analysis, Insights and Forecast - by Price Trend Analysis
- 12. Competitive Analysis
- 12.1. Company Profiles
- 12.1.1 Textron Inc
- 12.1.1.1. Company Overview
- 12.1.1.2. Products
- 12.1.1.3. Company Financials
- 12.1.1.4. SWOT Analysis
- 12.1.2 L3Harris Technologies Inc
- 12.1.2.1. Company Overview
- 12.1.2.2. Products
- 12.1.2.3. Company Financials
- 12.1.2.4. SWOT Analysis
- 12.1.3 Raytheon Technologies Corporation
- 12.1.3.1. Company Overview
- 12.1.3.2. Products
- 12.1.3.3. Company Financials
- 12.1.3.4. SWOT Analysis
- 12.1.4 THALES
- 12.1.4.1. Company Overview
- 12.1.4.2. Products
- 12.1.4.3. Company Financials
- 12.1.4.4. SWOT Analysis
- 12.1.5 General Dynamics Corporation
- 12.1.5.1. Company Overview
- 12.1.5.2. Products
- 12.1.5.3. Company Financials
- 12.1.5.4. SWOT Analysis
- 12.1.6 Rheinmetall AG
- 12.1.6.1. Company Overview
- 12.1.6.2. Products
- 12.1.6.3. Company Financials
- 12.1.6.4. SWOT Analysis
- 12.1.7 Lockheed Martin Corporation
- 12.1.7.1. Company Overview
- 12.1.7.2. Products
- 12.1.7.3. Company Financials
- 12.1.7.4. SWOT Analysis
- 12.1.8 MBDA
- 12.1.8.1. Company Overview
- 12.1.8.2. Products
- 12.1.8.3. Company Financials
- 12.1.8.4. SWOT Analysis
- 12.1.9 Leonardo S p A
- 12.1.9.1. Company Overview
- 12.1.9.2. Products
- 12.1.9.3. Company Financials
- 12.1.9.4. SWOT Analysis
- 12.1.10 BAE Systems plc
- 12.1.10.1. Company Overview
- 12.1.10.2. Products
- 12.1.10.3. Company Financials
- 12.1.10.4. SWOT Analysis
- 12.1.11 Northrop Grumman Corporation
- 12.1.11.1. Company Overview
- 12.1.11.2. Products
- 12.1.11.3. Company Financials
- 12.1.11.4. SWOT Analysis
- 12.1.12 The Boeing Company
- 12.1.12.1. Company Overview
- 12.1.12.2. Products
- 12.1.12.3. Company Financials
- 12.1.12.4. SWOT Analysis
- 12.1.1 Textron Inc
- 12.2. Market Entropy
- 12.2.1 Company's Key Areas Served
- 12.2.2 Recent Developments
- 12.3. Company Market Share Analysis 2025
- 12.3.1 Top 5 Companies Market Share Analysis
- 12.3.2 Top 3 Companies Market Share Analysis
- 12.4. List of Potential Customers
- 13. Research Methodology
List of Figures
- Figure 1: Global Naval Smart Weapons Market Revenue Breakdown (billion, %) by Region 2025 & 2033
- Figure 2: North America Naval Smart Weapons Market Revenue (billion), by Production Analysis 2025 & 2033
- Figure 3: North America Naval Smart Weapons Market Revenue Share (%), by Production Analysis 2025 & 2033
- Figure 4: North America Naval Smart Weapons Market Revenue (billion), by Consumption Analysis 2025 & 2033
- Figure 5: North America Naval Smart Weapons Market Revenue Share (%), by Consumption Analysis 2025 & 2033
- Figure 6: North America Naval Smart Weapons Market Revenue (billion), by Import Market Analysis (Value & Volume) 2025 & 2033
- Figure 7: North America Naval Smart Weapons Market Revenue Share (%), by Import Market Analysis (Value & Volume) 2025 & 2033
- Figure 8: North America Naval Smart Weapons Market Revenue (billion), by Export Market Analysis (Value & Volume) 2025 & 2033
- Figure 9: North America Naval Smart Weapons Market Revenue Share (%), by Export Market Analysis (Value & Volume) 2025 & 2033
- Figure 10: North America Naval Smart Weapons Market Revenue (billion), by Price Trend Analysis 2025 & 2033
- Figure 11: North America Naval Smart Weapons Market Revenue Share (%), by Price Trend Analysis 2025 & 2033
- Figure 12: North America Naval Smart Weapons Market Revenue (billion), by Country 2025 & 2033
- Figure 13: North America Naval Smart Weapons Market Revenue Share (%), by Country 2025 & 2033
- Figure 14: South America Naval Smart Weapons Market Revenue (billion), by Production Analysis 2025 & 2033
- Figure 15: South America Naval Smart Weapons Market Revenue Share (%), by Production Analysis 2025 & 2033
- Figure 16: South America Naval Smart Weapons Market Revenue (billion), by Consumption Analysis 2025 & 2033
- Figure 17: South America Naval Smart Weapons Market Revenue Share (%), by Consumption Analysis 2025 & 2033
- Figure 18: South America Naval Smart Weapons Market Revenue (billion), by Import Market Analysis (Value & Volume) 2025 & 2033
- Figure 19: South America Naval Smart Weapons Market Revenue Share (%), by Import Market Analysis (Value & Volume) 2025 & 2033
- Figure 20: South America Naval Smart Weapons Market Revenue (billion), by Export Market Analysis (Value & Volume) 2025 & 2033
- Figure 21: South America Naval Smart Weapons Market Revenue Share (%), by Export Market Analysis (Value & Volume) 2025 & 2033
- Figure 22: South America Naval Smart Weapons Market Revenue (billion), by Price Trend Analysis 2025 & 2033
- Figure 23: South America Naval Smart Weapons Market Revenue Share (%), by Price Trend Analysis 2025 & 2033
- Figure 24: South America Naval Smart Weapons Market Revenue (billion), by Country 2025 & 2033
- Figure 25: South America Naval Smart Weapons Market Revenue Share (%), by Country 2025 & 2033
- Figure 26: Europe Naval Smart Weapons Market Revenue (billion), by Production Analysis 2025 & 2033
- Figure 27: Europe Naval Smart Weapons Market Revenue Share (%), by Production Analysis 2025 & 2033
- Figure 28: Europe Naval Smart Weapons Market Revenue (billion), by Consumption Analysis 2025 & 2033
- Figure 29: Europe Naval Smart Weapons Market Revenue Share (%), by Consumption Analysis 2025 & 2033
- Figure 30: Europe Naval Smart Weapons Market Revenue (billion), by Import Market Analysis (Value & Volume) 2025 & 2033
- Figure 31: Europe Naval Smart Weapons Market Revenue Share (%), by Import Market Analysis (Value & Volume) 2025 & 2033
- Figure 32: Europe Naval Smart Weapons Market Revenue (billion), by Export Market Analysis (Value & Volume) 2025 & 2033
- Figure 33: Europe Naval Smart Weapons Market Revenue Share (%), by Export Market Analysis (Value & Volume) 2025 & 2033
- Figure 34: Europe Naval Smart Weapons Market Revenue (billion), by Price Trend Analysis 2025 & 2033
- Figure 35: Europe Naval Smart Weapons Market Revenue Share (%), by Price Trend Analysis 2025 & 2033
- Figure 36: Europe Naval Smart Weapons Market Revenue (billion), by Country 2025 & 2033
- Figure 37: Europe Naval Smart Weapons Market Revenue Share (%), by Country 2025 & 2033
- Figure 38: Middle East & Africa Naval Smart Weapons Market Revenue (billion), by Production Analysis 2025 & 2033
- Figure 39: Middle East & Africa Naval Smart Weapons Market Revenue Share (%), by Production Analysis 2025 & 2033
- Figure 40: Middle East & Africa Naval Smart Weapons Market Revenue (billion), by Consumption Analysis 2025 & 2033
- Figure 41: Middle East & Africa Naval Smart Weapons Market Revenue Share (%), by Consumption Analysis 2025 & 2033
- Figure 42: Middle East & Africa Naval Smart Weapons Market Revenue (billion), by Import Market Analysis (Value & Volume) 2025 & 2033
- Figure 43: Middle East & Africa Naval Smart Weapons Market Revenue Share (%), by Import Market Analysis (Value & Volume) 2025 & 2033
- Figure 44: Middle East & Africa Naval Smart Weapons Market Revenue (billion), by Export Market Analysis (Value & Volume) 2025 & 2033
- Figure 45: Middle East & Africa Naval Smart Weapons Market Revenue Share (%), by Export Market Analysis (Value & Volume) 2025 & 2033
- Figure 46: Middle East & Africa Naval Smart Weapons Market Revenue (billion), by Price Trend Analysis 2025 & 2033
- Figure 47: Middle East & Africa Naval Smart Weapons Market Revenue Share (%), by Price Trend Analysis 2025 & 2033
- Figure 48: Middle East & Africa Naval Smart Weapons Market Revenue (billion), by Country 2025 & 2033
- Figure 49: Middle East & Africa Naval Smart Weapons Market Revenue Share (%), by Country 2025 & 2033
- Figure 50: Asia Pacific Naval Smart Weapons Market Revenue (billion), by Production Analysis 2025 & 2033
- Figure 51: Asia Pacific Naval Smart Weapons Market Revenue Share (%), by Production Analysis 2025 & 2033
- Figure 52: Asia Pacific Naval Smart Weapons Market Revenue (billion), by Consumption Analysis 2025 & 2033
- Figure 53: Asia Pacific Naval Smart Weapons Market Revenue Share (%), by Consumption Analysis 2025 & 2033
- Figure 54: Asia Pacific Naval Smart Weapons Market Revenue (billion), by Import Market Analysis (Value & Volume) 2025 & 2033
- Figure 55: Asia Pacific Naval Smart Weapons Market Revenue Share (%), by Import Market Analysis (Value & Volume) 2025 & 2033
- Figure 56: Asia Pacific Naval Smart Weapons Market Revenue (billion), by Export Market Analysis (Value & Volume) 2025 & 2033
- Figure 57: Asia Pacific Naval Smart Weapons Market Revenue Share (%), by Export Market Analysis (Value & Volume) 2025 & 2033
- Figure 58: Asia Pacific Naval Smart Weapons Market Revenue (billion), by Price Trend Analysis 2025 & 2033
- Figure 59: Asia Pacific Naval Smart Weapons Market Revenue Share (%), by Price Trend Analysis 2025 & 2033
- Figure 60: Asia Pacific Naval Smart Weapons Market Revenue (billion), by Country 2025 & 2033
- Figure 61: Asia Pacific Naval Smart Weapons Market Revenue Share (%), by Country 2025 & 2033
List of Tables
- Table 1: Global Naval Smart Weapons Market Revenue billion Forecast, by Production Analysis 2020 & 2033
- Table 2: Global Naval Smart Weapons Market Revenue billion Forecast, by Consumption Analysis 2020 & 2033
- Table 3: Global Naval Smart Weapons Market Revenue billion Forecast, by Import Market Analysis (Value & Volume) 2020 & 2033
- Table 4: Global Naval Smart Weapons Market Revenue billion Forecast, by Export Market Analysis (Value & Volume) 2020 & 2033
- Table 5: Global Naval Smart Weapons Market Revenue billion Forecast, by Price Trend Analysis 2020 & 2033
- Table 6: Global Naval Smart Weapons Market Revenue billion Forecast, by Region 2020 & 2033
- Table 7: Global Naval Smart Weapons Market Revenue billion Forecast, by Production Analysis 2020 & 2033
- Table 8: Global Naval Smart Weapons Market Revenue billion Forecast, by Consumption Analysis 2020 & 2033
- Table 9: Global Naval Smart Weapons Market Revenue billion Forecast, by Import Market Analysis (Value & Volume) 2020 & 2033
- Table 10: Global Naval Smart Weapons Market Revenue billion Forecast, by Export Market Analysis (Value & Volume) 2020 & 2033
- Table 11: Global Naval Smart Weapons Market Revenue billion Forecast, by Price Trend Analysis 2020 & 2033
- Table 12: Global Naval Smart Weapons Market Revenue billion Forecast, by Country 2020 & 2033
- Table 13: United States Naval Smart Weapons Market Revenue (billion) Forecast, by Application 2020 & 2033
- Table 14: Canada Naval Smart Weapons Market Revenue (billion) Forecast, by Application 2020 & 2033
- Table 15: Mexico Naval Smart Weapons Market Revenue (billion) Forecast, by Application 2020 & 2033
- Table 16: Global Naval Smart Weapons Market Revenue billion Forecast, by Production Analysis 2020 & 2033
- Table 17: Global Naval Smart Weapons Market Revenue billion Forecast, by Consumption Analysis 2020 & 2033
- Table 18: Global Naval Smart Weapons Market Revenue billion Forecast, by Import Market Analysis (Value & Volume) 2020 & 2033
- Table 19: Global Naval Smart Weapons Market Revenue billion Forecast, by Export Market Analysis (Value & Volume) 2020 & 2033
- Table 20: Global Naval Smart Weapons Market Revenue billion Forecast, by Price Trend Analysis 2020 & 2033
- Table 21: Global Naval Smart Weapons Market Revenue billion Forecast, by Country 2020 & 2033
- Table 22: Brazil Naval Smart Weapons Market Revenue (billion) Forecast, by Application 2020 & 2033
- Table 23: Argentina Naval Smart Weapons Market Revenue (billion) Forecast, by Application 2020 & 2033
- Table 24: Rest of South America Naval Smart Weapons Market Revenue (billion) Forecast, by Application 2020 & 2033
- Table 25: Global Naval Smart Weapons Market Revenue billion Forecast, by Production Analysis 2020 & 2033
- Table 26: Global Naval Smart Weapons Market Revenue billion Forecast, by Consumption Analysis 2020 & 2033
- Table 27: Global Naval Smart Weapons Market Revenue billion Forecast, by Import Market Analysis (Value & Volume) 2020 & 2033
- Table 28: Global Naval Smart Weapons Market Revenue billion Forecast, by Export Market Analysis (Value & Volume) 2020 & 2033
- Table 29: Global Naval Smart Weapons Market Revenue billion Forecast, by Price Trend Analysis 2020 & 2033
- Table 30: Global Naval Smart Weapons Market Revenue billion Forecast, by Country 2020 & 2033
- Table 31: United Kingdom Naval Smart Weapons Market Revenue (billion) Forecast, by Application 2020 & 2033
- Table 32: Germany Naval Smart Weapons Market Revenue (billion) Forecast, by Application 2020 & 2033
- Table 33: France Naval Smart Weapons Market Revenue (billion) Forecast, by Application 2020 & 2033
- Table 34: Italy Naval Smart Weapons Market Revenue (billion) Forecast, by Application 2020 & 2033
- Table 35: Spain Naval Smart Weapons Market Revenue (billion) Forecast, by Application 2020 & 2033
- Table 36: Russia Naval Smart Weapons Market Revenue (billion) Forecast, by Application 2020 & 2033
- Table 37: Benelux Naval Smart Weapons Market Revenue (billion) Forecast, by Application 2020 & 2033
- Table 38: Nordics Naval Smart Weapons Market Revenue (billion) Forecast, by Application 2020 & 2033
- Table 39: Rest of Europe Naval Smart Weapons Market Revenue (billion) Forecast, by Application 2020 & 2033
- Table 40: Global Naval Smart Weapons Market Revenue billion Forecast, by Production Analysis 2020 & 2033
- Table 41: Global Naval Smart Weapons Market Revenue billion Forecast, by Consumption Analysis 2020 & 2033
- Table 42: Global Naval Smart Weapons Market Revenue billion Forecast, by Import Market Analysis (Value & Volume) 2020 & 2033
- Table 43: Global Naval Smart Weapons Market Revenue billion Forecast, by Export Market Analysis (Value & Volume) 2020 & 2033
- Table 44: Global Naval Smart Weapons Market Revenue billion Forecast, by Price Trend Analysis 2020 & 2033
- Table 45: Global Naval Smart Weapons Market Revenue billion Forecast, by Country 2020 & 2033
- Table 46: Turkey Naval Smart Weapons Market Revenue (billion) Forecast, by Application 2020 & 2033
- Table 47: Israel Naval Smart Weapons Market Revenue (billion) Forecast, by Application 2020 & 2033
- Table 48: GCC Naval Smart Weapons Market Revenue (billion) Forecast, by Application 2020 & 2033
- Table 49: North Africa Naval Smart Weapons Market Revenue (billion) Forecast, by Application 2020 & 2033
- Table 50: South Africa Naval Smart Weapons Market Revenue (billion) Forecast, by Application 2020 & 2033
- Table 51: Rest of Middle East & Africa Naval Smart Weapons Market Revenue (billion) Forecast, by Application 2020 & 2033
- Table 52: Global Naval Smart Weapons Market Revenue billion Forecast, by Production Analysis 2020 & 2033
- Table 53: Global Naval Smart Weapons Market Revenue billion Forecast, by Consumption Analysis 2020 & 2033
- Table 54: Global Naval Smart Weapons Market Revenue billion Forecast, by Import Market Analysis (Value & Volume) 2020 & 2033
- Table 55: Global Naval Smart Weapons Market Revenue billion Forecast, by Export Market Analysis (Value & Volume) 2020 & 2033
- Table 56: Global Naval Smart Weapons Market Revenue billion Forecast, by Price Trend Analysis 2020 & 2033
- Table 57: Global Naval Smart Weapons Market Revenue billion Forecast, by Country 2020 & 2033
- Table 58: China Naval Smart Weapons Market Revenue (billion) Forecast, by Application 2020 & 2033
- Table 59: India Naval Smart Weapons Market Revenue (billion) Forecast, by Application 2020 & 2033
- Table 60: Japan Naval Smart Weapons Market Revenue (billion) Forecast, by Application 2020 & 2033
- Table 61: South Korea Naval Smart Weapons Market Revenue (billion) Forecast, by Application 2020 & 2033
- Table 62: ASEAN Naval Smart Weapons Market Revenue (billion) Forecast, by Application 2020 & 2033
- Table 63: Oceania Naval Smart Weapons Market Revenue (billion) Forecast, by Application 2020 & 2033
- Table 64: Rest of Asia Pacific Naval Smart Weapons Market Revenue (billion) Forecast, by Application 2020 & 2033
Frequently Asked Questions
1. What is the projected Compound Annual Growth Rate (CAGR) of the Naval Smart Weapons Market?
The projected CAGR is approximately 7.75%.
2. Which companies are prominent players in the Naval Smart Weapons Market?
Key companies in the market include Textron Inc, L3Harris Technologies Inc, Raytheon Technologies Corporation, THALES, General Dynamics Corporation, Rheinmetall AG, Lockheed Martin Corporation, MBDA, Leonardo S p A, BAE Systems plc, Northrop Grumman Corporation, The Boeing Company.
3. What are the main segments of the Naval Smart Weapons Market?
The market segments include Production Analysis, Consumption Analysis, Import Market Analysis (Value & Volume), Export Market Analysis (Value & Volume), Price Trend Analysis.
4. Can you provide details about the market size?
The market size is estimated to be USD 12.02 billion as of 2022.
5. What are some drivers contributing to market growth?
Increase in Internet of Things (IoT) and Autonomous Systems; Rise in Demand for Military and Defense Satellite Communication Solutions.
6. What are the notable trends driving market growth?
Laser Guidance Segment Holds the Highest Share in the Market.
7. Are there any restraints impacting market growth?
Cybersecurity Threats to Satellite Communication; Interference in Transmission of Data.
8. Can you provide examples of recent developments in the market?
In February 2023, the US Navy placed an order worth USD 92 million for weapon assemblies for LAIRCM missile-defense systems with Northrop Grumman Corporation.
9. What pricing options are available for accessing the report?
Pricing options include single-user, multi-user, and enterprise licenses priced at USD 4750, USD 5250, and USD 8750 respectively.
10. Is the market size provided in terms of value or volume?
The market size is provided in terms of value, measured in billion.
11. Are there any specific market keywords associated with the report?
Yes, the market keyword associated with the report is "Naval Smart Weapons Market," which aids in identifying and referencing the specific market segment covered.
12. How do I determine which pricing option suits my needs best?
The pricing options vary based on user requirements and access needs. Individual users may opt for single-user licenses, while businesses requiring broader access may choose multi-user or enterprise licenses for cost-effective access to the report.
13. Are there any additional resources or data provided in the Naval Smart Weapons Market report?
While the report offers comprehensive insights, it's advisable to review the specific contents or supplementary materials provided to ascertain if additional resources or data are available.
14. How can I stay updated on further developments or reports in the Naval Smart Weapons Market?
To stay informed about further developments, trends, and reports in the Naval Smart Weapons Market, consider subscribing to industry newsletters, following relevant companies and organizations, or regularly checking reputable industry news sources and publications.
Methodology
Step 1 - Identification of Relevant Samples Size from Population Database


Step 2 - Approaches for Defining Global Market Size (Value, Volume* & Price*)

Note*: In applicable scenarios
Step 3 - Data Sources
Primary Research
- Web Analytics
- Survey Reports
- Research Institute
- Latest Research Reports
- Opinion Leaders
Secondary Research
- Annual Reports
- White Paper
- Latest Press Release
- Industry Association
- Paid Database
- Investor Presentations

Step 4 - Data Triangulation
Involves using different sources of information in order to increase the validity of a study
These sources are likely to be stakeholders in a program - participants, other researchers, program staff, other community members, and so on.
Then we put all data in single framework & apply various statistical tools to find out the dynamic on the market.
During the analysis stage, feedback from the stakeholder groups would be compared to determine areas of agreement as well as areas of divergence