

Key Insights
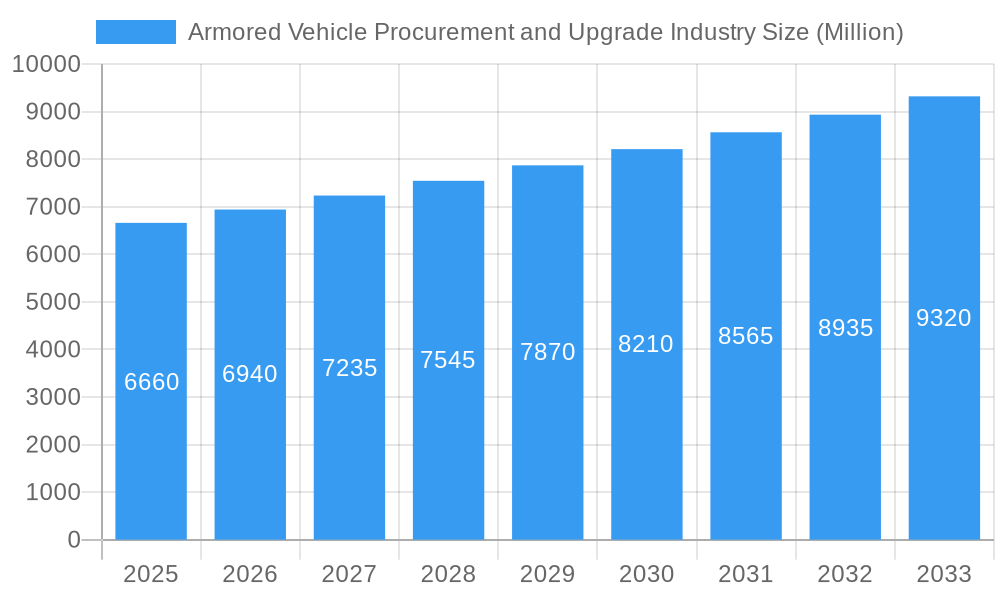
The Armored Vehicle Procurement and Upgrade industry, valued at $6.66 billion in 2025, is projected to experience robust growth, driven by escalating geopolitical tensions and the increasing need for enhanced military capabilities globally. A Compound Annual Growth Rate (CAGR) of 4.23% from 2025 to 2033 indicates a significant expansion of this market, reaching an estimated value exceeding $10 billion by 2033. Key drivers include modernization efforts by armed forces worldwide, technological advancements leading to lighter, more agile, and better-protected vehicles, and rising demand for specialized vehicles such as Mine-Resistant Ambush Protected (MRAP) vehicles in conflict zones and peacekeeping operations. Market segmentation reveals a strong demand across various vehicle types, with Armored Personnel Carriers (APCs), Infantry Fighting Vehicles (IFVs), and MRAPs constituting significant portions of the market. Leading players like Textron, Oshkosh, General Dynamics, and Rheinmetall are strategically investing in research and development to maintain their competitive edge, focusing on innovations in protection systems, mobility, and lethality.
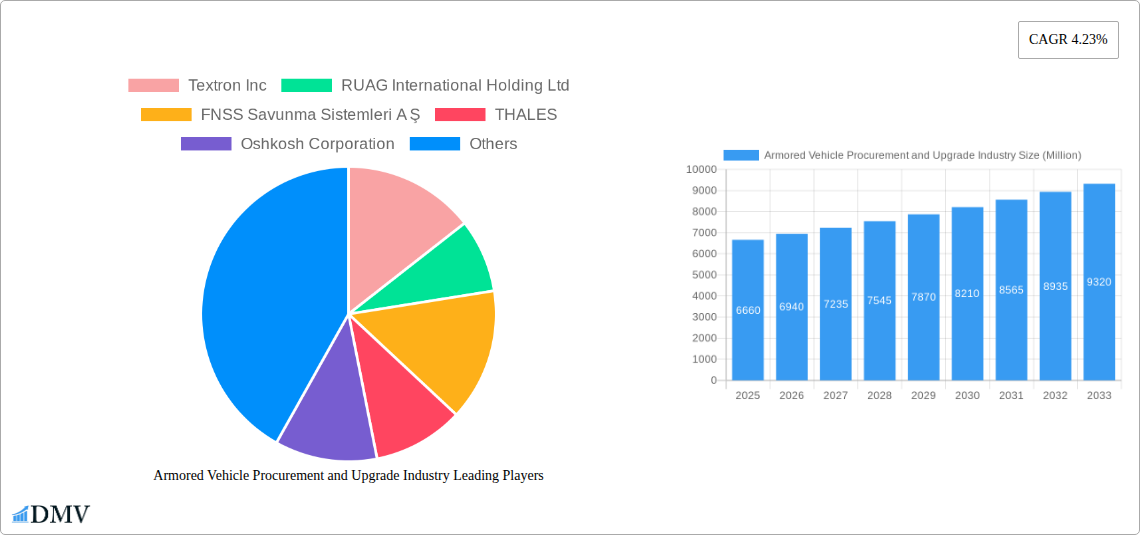
Armored Vehicle Procurement and Upgrade Industry Market Size (In Billion)
Regional analysis suggests North America and Europe currently hold the largest market shares, driven by substantial defense budgets and established defense industries. However, the Asia-Pacific region is expected to exhibit significant growth, spurred by increasing defense spending and modernization initiatives by countries like China and India. Growth is also expected in the Middle East and Africa driven by regional conflicts and increased security concerns. While economic downturns and budget constraints may pose some challenges, the overall market outlook remains positive due to the persistent demand for advanced armored vehicles and a continuous need for upgrading existing fleets to meet evolving threats. The industry is expected to witness increased consolidation through mergers and acquisitions, further driving technological advancements and market concentration.
Armored Vehicle Procurement and Upgrade Industry Company Market Share
Armored Vehicle Procurement and Upgrade Industry: A Comprehensive Market Report (2019-2033)
This insightful report provides a comprehensive analysis of the Armored Vehicle Procurement and Upgrade industry, offering crucial insights for stakeholders seeking to navigate this dynamic market. With a study period spanning 2019-2033, a base year of 2025, and a forecast period of 2025-2033, this report unveils critical market trends, technological advancements, and future growth opportunities. The report analyzes a market valued at $xx Million in 2025, projected to reach $xx Million by 2033, revealing significant investment potential.
Armored Vehicle Procurement and Upgrade Industry Market Composition & Trends
This section meticulously examines the competitive landscape of the armored vehicle market, assessing market concentration, innovative drivers, regulatory frameworks, substitute products, and end-user profiles. The analysis incorporates key M&A activities, providing insights into market share distribution and deal values.
Market Dynamics: The global armored vehicle market exhibits a moderately concentrated structure, with several key players holding significant market share. Innovation is driven by advancements in materials science, digital technologies (AI, autonomous systems), and enhanced protection systems against evolving threats. Stringent regulatory frameworks govern the manufacturing, sales, and export of armored vehicles, impacting market access and growth. The presence of substitute technologies (e.g., drones, robotic systems) creates competitive pressures, while end-user demand is largely driven by military and government agencies, along with private security firms.
M&A Activity: Over the period 2019-2024, the industry witnessed approximately $xx Million in M&A activity, with a focus on consolidating market share and acquiring specialized technologies. Notable deals included [Specific examples of M&A activity with deal values if available, otherwise use “xx Million”].
- Market Share Distribution: The top five players collectively hold an estimated xx% market share, with [mention specifics of market share distribution if available, otherwise use predicted values].
- Key Growth Drivers: Technological advancements, geopolitical instability, and increasing defense budgets are primary growth catalysts.
Armored Vehicle Procurement and Upgrade Industry Industry Evolution
This section delves into the evolutionary trajectory of the armored vehicle market, exploring market growth patterns, technological leaps, and evolving consumer preferences (military and government requirements).
From 2019 to 2024, the market witnessed a Compound Annual Growth Rate (CAGR) of xx%, driven primarily by [explain the specific drivers, e.g., increased defense spending, modernization initiatives]. Technological advancements, such as the integration of advanced sensors, improved communication systems, and enhanced protection technologies, significantly impacted market growth. A notable shift in consumer demand is towards lighter, more agile vehicles with superior survivability and enhanced situational awareness capabilities. The market is expected to continue its growth trajectory, reaching a CAGR of xx% during the forecast period (2025-2033), propelled by [mention specific technological innovations and market trends]. The adoption of autonomous and semi-autonomous features is gradually increasing and is a key element in shaping future vehicle designs.
Leading Regions, Countries, or Segments in Armored Vehicle Procurement and Upgrade Industry
This section identifies dominant regions, countries, and vehicle segments within the armored vehicle market.
Dominant Segment: The [APC/IFV/MRAP/MBT - select the dominant segment based on data analysis] segment currently holds the largest market share, accounting for approximately xx% of the total market in 2025.
- Key Drivers (APC): Increased demand for troop transport and personnel protection, cost-effectiveness, and widespread adoption.
- Key Drivers (IFV): Modernization of existing fleets, enhanced firepower, and increased battlefield survivability.
- Key Drivers (MRAP): Demand for protection against improvised explosive devices (IEDs) and landmines in conflict zones.
- Key Drivers (MBT): Technological advancements, defense budget allocation, and geopolitical situations.
- Key Drivers (Other Vehicle Types): Growing demand for specialized vehicles such as reconnaissance vehicles, recovery vehicles, and engineer vehicles.
[Provide detailed analysis of the dominant segment's dominance, incorporating insights regarding investment trends and regulatory support within each bullet point. The analysis needs to extend the points listed above. ]
Armored Vehicle Procurement and Upgrade Industry Product Innovations
Recent innovations in armored vehicles encompass the integration of advanced composite materials for improved weight reduction and protection, advanced active protection systems (APS) to neutralize incoming threats, and enhanced situational awareness systems. These advancements contribute to improved mobility, survivability, and overall operational efficiency. Unique selling propositions often focus on superior protection levels, increased firepower, and enhanced mobility in diverse terrains.
Propelling Factors for Armored Vehicle Procurement and Upgrade Industry Growth
Several factors are driving market growth, including escalating geopolitical tensions leading to increased defense spending, technological advancements resulting in superior vehicle performance, and modernization initiatives undertaken by numerous armed forces worldwide. Furthermore, the growing need for effective counter-terrorism strategies is fueling demand for specialized armored vehicles.
Obstacles in the Armored Vehicle Procurement and Upgrade Industry Market
The market faces challenges such as stringent regulatory compliance, potential supply chain disruptions impacting production, and intense competition among major players. These factors can affect pricing and market access, potentially limiting overall growth.
Future Opportunities in Armored Vehicle Procurement and Upgrade Industry
Emerging markets in developing nations represent significant growth opportunities. Technological advancements, particularly in autonomous systems and AI-powered features, promise to reshape the industry. Furthermore, growing demand for specialized armored vehicles adapted to diverse operational environments and evolving threat scenarios presents lucrative opportunities for innovation and expansion.
Major Players in the Armored Vehicle Procurement and Upgrade Industry Ecosystem
- Textron Inc
- RUAG International Holding Ltd
- FNSS Savunma Sistemleri A Ş
- THALES
- Oshkosh Corporation
- General Dynamics Corporation
- Rheinmetall AG
- Elbit Systems Ltd
- The CMI Group Inc
- BMC Otomotiv Sanayi ve Ticaret A Ş
- KNDS N V
- Streit Group
- IVECO S p A
- BAE Systems plc
Key Developments in Armored Vehicle Procurement and Upgrade Industry Industry
May 2023: Elbit Systems Ltd. secured a contract under the British Army's Project Vulcan for maintaining and operating the Ground Manoeuvre Synthetic Trainer system (GMST), Boxer armored vehicles, and Challenger 3 tanks. This includes a training management system with high-fidelity driver trainers and cabins for turret and armament variants. This development strengthens Elbit Systems' position in the training and support segment of the armored vehicle market.
May 2023: The Czech MoD awarded a USD 2.2 Billion contract to BAE Systems plc for 246 CV90 Mk IV infantry fighting vehicles, with Slovakia ordering an additional 152. These vehicles will replace BVP-1 IFVs. This significant contract win underscores BAE Systems' leading role in the IFV market and signals a major modernization effort by these countries.
Strategic Armored Vehicle Procurement and Upgrade Industry Market Forecast
The armored vehicle market is poised for sustained growth driven by ongoing geopolitical instability, modernization efforts by armed forces globally, and the continuous evolution of armored vehicle technology. The integration of advanced technologies such as AI, autonomous systems, and enhanced protection measures will continue to shape market dynamics, leading to significant opportunities for innovative players in the coming years. The market’s expansion is projected to be substantial, reflecting both the growing demand for advanced capabilities and the increasing investment in defense worldwide.
Armored Vehicle Procurement and Upgrade Industry Segmentation
-
1. Vehicle Type
- 1.1. Armored Personnel Carrier (APC)
- 1.2. Infantry Fighting Vehicle (IFV)
- 1.3. Mine-resistant Ambush Protected (MRAP)
- 1.4. Main Battle Tank (MBT)
- 1.5. Other Vehicle Types
Armored Vehicle Procurement and Upgrade Industry Segmentation By Geography
-
1. North America
- 1.1. United States
- 1.2. Canada
-
2. Europe
- 2.1. United Kingdom
- 2.2. France
- 2.3. Germany
- 2.4. Russia
- 2.5. Rest of Europe
-
3. Asia Pacific
- 3.1. China
- 3.2. India
- 3.3. Japan
- 3.4. South Korea
- 3.5. Australia
- 3.6. Rest of Asia Pacific
-
4. Latin America
- 4.1. Brazil
- 4.2. Mexico
- 4.3. Rest of Latin America
- 5. Middle East
-
6. United Arab Emirates
- 6.1. Saudi Arabia
- 6.2. Turkey
- 6.3. South Africa
- 6.4. Rest of Middle East and Africa
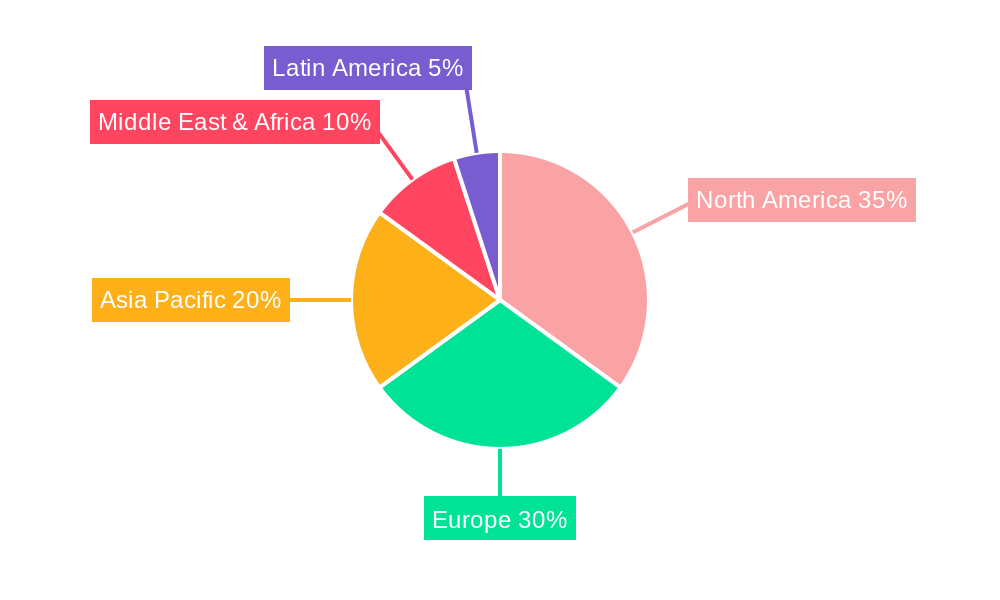
Armored Vehicle Procurement and Upgrade Industry Regional Market Share
Geographic Coverage of Armored Vehicle Procurement and Upgrade Industry
Armored Vehicle Procurement and Upgrade Industry REPORT HIGHLIGHTS
| Aspects | Details |
|---|---|
| Study Period | 2020-2034 |
| Base Year | 2025 |
| Estimated Year | 2026 |
| Forecast Period | 2026-2034 |
| Historical Period | 2020-2025 |
| Growth Rate | CAGR of 4.23% from 2020-2034 |
| Segmentation |
|
Table of Contents
- 1. Introduction
- 1.1. Research Scope
- 1.2. Market Segmentation
- 1.3. Research Objective
- 1.4. Definitions and Assumptions
- 2. Executive Summary
- 2.1. Market Snapshot
- 3. Market Dynamics
- 3.1. Market Drivers
- 3.2. Market Restrains
- 3.3. Market Trends
- 3.4. Market Opportunities
- 4. Market Factor Analysis
- 4.1. Porters Five Forces
- 4.1.1. Bargaining Power of Suppliers
- 4.1.2. Bargaining Power of Buyers
- 4.1.3. Threat of New Entrants
- 4.1.4. Threat of Substitutes
- 4.1.5. Competitive Rivalry
- 4.2. PESTEL analysis
- 4.3. BCG Analysis
- 4.3.1. Stars (High Growth, High Market Share)
- 4.3.2. Cash Cows (Low Growth, High Market Share)
- 4.3.3. Question Mark (High Growth, Low Market Share)
- 4.3.4. Dogs (Low Growth, Low Market Share)
- 4.4. Ansoff Matrix Analysis
- 4.5. Supply Chain Analysis
- 4.6. Regulatory Landscape
- 4.7. Current Market Potential and Opportunity Assessment (TAM–SAM–SOM Framework)
- 4.8. DMV Analyst Note
- 4.1. Porters Five Forces
- 5. Market Analysis, Insights and Forecast 2021-2033
- 5.1. Market Analysis, Insights and Forecast - by Vehicle Type
- 5.1.1. Armored Personnel Carrier (APC)
- 5.1.2. Infantry Fighting Vehicle (IFV)
- 5.1.3. Mine-resistant Ambush Protected (MRAP)
- 5.1.4. Main Battle Tank (MBT)
- 5.1.5. Other Vehicle Types
- 5.2. Market Analysis, Insights and Forecast - by Region
- 5.2.1. North America
- 5.2.2. Europe
- 5.2.3. Asia Pacific
- 5.2.4. Latin America
- 5.2.5. Middle East
- 5.2.6. United Arab Emirates
- 5.1. Market Analysis, Insights and Forecast - by Vehicle Type
- 6. Global Armored Vehicle Procurement and Upgrade Industry Analysis, Insights and Forecast, 2021-2033
- 6.1. Market Analysis, Insights and Forecast - by Vehicle Type
- 6.1.1. Armored Personnel Carrier (APC)
- 6.1.2. Infantry Fighting Vehicle (IFV)
- 6.1.3. Mine-resistant Ambush Protected (MRAP)
- 6.1.4. Main Battle Tank (MBT)
- 6.1.5. Other Vehicle Types
- 6.1. Market Analysis, Insights and Forecast - by Vehicle Type
- 7. North America Armored Vehicle Procurement and Upgrade Industry Analysis, Insights and Forecast, 2020-2032
- 7.1. Market Analysis, Insights and Forecast - by Vehicle Type
- 7.1.1. Armored Personnel Carrier (APC)
- 7.1.2. Infantry Fighting Vehicle (IFV)
- 7.1.3. Mine-resistant Ambush Protected (MRAP)
- 7.1.4. Main Battle Tank (MBT)
- 7.1.5. Other Vehicle Types
- 7.1. Market Analysis, Insights and Forecast - by Vehicle Type
- 8. Europe Armored Vehicle Procurement and Upgrade Industry Analysis, Insights and Forecast, 2020-2032
- 8.1. Market Analysis, Insights and Forecast - by Vehicle Type
- 8.1.1. Armored Personnel Carrier (APC)
- 8.1.2. Infantry Fighting Vehicle (IFV)
- 8.1.3. Mine-resistant Ambush Protected (MRAP)
- 8.1.4. Main Battle Tank (MBT)
- 8.1.5. Other Vehicle Types
- 8.1. Market Analysis, Insights and Forecast - by Vehicle Type
- 9. Asia Pacific Armored Vehicle Procurement and Upgrade Industry Analysis, Insights and Forecast, 2020-2032
- 9.1. Market Analysis, Insights and Forecast - by Vehicle Type
- 9.1.1. Armored Personnel Carrier (APC)
- 9.1.2. Infantry Fighting Vehicle (IFV)
- 9.1.3. Mine-resistant Ambush Protected (MRAP)
- 9.1.4. Main Battle Tank (MBT)
- 9.1.5. Other Vehicle Types
- 9.1. Market Analysis, Insights and Forecast - by Vehicle Type
- 10. Latin America Armored Vehicle Procurement and Upgrade Industry Analysis, Insights and Forecast, 2020-2032
- 10.1. Market Analysis, Insights and Forecast - by Vehicle Type
- 10.1.1. Armored Personnel Carrier (APC)
- 10.1.2. Infantry Fighting Vehicle (IFV)
- 10.1.3. Mine-resistant Ambush Protected (MRAP)
- 10.1.4. Main Battle Tank (MBT)
- 10.1.5. Other Vehicle Types
- 10.1. Market Analysis, Insights and Forecast - by Vehicle Type
- 11. Middle East Armored Vehicle Procurement and Upgrade Industry Analysis, Insights and Forecast, 2020-2032
- 11.1. Market Analysis, Insights and Forecast - by Vehicle Type
- 11.1.1. Armored Personnel Carrier (APC)
- 11.1.2. Infantry Fighting Vehicle (IFV)
- 11.1.3. Mine-resistant Ambush Protected (MRAP)
- 11.1.4. Main Battle Tank (MBT)
- 11.1.5. Other Vehicle Types
- 11.1. Market Analysis, Insights and Forecast - by Vehicle Type
- 12. United Arab Emirates Armored Vehicle Procurement and Upgrade Industry Analysis, Insights and Forecast, 2020-2032
- 12.1. Market Analysis, Insights and Forecast - by Vehicle Type
- 12.1.1. Armored Personnel Carrier (APC)
- 12.1.2. Infantry Fighting Vehicle (IFV)
- 12.1.3. Mine-resistant Ambush Protected (MRAP)
- 12.1.4. Main Battle Tank (MBT)
- 12.1.5. Other Vehicle Types
- 12.1. Market Analysis, Insights and Forecast - by Vehicle Type
- 13. Competitive Analysis
- 13.1. Company Profiles
- 13.1.1 Textron Inc
- 13.1.1.1. Company Overview
- 13.1.1.2. Products
- 13.1.1.3. Company Financials
- 13.1.1.4. SWOT Analysis
- 13.1.2 RUAG International Holding Ltd
- 13.1.2.1. Company Overview
- 13.1.2.2. Products
- 13.1.2.3. Company Financials
- 13.1.2.4. SWOT Analysis
- 13.1.3 FNSS Savunma Sistemleri A Ş
- 13.1.3.1. Company Overview
- 13.1.3.2. Products
- 13.1.3.3. Company Financials
- 13.1.3.4. SWOT Analysis
- 13.1.4 THALES
- 13.1.4.1. Company Overview
- 13.1.4.2. Products
- 13.1.4.3. Company Financials
- 13.1.4.4. SWOT Analysis
- 13.1.5 Oshkosh Corporation
- 13.1.5.1. Company Overview
- 13.1.5.2. Products
- 13.1.5.3. Company Financials
- 13.1.5.4. SWOT Analysis
- 13.1.6 General Dynamics Corporation
- 13.1.6.1. Company Overview
- 13.1.6.2. Products
- 13.1.6.3. Company Financials
- 13.1.6.4. SWOT Analysis
- 13.1.7 Rheinmetall AG
- 13.1.7.1. Company Overview
- 13.1.7.2. Products
- 13.1.7.3. Company Financials
- 13.1.7.4. SWOT Analysis
- 13.1.8 Elbit Systems Ltd
- 13.1.8.1. Company Overview
- 13.1.8.2. Products
- 13.1.8.3. Company Financials
- 13.1.8.4. SWOT Analysis
- 13.1.9 The CMI Group Inc
- 13.1.9.1. Company Overview
- 13.1.9.2. Products
- 13.1.9.3. Company Financials
- 13.1.9.4. SWOT Analysis
- 13.1.10 BMC Otomotiv Sanayi ve Ticaret A Ş
- 13.1.10.1. Company Overview
- 13.1.10.2. Products
- 13.1.10.3. Company Financials
- 13.1.10.4. SWOT Analysis
- 13.1.11 KNDS N V
- 13.1.11.1. Company Overview
- 13.1.11.2. Products
- 13.1.11.3. Company Financials
- 13.1.11.4. SWOT Analysis
- 13.1.12 Streit Grou
- 13.1.12.1. Company Overview
- 13.1.12.2. Products
- 13.1.12.3. Company Financials
- 13.1.12.4. SWOT Analysis
- 13.1.13 IVECO S p A
- 13.1.13.1. Company Overview
- 13.1.13.2. Products
- 13.1.13.3. Company Financials
- 13.1.13.4. SWOT Analysis
- 13.1.14 BAE Systems plc
- 13.1.14.1. Company Overview
- 13.1.14.2. Products
- 13.1.14.3. Company Financials
- 13.1.14.4. SWOT Analysis
- 13.1.1 Textron Inc
- 13.2. Market Entropy
- 13.2.1 Company's Key Areas Served
- 13.2.2 Recent Developments
- 13.3. Company Market Share Analysis 2025
- 13.3.1 Top 5 Companies Market Share Analysis
- 13.3.2 Top 3 Companies Market Share Analysis
- 13.4. List of Potential Customers
- 14. Research Methodology
List of Figures
- Figure 1: Global Armored Vehicle Procurement and Upgrade Industry Revenue Breakdown (Million, %) by Region 2025 & 2033
- Figure 2: North America Armored Vehicle Procurement and Upgrade Industry Revenue (Million), by Vehicle Type 2025 & 2033
- Figure 3: North America Armored Vehicle Procurement and Upgrade Industry Revenue Share (%), by Vehicle Type 2025 & 2033
- Figure 4: North America Armored Vehicle Procurement and Upgrade Industry Revenue (Million), by Country 2025 & 2033
- Figure 5: North America Armored Vehicle Procurement and Upgrade Industry Revenue Share (%), by Country 2025 & 2033
- Figure 6: Europe Armored Vehicle Procurement and Upgrade Industry Revenue (Million), by Vehicle Type 2025 & 2033
- Figure 7: Europe Armored Vehicle Procurement and Upgrade Industry Revenue Share (%), by Vehicle Type 2025 & 2033
- Figure 8: Europe Armored Vehicle Procurement and Upgrade Industry Revenue (Million), by Country 2025 & 2033
- Figure 9: Europe Armored Vehicle Procurement and Upgrade Industry Revenue Share (%), by Country 2025 & 2033
- Figure 10: Asia Pacific Armored Vehicle Procurement and Upgrade Industry Revenue (Million), by Vehicle Type 2025 & 2033
- Figure 11: Asia Pacific Armored Vehicle Procurement and Upgrade Industry Revenue Share (%), by Vehicle Type 2025 & 2033
- Figure 12: Asia Pacific Armored Vehicle Procurement and Upgrade Industry Revenue (Million), by Country 2025 & 2033
- Figure 13: Asia Pacific Armored Vehicle Procurement and Upgrade Industry Revenue Share (%), by Country 2025 & 2033
- Figure 14: Latin America Armored Vehicle Procurement and Upgrade Industry Revenue (Million), by Vehicle Type 2025 & 2033
- Figure 15: Latin America Armored Vehicle Procurement and Upgrade Industry Revenue Share (%), by Vehicle Type 2025 & 2033
- Figure 16: Latin America Armored Vehicle Procurement and Upgrade Industry Revenue (Million), by Country 2025 & 2033
- Figure 17: Latin America Armored Vehicle Procurement and Upgrade Industry Revenue Share (%), by Country 2025 & 2033
- Figure 18: Middle East Armored Vehicle Procurement and Upgrade Industry Revenue (Million), by Vehicle Type 2025 & 2033
- Figure 19: Middle East Armored Vehicle Procurement and Upgrade Industry Revenue Share (%), by Vehicle Type 2025 & 2033
- Figure 20: Middle East Armored Vehicle Procurement and Upgrade Industry Revenue (Million), by Country 2025 & 2033
- Figure 21: Middle East Armored Vehicle Procurement and Upgrade Industry Revenue Share (%), by Country 2025 & 2033
- Figure 22: United Arab Emirates Armored Vehicle Procurement and Upgrade Industry Revenue (Million), by Vehicle Type 2025 & 2033
- Figure 23: United Arab Emirates Armored Vehicle Procurement and Upgrade Industry Revenue Share (%), by Vehicle Type 2025 & 2033
- Figure 24: United Arab Emirates Armored Vehicle Procurement and Upgrade Industry Revenue (Million), by Country 2025 & 2033
- Figure 25: United Arab Emirates Armored Vehicle Procurement and Upgrade Industry Revenue Share (%), by Country 2025 & 2033
List of Tables
- Table 1: Global Armored Vehicle Procurement and Upgrade Industry Revenue Million Forecast, by Vehicle Type 2020 & 2033
- Table 2: Global Armored Vehicle Procurement and Upgrade Industry Revenue Million Forecast, by Region 2020 & 2033
- Table 3: Global Armored Vehicle Procurement and Upgrade Industry Revenue Million Forecast, by Vehicle Type 2020 & 2033
- Table 4: Global Armored Vehicle Procurement and Upgrade Industry Revenue Million Forecast, by Country 2020 & 2033
- Table 5: United States Armored Vehicle Procurement and Upgrade Industry Revenue (Million) Forecast, by Application 2020 & 2033
- Table 6: Canada Armored Vehicle Procurement and Upgrade Industry Revenue (Million) Forecast, by Application 2020 & 2033
- Table 7: Global Armored Vehicle Procurement and Upgrade Industry Revenue Million Forecast, by Vehicle Type 2020 & 2033
- Table 8: Global Armored Vehicle Procurement and Upgrade Industry Revenue Million Forecast, by Country 2020 & 2033
- Table 9: United Kingdom Armored Vehicle Procurement and Upgrade Industry Revenue (Million) Forecast, by Application 2020 & 2033
- Table 10: France Armored Vehicle Procurement and Upgrade Industry Revenue (Million) Forecast, by Application 2020 & 2033
- Table 11: Germany Armored Vehicle Procurement and Upgrade Industry Revenue (Million) Forecast, by Application 2020 & 2033
- Table 12: Russia Armored Vehicle Procurement and Upgrade Industry Revenue (Million) Forecast, by Application 2020 & 2033
- Table 13: Rest of Europe Armored Vehicle Procurement and Upgrade Industry Revenue (Million) Forecast, by Application 2020 & 2033
- Table 14: Global Armored Vehicle Procurement and Upgrade Industry Revenue Million Forecast, by Vehicle Type 2020 & 2033
- Table 15: Global Armored Vehicle Procurement and Upgrade Industry Revenue Million Forecast, by Country 2020 & 2033
- Table 16: China Armored Vehicle Procurement and Upgrade Industry Revenue (Million) Forecast, by Application 2020 & 2033
- Table 17: India Armored Vehicle Procurement and Upgrade Industry Revenue (Million) Forecast, by Application 2020 & 2033
- Table 18: Japan Armored Vehicle Procurement and Upgrade Industry Revenue (Million) Forecast, by Application 2020 & 2033
- Table 19: South Korea Armored Vehicle Procurement and Upgrade Industry Revenue (Million) Forecast, by Application 2020 & 2033
- Table 20: Australia Armored Vehicle Procurement and Upgrade Industry Revenue (Million) Forecast, by Application 2020 & 2033
- Table 21: Rest of Asia Pacific Armored Vehicle Procurement and Upgrade Industry Revenue (Million) Forecast, by Application 2020 & 2033
- Table 22: Global Armored Vehicle Procurement and Upgrade Industry Revenue Million Forecast, by Vehicle Type 2020 & 2033
- Table 23: Global Armored Vehicle Procurement and Upgrade Industry Revenue Million Forecast, by Country 2020 & 2033
- Table 24: Brazil Armored Vehicle Procurement and Upgrade Industry Revenue (Million) Forecast, by Application 2020 & 2033
- Table 25: Mexico Armored Vehicle Procurement and Upgrade Industry Revenue (Million) Forecast, by Application 2020 & 2033
- Table 26: Rest of Latin America Armored Vehicle Procurement and Upgrade Industry Revenue (Million) Forecast, by Application 2020 & 2033
- Table 27: Global Armored Vehicle Procurement and Upgrade Industry Revenue Million Forecast, by Vehicle Type 2020 & 2033
- Table 28: Global Armored Vehicle Procurement and Upgrade Industry Revenue Million Forecast, by Country 2020 & 2033
- Table 29: Global Armored Vehicle Procurement and Upgrade Industry Revenue Million Forecast, by Vehicle Type 2020 & 2033
- Table 30: Global Armored Vehicle Procurement and Upgrade Industry Revenue Million Forecast, by Country 2020 & 2033
- Table 31: Saudi Arabia Armored Vehicle Procurement and Upgrade Industry Revenue (Million) Forecast, by Application 2020 & 2033
- Table 32: Turkey Armored Vehicle Procurement and Upgrade Industry Revenue (Million) Forecast, by Application 2020 & 2033
- Table 33: South Africa Armored Vehicle Procurement and Upgrade Industry Revenue (Million) Forecast, by Application 2020 & 2033
- Table 34: Rest of Middle East and Africa Armored Vehicle Procurement and Upgrade Industry Revenue (Million) Forecast, by Application 2020 & 2033
Frequently Asked Questions
1. What is the projected Compound Annual Growth Rate (CAGR) of the Armored Vehicle Procurement and Upgrade Industry?
The projected CAGR is approximately 4.23%.
2. Which companies are prominent players in the Armored Vehicle Procurement and Upgrade Industry?
Key companies in the market include Textron Inc, RUAG International Holding Ltd, FNSS Savunma Sistemleri A Ş, THALES, Oshkosh Corporation, General Dynamics Corporation, Rheinmetall AG, Elbit Systems Ltd, The CMI Group Inc, BMC Otomotiv Sanayi ve Ticaret A Ş, KNDS N V, Streit Grou, IVECO S p A, BAE Systems plc.
3. What are the main segments of the Armored Vehicle Procurement and Upgrade Industry?
The market segments include Vehicle Type.
4. Can you provide details about the market size?
The market size is estimated to be USD 6.66 Million as of 2022.
5. What are some drivers contributing to market growth?
N/A
6. What are the notable trends driving market growth?
The Infantry Fighting Vehicle Segment to Dominate Market Share.
7. Are there any restraints impacting market growth?
N/A
8. Can you provide examples of recent developments in the market?
May 2023: Elbit Systems Ltd. was awarded a contract under the British Army's Project Vulcan to maintain and operate the Ground Manoeuvre Synthetic Trainer system (GMST), the Boxer armored vehicles, and Challenger 3 tanks. The contract includes a training management system with high-fidelity driver trainers and cabins for turret and armament variants.
9. What pricing options are available for accessing the report?
Pricing options include single-user, multi-user, and enterprise licenses priced at USD 4750, USD 5250, and USD 8750 respectively.
10. Is the market size provided in terms of value or volume?
The market size is provided in terms of value, measured in Million.
11. Are there any specific market keywords associated with the report?
Yes, the market keyword associated with the report is "Armored Vehicle Procurement and Upgrade Industry," which aids in identifying and referencing the specific market segment covered.
12. How do I determine which pricing option suits my needs best?
The pricing options vary based on user requirements and access needs. Individual users may opt for single-user licenses, while businesses requiring broader access may choose multi-user or enterprise licenses for cost-effective access to the report.
13. Are there any additional resources or data provided in the Armored Vehicle Procurement and Upgrade Industry report?
While the report offers comprehensive insights, it's advisable to review the specific contents or supplementary materials provided to ascertain if additional resources or data are available.
14. How can I stay updated on further developments or reports in the Armored Vehicle Procurement and Upgrade Industry?
To stay informed about further developments, trends, and reports in the Armored Vehicle Procurement and Upgrade Industry, consider subscribing to industry newsletters, following relevant companies and organizations, or regularly checking reputable industry news sources and publications.
Methodology
Step 1 - Identification of Relevant Samples Size from Population Database


Step 2 - Approaches for Defining Global Market Size (Value, Volume* & Price*)

Note*: In applicable scenarios
Step 3 - Data Sources
Primary Research
- Web Analytics
- Survey Reports
- Research Institute
- Latest Research Reports
- Opinion Leaders
Secondary Research
- Annual Reports
- White Paper
- Latest Press Release
- Industry Association
- Paid Database
- Investor Presentations

Step 4 - Data Triangulation
Involves using different sources of information in order to increase the validity of a study
These sources are likely to be stakeholders in a program - participants, other researchers, program staff, other community members, and so on.
Then we put all data in single framework & apply various statistical tools to find out the dynamic on the market.
During the analysis stage, feedback from the stakeholder groups would be compared to determine areas of agreement as well as areas of divergence