

Key Insights
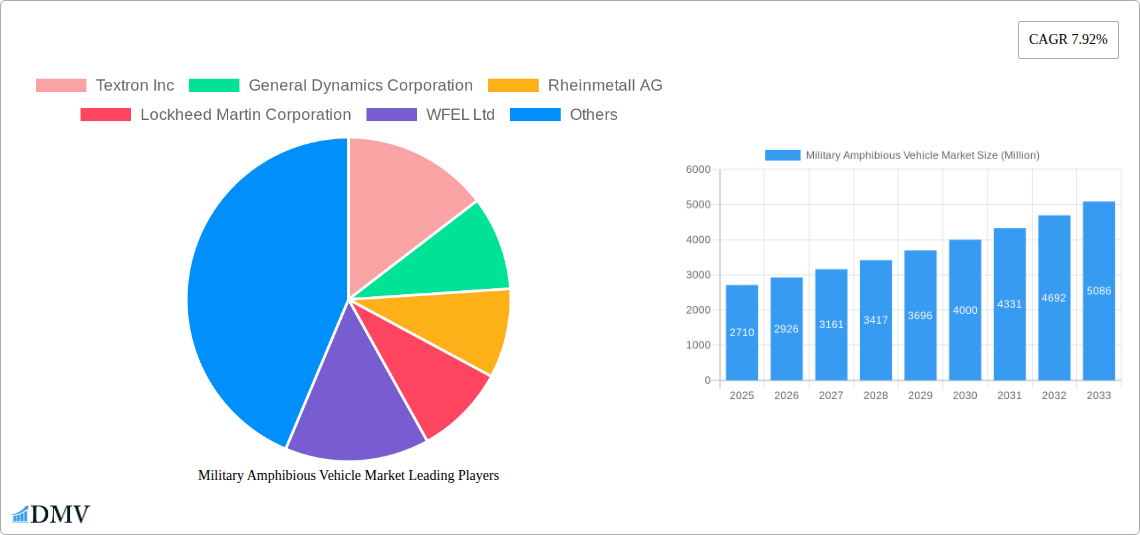
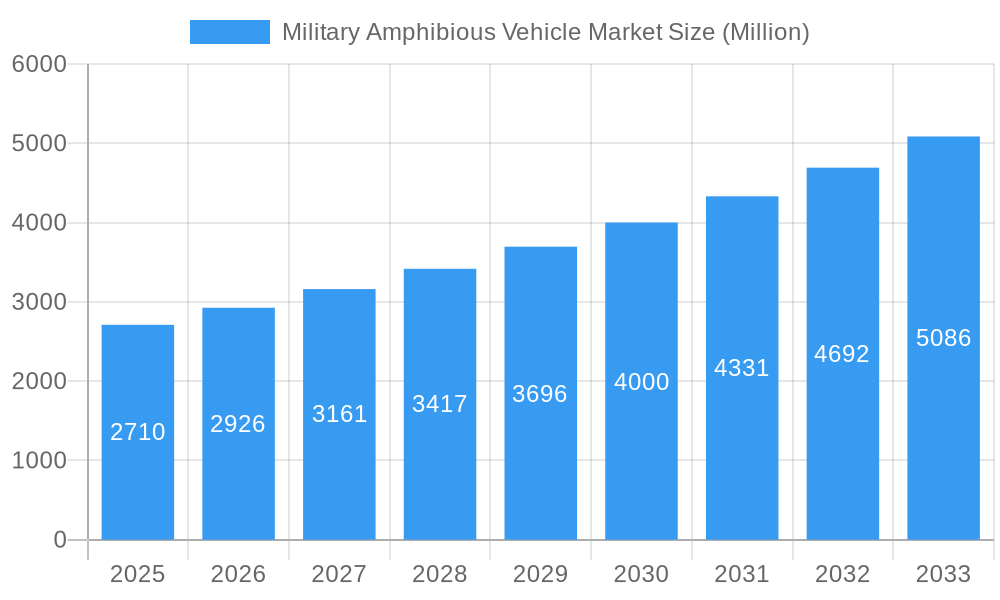
The global military amphibious vehicle market, valued at $2.71 billion in 2025, is projected to experience robust growth, driven by a 7.92% CAGR from 2025 to 2033. This expansion is fueled by several key factors. Increased geopolitical instability and the rising need for versatile defense platforms capable of operating in diverse terrains are primary drivers. Modernization initiatives by armed forces worldwide, along with the continuous development of technologically advanced amphibious vehicles incorporating enhanced features like improved armor, sophisticated weaponry, and advanced communication systems, contribute significantly to market growth. Furthermore, the growing demand for specialized amphibious vehicles, such as those designed for specific missions like coastal patrol and rapid deployment, is expanding market segments. The market is segmented into amphibious armored vehicles and hovercraft, with amphibious armored vehicles currently holding a larger market share due to their wider applicability in various military operations. However, the hovercraft segment is expected to witness significant growth in the forecast period, driven by its unique capabilities in navigating shallow waters and challenging terrains. Competition among major players like Textron, General Dynamics, and Rheinmetall, along with emerging players from Asia, ensures technological innovation and drives market competitiveness.
Military Amphibious Vehicle Market Market Size (In Billion)
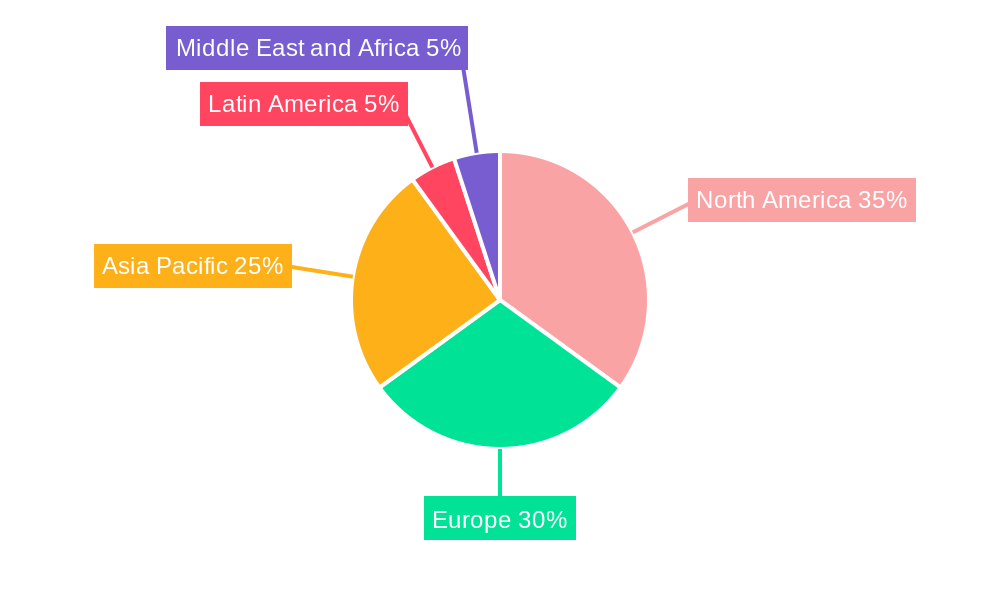
Regional analysis indicates a strong presence of North America and Europe in the market, driven by high defense budgets and advanced technological infrastructure. However, the Asia-Pacific region is anticipated to showcase considerable growth in the coming years fueled by increasing defense spending and modernization efforts in countries like China and India. While potential restraints include high acquisition costs and complex logistical support requirements, the overall market outlook remains positive, driven by consistent demand for technologically superior and versatile amphibious vehicles. The market is poised for substantial growth as nations prioritize maritime security and amphibious warfare capabilities.
Military Amphibious Vehicle Market Company Market Share
Dive Deep into the Lucrative Military Amphibious Vehicle Market: A Comprehensive Market Report (2019-2033)
This insightful report provides a comprehensive analysis of the Military Amphibious Vehicle Market, offering a detailed forecast from 2025 to 2033. Valued at xx Million in 2025, the market is poised for significant growth, driven by technological advancements and increasing defense budgets globally. This report meticulously examines market trends, competitive dynamics, and future opportunities, providing critical insights for stakeholders across the defense and security sectors. The study period covers 2019-2033, with 2025 serving as both the base and estimated year.
Military Amphibious Vehicle Market Market Composition & Trends
This section delves into the intricate composition of the Military Amphibious Vehicle market, analyzing market concentration, innovation drivers, and regulatory influences. We examine the competitive landscape, detailing market share distribution among key players like Textron Inc, General Dynamics Corporation, Rheinmetall AG, and Lockheed Martin Corporation. The report also quantifies the impact of M&A activities, providing insights into deal values and their influence on market dynamics. We explore the role of substitute products, end-user profiles (military branches and their specific needs), and the evolving regulatory landscape impacting market growth and adoption. The analysis reveals a moderately concentrated market with ongoing consolidation, driven by a need for technological advancements and increased defense spending. Several key trends are highlighted, including:
- Market Share Distribution: Textron Inc holds an estimated xx% market share in 2025, followed by General Dynamics Corporation with xx%. The remaining share is distributed among other key players.
- M&A Activity: The report details xx Million worth of M&A deals within the past five years, significantly impacting market consolidation and technological advancements.
- Regulatory Landscape: The impact of evolving export controls and defense procurement regulations on market access and growth is thoroughly examined.
Military Amphibious Vehicle Market Industry Evolution
This section meticulously traces the evolution of the Military Amphibious Vehicle market, analyzing historical and projected growth trajectories. We examine the influence of technological advancements, such as the integration of advanced sensors, improved propulsion systems, and enhanced survivability features. The report also explores shifting consumer demands, focusing on the changing operational requirements of militaries worldwide. We analyze the impact of evolving geopolitical landscapes and their implications for military spending and procurement priorities. Key data points, such as annual growth rates (CAGR) for the historical period (2019-2024) and the forecast period (2025-2033), are provided. The analysis reveals a steady market growth trajectory, with a projected CAGR of xx% during the forecast period, primarily driven by technological upgrades and increased demand from various global defense forces. The adoption of new technologies, particularly in areas like autonomy and improved amphibious capabilities, is also examined.
Leading Regions, Countries, or Segments in Military Amphibious Vehicle Market
This section pinpoints the leading regions, countries, and market segments within the Military Amphibious Vehicle market. We provide a detailed analysis of the dominant segments: Amphibious Armored Vehicles and Hovercraft, identifying key drivers of their success.
Amphibious Armored Vehicles:
- Key Drivers: Increased defense spending in North America and Asia-Pacific, demand for advanced protection systems, and modernization programs within armed forces.
- Dominance Factors: The segment’s dominance is rooted in its versatile functionality, combining land and water mobility for diverse military applications. The report provides a detailed regional breakdown of this dominance.
Hovercraft:
- Key Drivers: The need for rapid deployment in challenging terrains, particularly coastal and littoral regions, and their unique capabilities for shallow-water operations.
- Dominance Factors: While smaller in market share compared to armored vehicles, hovercraft are critical for specialized operations, leading to sustained demand from specific military branches.
The report includes a comprehensive geographical analysis of market performance in key regions, such as North America, Europe, Asia-Pacific, and others, highlighting regional variations in growth trajectories and driving factors.
Military Amphibious Vehicle Market Product Innovations
Recent innovations in Military Amphibious Vehicles focus on enhanced mobility, survivability, and operational efficiency. This includes advancements in propulsion systems, improved armor protection, and integration of advanced communication and sensor technologies. The development of lighter, yet more robust designs, along with the incorporation of hybrid or electric propulsion systems, are key areas of focus. Unique selling propositions revolve around enhanced speed and maneuverability across diverse terrains, improved operational range, and reduced maintenance costs. These technological advancements directly improve operational readiness and effectiveness in diverse environments.
Propelling Factors for Military Amphibious Vehicle Market Growth
Several factors propel the growth of the Military Amphibious Vehicle market. Increased global defense spending, particularly in regions experiencing geopolitical instability, significantly fuels demand. Technological advancements, enhancing the capabilities and operational efficiency of these vehicles, are another key driver. Furthermore, stringent requirements for enhanced mobility and versatility across diverse terrains are pushing innovation and adoption within the sector. Government initiatives aimed at modernizing defense capabilities are also playing a significant role.
Obstacles in the Military Amphibious Vehicle Market Market
The Military Amphibious Vehicle market faces challenges, including stringent regulatory approvals for new technologies and export restrictions. Supply chain disruptions, particularly impacting specialized components, can hinder production and delivery timelines. Intense competition among established players and the emergence of new entrants also put pressure on pricing and profitability. These obstacles have a quantifiable impact on market growth, estimated at a xx% reduction in projected sales over the forecast period in certain segments.
Future Opportunities in Military Amphibious Vehicle Market
The future of the Military Amphibious Vehicle market holds immense potential. Emerging markets in developing economies present significant growth opportunities. The integration of autonomous systems, advanced sensor technologies, and improved communication networks will further enhance capabilities and drive adoption. The development of hybrid and electric propulsion systems offers opportunities for reducing fuel consumption and emissions, addressing environmental concerns.
Major Players in the Military Amphibious Vehicle Market Ecosystem
- Textron Inc
- General Dynamics Corporation
- Rheinmetall AG
- Lockheed Martin Corporation
- WFEL Ltd
- Griffon Hoverwork Ltd (GHL)
- Norinco Private Limited
- BAE Systems PLC
- Tata Motors Ltd
- Arquus
- Krauss-Maffei Wegmann GmbH & Co KG
- Oshkosh Corporation
Key Developments in Military Amphibious Vehicle Market Industry
- January 2023: Lockheed Martin announces a new amphibious vehicle prototype with advanced sensor integration.
- June 2022: General Dynamics secures a major contract for the supply of amphibious armored vehicles to a foreign government.
- October 2021: Rheinmetall AG unveils a new generation of hovercraft designed for littoral operations. (Further details on key developments are included within the full report).
Strategic Military Amphibious Vehicle Market Market Forecast
The Military Amphibious Vehicle market exhibits strong growth potential, driven by sustained defense spending and continuous technological advancements. Future opportunities lie in the development of autonomous and AI-enhanced systems, improving the operational effectiveness and reducing human risk. The focus on hybrid and electric propulsion, along with the expansion into new geographical markets, promises further market expansion and innovation in the coming years. The market is expected to reach xx Million by 2033.
Military Amphibious Vehicle Market Segmentation
-
1. Type
- 1.1. Amphibious Armored Vehicles
- 1.2. Hovercraft
Military Amphibious Vehicle Market Segmentation By Geography
-
1. North America
- 1.1. North America
- 1.2. Canada
-
2. Europe
- 2.1. United Kingdom
- 2.2. Germany
- 2.3. France
- 2.4. Russia
- 2.5. Rest of Europe
-
3. Asia Pacific
- 3.1. China
- 3.2. India
- 3.3. Japan
- 3.4. South Korea
- 3.5. Rest of Asia Pacific
-
4. Latin America
- 4.1. Brazil
- 4.2. Mexico
- 4.3. Rest of Latin America
-
5. Middle East and Africa
- 5.1. United Arab Emirates
- 5.2. Saudi Arabia
- 5.3. Qatar
- 5.4. South Africa
- 5.5. Rest of Middle East and Africa
Military Amphibious Vehicle Market Regional Market Share
Geographic Coverage of Military Amphibious Vehicle Market
Military Amphibious Vehicle Market REPORT HIGHLIGHTS
| Aspects | Details |
|---|---|
| Study Period | 2020-2034 |
| Base Year | 2025 |
| Estimated Year | 2026 |
| Forecast Period | 2026-2034 |
| Historical Period | 2020-2025 |
| Growth Rate | CAGR of 7.92% from 2020-2034 |
| Segmentation |
|
Table of Contents
- 1. Introduction
- 1.1. Research Scope
- 1.2. Market Segmentation
- 1.3. Research Objective
- 1.4. Definitions and Assumptions
- 2. Executive Summary
- 2.1. Market Snapshot
- 3. Market Dynamics
- 3.1. Market Drivers
- 3.2. Market Restrains
- 3.3. Market Trends
- 3.4. Market Opportunities
- 4. Market Factor Analysis
- 4.1. Porters Five Forces
- 4.1.1. Bargaining Power of Suppliers
- 4.1.2. Bargaining Power of Buyers
- 4.1.3. Threat of New Entrants
- 4.1.4. Threat of Substitutes
- 4.1.5. Competitive Rivalry
- 4.2. PESTEL analysis
- 4.3. BCG Analysis
- 4.3.1. Stars (High Growth, High Market Share)
- 4.3.2. Cash Cows (Low Growth, High Market Share)
- 4.3.3. Question Mark (High Growth, Low Market Share)
- 4.3.4. Dogs (Low Growth, Low Market Share)
- 4.4. Ansoff Matrix Analysis
- 4.5. Supply Chain Analysis
- 4.6. Regulatory Landscape
- 4.7. Current Market Potential and Opportunity Assessment (TAM–SAM–SOM Framework)
- 4.8. DMV Analyst Note
- 4.1. Porters Five Forces
- 5. Market Analysis, Insights and Forecast 2021-2033
- 5.1. Market Analysis, Insights and Forecast - by Type
- 5.1.1. Amphibious Armored Vehicles
- 5.1.2. Hovercraft
- 5.2. Market Analysis, Insights and Forecast - by Region
- 5.2.1. North America
- 5.2.2. Europe
- 5.2.3. Asia Pacific
- 5.2.4. Latin America
- 5.2.5. Middle East and Africa
- 5.1. Market Analysis, Insights and Forecast - by Type
- 6. Global Military Amphibious Vehicle Market Analysis, Insights and Forecast, 2021-2033
- 6.1. Market Analysis, Insights and Forecast - by Type
- 6.1.1. Amphibious Armored Vehicles
- 6.1.2. Hovercraft
- 6.1. Market Analysis, Insights and Forecast - by Type
- 7. North America Military Amphibious Vehicle Market Analysis, Insights and Forecast, 2020-2032
- 7.1. Market Analysis, Insights and Forecast - by Type
- 7.1.1. Amphibious Armored Vehicles
- 7.1.2. Hovercraft
- 7.1. Market Analysis, Insights and Forecast - by Type
- 8. Europe Military Amphibious Vehicle Market Analysis, Insights and Forecast, 2020-2032
- 8.1. Market Analysis, Insights and Forecast - by Type
- 8.1.1. Amphibious Armored Vehicles
- 8.1.2. Hovercraft
- 8.1. Market Analysis, Insights and Forecast - by Type
- 9. Asia Pacific Military Amphibious Vehicle Market Analysis, Insights and Forecast, 2020-2032
- 9.1. Market Analysis, Insights and Forecast - by Type
- 9.1.1. Amphibious Armored Vehicles
- 9.1.2. Hovercraft
- 9.1. Market Analysis, Insights and Forecast - by Type
- 10. Latin America Military Amphibious Vehicle Market Analysis, Insights and Forecast, 2020-2032
- 10.1. Market Analysis, Insights and Forecast - by Type
- 10.1.1. Amphibious Armored Vehicles
- 10.1.2. Hovercraft
- 10.1. Market Analysis, Insights and Forecast - by Type
- 11. Middle East and Africa Military Amphibious Vehicle Market Analysis, Insights and Forecast, 2020-2032
- 11.1. Market Analysis, Insights and Forecast - by Type
- 11.1.1. Amphibious Armored Vehicles
- 11.1.2. Hovercraft
- 11.1. Market Analysis, Insights and Forecast - by Type
- 12. Competitive Analysis
- 12.1. Company Profiles
- 12.1.1 Textron Inc
- 12.1.1.1. Company Overview
- 12.1.1.2. Products
- 12.1.1.3. Company Financials
- 12.1.1.4. SWOT Analysis
- 12.1.2 General Dynamics Corporation
- 12.1.2.1. Company Overview
- 12.1.2.2. Products
- 12.1.2.3. Company Financials
- 12.1.2.4. SWOT Analysis
- 12.1.3 Rheinmetall AG
- 12.1.3.1. Company Overview
- 12.1.3.2. Products
- 12.1.3.3. Company Financials
- 12.1.3.4. SWOT Analysis
- 12.1.4 Lockheed Martin Corporation
- 12.1.4.1. Company Overview
- 12.1.4.2. Products
- 12.1.4.3. Company Financials
- 12.1.4.4. SWOT Analysis
- 12.1.5 WFEL Ltd
- 12.1.5.1. Company Overview
- 12.1.5.2. Products
- 12.1.5.3. Company Financials
- 12.1.5.4. SWOT Analysis
- 12.1.6 Griffon Hoverwork Ltd (GHL)
- 12.1.6.1. Company Overview
- 12.1.6.2. Products
- 12.1.6.3. Company Financials
- 12.1.6.4. SWOT Analysis
- 12.1.7 Norinco Private Limited
- 12.1.7.1. Company Overview
- 12.1.7.2. Products
- 12.1.7.3. Company Financials
- 12.1.7.4. SWOT Analysis
- 12.1.8 BAE Systems PLC
- 12.1.8.1. Company Overview
- 12.1.8.2. Products
- 12.1.8.3. Company Financials
- 12.1.8.4. SWOT Analysis
- 12.1.9 Tata Motors Ltd
- 12.1.9.1. Company Overview
- 12.1.9.2. Products
- 12.1.9.3. Company Financials
- 12.1.9.4. SWOT Analysis
- 12.1.10 Arquus
- 12.1.10.1. Company Overview
- 12.1.10.2. Products
- 12.1.10.3. Company Financials
- 12.1.10.4. SWOT Analysis
- 12.1.11 Krauss-Maffei Wegmann GmbH & Co KG
- 12.1.11.1. Company Overview
- 12.1.11.2. Products
- 12.1.11.3. Company Financials
- 12.1.11.4. SWOT Analysis
- 12.1.12 Oshkosh Corporatio
- 12.1.12.1. Company Overview
- 12.1.12.2. Products
- 12.1.12.3. Company Financials
- 12.1.12.4. SWOT Analysis
- 12.1.1 Textron Inc
- 12.2. Market Entropy
- 12.2.1 Company's Key Areas Served
- 12.2.2 Recent Developments
- 12.3. Company Market Share Analysis 2025
- 12.3.1 Top 5 Companies Market Share Analysis
- 12.3.2 Top 3 Companies Market Share Analysis
- 12.4. List of Potential Customers
- 13. Research Methodology
List of Figures
- Figure 1: Global Military Amphibious Vehicle Market Revenue Breakdown (Million, %) by Region 2025 & 2033
- Figure 2: North America Military Amphibious Vehicle Market Revenue (Million), by Type 2025 & 2033
- Figure 3: North America Military Amphibious Vehicle Market Revenue Share (%), by Type 2025 & 2033
- Figure 4: North America Military Amphibious Vehicle Market Revenue (Million), by Country 2025 & 2033
- Figure 5: North America Military Amphibious Vehicle Market Revenue Share (%), by Country 2025 & 2033
- Figure 6: Europe Military Amphibious Vehicle Market Revenue (Million), by Type 2025 & 2033
- Figure 7: Europe Military Amphibious Vehicle Market Revenue Share (%), by Type 2025 & 2033
- Figure 8: Europe Military Amphibious Vehicle Market Revenue (Million), by Country 2025 & 2033
- Figure 9: Europe Military Amphibious Vehicle Market Revenue Share (%), by Country 2025 & 2033
- Figure 10: Asia Pacific Military Amphibious Vehicle Market Revenue (Million), by Type 2025 & 2033
- Figure 11: Asia Pacific Military Amphibious Vehicle Market Revenue Share (%), by Type 2025 & 2033
- Figure 12: Asia Pacific Military Amphibious Vehicle Market Revenue (Million), by Country 2025 & 2033
- Figure 13: Asia Pacific Military Amphibious Vehicle Market Revenue Share (%), by Country 2025 & 2033
- Figure 14: Latin America Military Amphibious Vehicle Market Revenue (Million), by Type 2025 & 2033
- Figure 15: Latin America Military Amphibious Vehicle Market Revenue Share (%), by Type 2025 & 2033
- Figure 16: Latin America Military Amphibious Vehicle Market Revenue (Million), by Country 2025 & 2033
- Figure 17: Latin America Military Amphibious Vehicle Market Revenue Share (%), by Country 2025 & 2033
- Figure 18: Middle East and Africa Military Amphibious Vehicle Market Revenue (Million), by Type 2025 & 2033
- Figure 19: Middle East and Africa Military Amphibious Vehicle Market Revenue Share (%), by Type 2025 & 2033
- Figure 20: Middle East and Africa Military Amphibious Vehicle Market Revenue (Million), by Country 2025 & 2033
- Figure 21: Middle East and Africa Military Amphibious Vehicle Market Revenue Share (%), by Country 2025 & 2033
List of Tables
- Table 1: Global Military Amphibious Vehicle Market Revenue Million Forecast, by Type 2020 & 2033
- Table 2: Global Military Amphibious Vehicle Market Revenue Million Forecast, by Region 2020 & 2033
- Table 3: Global Military Amphibious Vehicle Market Revenue Million Forecast, by Type 2020 & 2033
- Table 4: Global Military Amphibious Vehicle Market Revenue Million Forecast, by Country 2020 & 2033
- Table 5: North America Military Amphibious Vehicle Market Revenue (Million) Forecast, by Application 2020 & 2033
- Table 6: Canada Military Amphibious Vehicle Market Revenue (Million) Forecast, by Application 2020 & 2033
- Table 7: Global Military Amphibious Vehicle Market Revenue Million Forecast, by Type 2020 & 2033
- Table 8: Global Military Amphibious Vehicle Market Revenue Million Forecast, by Country 2020 & 2033
- Table 9: United Kingdom Military Amphibious Vehicle Market Revenue (Million) Forecast, by Application 2020 & 2033
- Table 10: Germany Military Amphibious Vehicle Market Revenue (Million) Forecast, by Application 2020 & 2033
- Table 11: France Military Amphibious Vehicle Market Revenue (Million) Forecast, by Application 2020 & 2033
- Table 12: Russia Military Amphibious Vehicle Market Revenue (Million) Forecast, by Application 2020 & 2033
- Table 13: Rest of Europe Military Amphibious Vehicle Market Revenue (Million) Forecast, by Application 2020 & 2033
- Table 14: Global Military Amphibious Vehicle Market Revenue Million Forecast, by Type 2020 & 2033
- Table 15: Global Military Amphibious Vehicle Market Revenue Million Forecast, by Country 2020 & 2033
- Table 16: China Military Amphibious Vehicle Market Revenue (Million) Forecast, by Application 2020 & 2033
- Table 17: India Military Amphibious Vehicle Market Revenue (Million) Forecast, by Application 2020 & 2033
- Table 18: Japan Military Amphibious Vehicle Market Revenue (Million) Forecast, by Application 2020 & 2033
- Table 19: South Korea Military Amphibious Vehicle Market Revenue (Million) Forecast, by Application 2020 & 2033
- Table 20: Rest of Asia Pacific Military Amphibious Vehicle Market Revenue (Million) Forecast, by Application 2020 & 2033
- Table 21: Global Military Amphibious Vehicle Market Revenue Million Forecast, by Type 2020 & 2033
- Table 22: Global Military Amphibious Vehicle Market Revenue Million Forecast, by Country 2020 & 2033
- Table 23: Brazil Military Amphibious Vehicle Market Revenue (Million) Forecast, by Application 2020 & 2033
- Table 24: Mexico Military Amphibious Vehicle Market Revenue (Million) Forecast, by Application 2020 & 2033
- Table 25: Rest of Latin America Military Amphibious Vehicle Market Revenue (Million) Forecast, by Application 2020 & 2033
- Table 26: Global Military Amphibious Vehicle Market Revenue Million Forecast, by Type 2020 & 2033
- Table 27: Global Military Amphibious Vehicle Market Revenue Million Forecast, by Country 2020 & 2033
- Table 28: United Arab Emirates Military Amphibious Vehicle Market Revenue (Million) Forecast, by Application 2020 & 2033
- Table 29: Saudi Arabia Military Amphibious Vehicle Market Revenue (Million) Forecast, by Application 2020 & 2033
- Table 30: Qatar Military Amphibious Vehicle Market Revenue (Million) Forecast, by Application 2020 & 2033
- Table 31: South Africa Military Amphibious Vehicle Market Revenue (Million) Forecast, by Application 2020 & 2033
- Table 32: Rest of Middle East and Africa Military Amphibious Vehicle Market Revenue (Million) Forecast, by Application 2020 & 2033
Frequently Asked Questions
1. What is the projected Compound Annual Growth Rate (CAGR) of the Military Amphibious Vehicle Market?
The projected CAGR is approximately 7.92%.
2. Which companies are prominent players in the Military Amphibious Vehicle Market?
Key companies in the market include Textron Inc, General Dynamics Corporation, Rheinmetall AG, Lockheed Martin Corporation, WFEL Ltd, Griffon Hoverwork Ltd (GHL), Norinco Private Limited, BAE Systems PLC, Tata Motors Ltd, Arquus, Krauss-Maffei Wegmann GmbH & Co KG, Oshkosh Corporatio.
3. What are the main segments of the Military Amphibious Vehicle Market?
The market segments include Type.
4. Can you provide details about the market size?
The market size is estimated to be USD 2.71 Million as of 2022.
5. What are some drivers contributing to market growth?
N/A
6. What are the notable trends driving market growth?
The Amphibious Armored Vehicles Segment Dominates the Market During the Forecast Period.
7. Are there any restraints impacting market growth?
N/A
8. Can you provide examples of recent developments in the market?
N/A
9. What pricing options are available for accessing the report?
Pricing options include single-user, multi-user, and enterprise licenses priced at USD 4750, USD 5250, and USD 8750 respectively.
10. Is the market size provided in terms of value or volume?
The market size is provided in terms of value, measured in Million.
11. Are there any specific market keywords associated with the report?
Yes, the market keyword associated with the report is "Military Amphibious Vehicle Market," which aids in identifying and referencing the specific market segment covered.
12. How do I determine which pricing option suits my needs best?
The pricing options vary based on user requirements and access needs. Individual users may opt for single-user licenses, while businesses requiring broader access may choose multi-user or enterprise licenses for cost-effective access to the report.
13. Are there any additional resources or data provided in the Military Amphibious Vehicle Market report?
While the report offers comprehensive insights, it's advisable to review the specific contents or supplementary materials provided to ascertain if additional resources or data are available.
14. How can I stay updated on further developments or reports in the Military Amphibious Vehicle Market?
To stay informed about further developments, trends, and reports in the Military Amphibious Vehicle Market, consider subscribing to industry newsletters, following relevant companies and organizations, or regularly checking reputable industry news sources and publications.
Methodology
Step 1 - Identification of Relevant Samples Size from Population Database


Step 2 - Approaches for Defining Global Market Size (Value, Volume* & Price*)

Note*: In applicable scenarios
Step 3 - Data Sources
Primary Research
- Web Analytics
- Survey Reports
- Research Institute
- Latest Research Reports
- Opinion Leaders
Secondary Research
- Annual Reports
- White Paper
- Latest Press Release
- Industry Association
- Paid Database
- Investor Presentations

Step 4 - Data Triangulation
Involves using different sources of information in order to increase the validity of a study
These sources are likely to be stakeholders in a program - participants, other researchers, program staff, other community members, and so on.
Then we put all data in single framework & apply various statistical tools to find out the dynamic on the market.
During the analysis stage, feedback from the stakeholder groups would be compared to determine areas of agreement as well as areas of divergence