

Key Insights
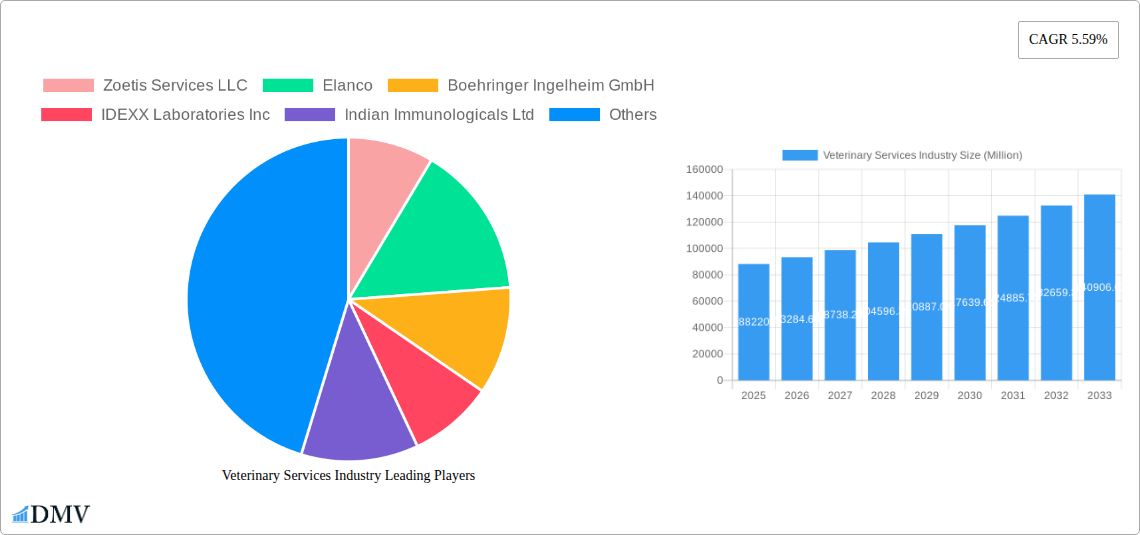
The global veterinary services market, valued at $88.22 billion in 2025, is projected to experience robust growth, driven by several key factors. Increasing pet ownership worldwide, coupled with rising pet humanization—treating pets as family members—fuels demand for higher quality and more specialized veterinary care. This trend is particularly evident in developed nations like those in North America and Europe, but is rapidly expanding in developing economies across Asia-Pacific and South America as disposable incomes rise. Technological advancements, including advanced diagnostic imaging (like MRI and CT scans), minimally invasive surgical techniques, and telehealth platforms, are enhancing service quality and accessibility, further propelling market growth. The market segmentation reveals a significant portion dedicated to companion animals, reflecting the strong emotional bond between humans and their pets. However, the production animal segment also contributes substantially, driven by the need for disease prevention and efficient livestock management in the agricultural sector. The increasing prevalence of chronic diseases in both companion and production animals creates a consistently high demand for specialty services and ongoing care.
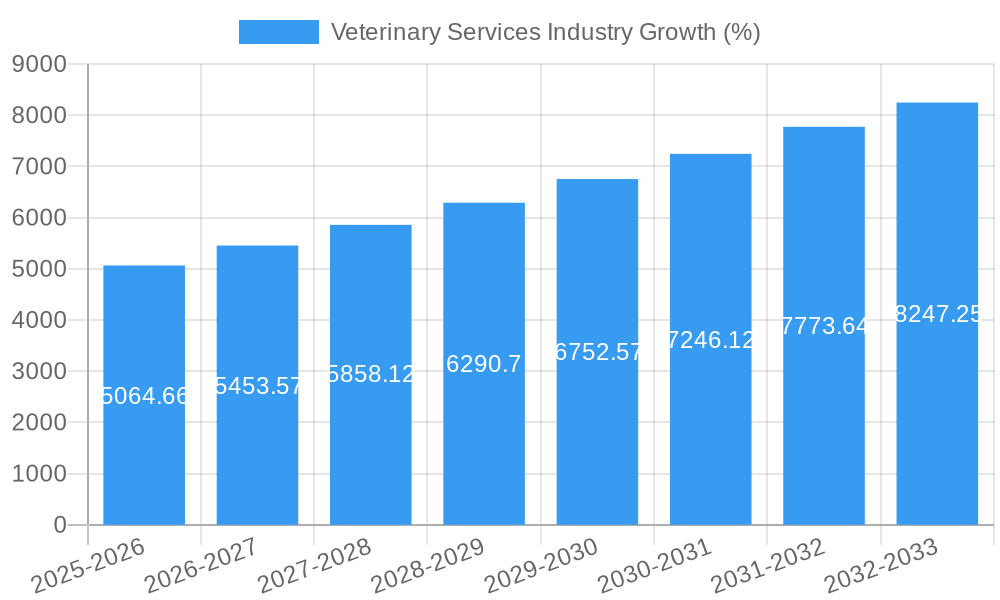
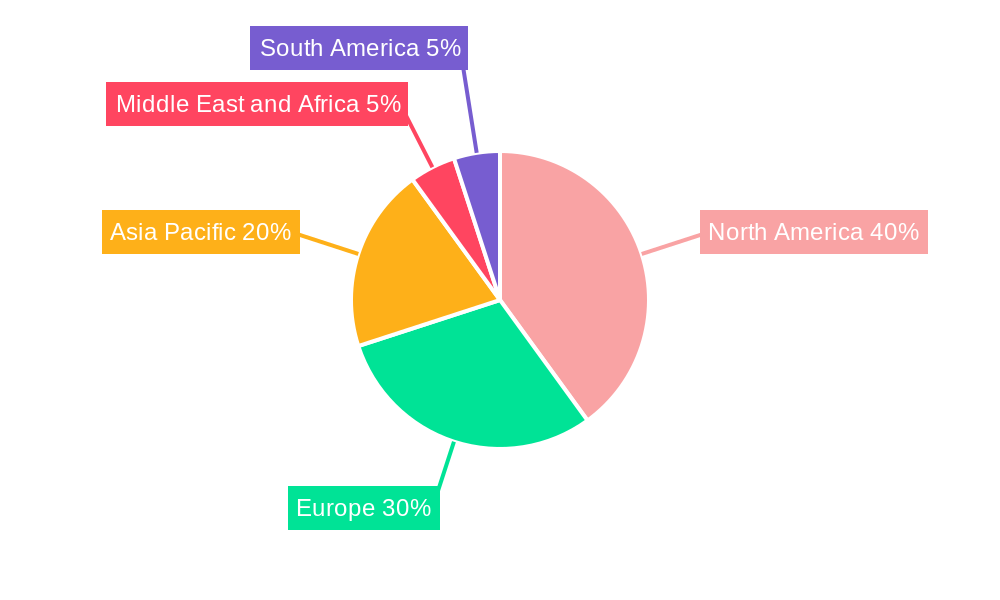
The market's growth, estimated at a CAGR of 5.59%, is expected to continue through 2033. However, several factors could influence this trajectory. Rising veterinary service costs, particularly for specialized treatments and emergency care, pose a potential restraint for some pet owners. Furthermore, geographical variations in veterinary infrastructure and access to care influence market penetration differently across regions. North America and Europe currently dominate the market due to higher pet ownership rates and advanced healthcare infrastructure. Nevertheless, the Asia-Pacific region is poised for significant growth as economic development and increasing pet ownership create substantial opportunities. Competitive landscape analysis indicates a mix of large multinational corporations and regional players, with ongoing mergers and acquisitions expected to shape market consolidation in the coming years. Companies are focusing on innovation, expanding their service portfolios, and strategically entering emerging markets to capture a larger market share.
Veterinary Services Industry Market Report: 2019-2033
This comprehensive report provides a detailed analysis of the Veterinary Services Industry, projecting a market value exceeding $XX Million by 2033. The study period covers 2019-2033, with 2025 as the base and estimated year. The report offers invaluable insights for stakeholders, investors, and industry professionals seeking to navigate this dynamic market. Key players such as Zoetis Services LLC, Elanco, Boehringer Ingelheim GmbH, and IDEXX Laboratories Inc. are analyzed, along with emerging trends and opportunities.
Veterinary Services Industry Market Composition & Trends
The global veterinary services market, valued at $XX Million in 2024, exhibits a moderately concentrated landscape with key players commanding significant market share. Zoetis Services LLC and Elanco hold a combined market share of approximately xx%, showcasing the industry's consolidated nature. However, the market also features several smaller, specialized players, particularly in niche segments like specialty services for companion animals. Innovation is a crucial catalyst, driven by advancements in diagnostic technologies, personalized medicine, and telehealth solutions. Stringent regulatory landscapes, varying across regions, significantly impact market access and product approvals. Substitute products, such as home remedies and alternative therapies, pose a moderate competitive threat, particularly in the companion animal segment. The end-user profile encompasses individual pet owners, veterinary clinics, animal hospitals, farms, and government agencies. The historical period (2019-2024) witnessed significant M&A activity, with deal values exceeding $XX Million, primarily driven by strategic acquisitions aimed at expanding market reach and product portfolios.
- Market Share Distribution (2024): Zoetis Services LLC (xx%), Elanco (xx%), Boehringer Ingelheim GmbH (xx%), IDEXX Laboratories Inc. (xx%), Others (xx%).
- M&A Deal Value (2019-2024): $XX Million
- Key Innovation Catalysts: Advancements in diagnostics, personalized medicine, and telehealth.
- Regulatory Landscape: Stringent regulations impacting market access and product approvals, varying by region.
Veterinary Services Industry Industry Evolution
The veterinary services market has witnessed robust growth, exceeding xx% CAGR between 2019 and 2024, fueled by factors such as increasing pet ownership, rising pet healthcare expenditure, and growing awareness of animal welfare. Technological advancements, particularly in diagnostics and therapeutics, have significantly improved the quality and efficiency of veterinary care. The adoption rate of advanced diagnostic tools, such as MRI and CT scans, has increased by xx% since 2019. Consumer demands are shifting towards more personalized and specialized care, driving growth in segments like specialty services and telehealth. This increased demand for specialized care is further amplified by the increasing humanization of pets and a willingness to invest more in their well-being. Furthermore, the growing prevalence of chronic diseases in animals is increasing the demand for ongoing veterinary care, further contributing to market growth. The forecast period (2025-2033) projects continued expansion, driven by sustained technological advancements and evolving consumer preferences.
Leading Regions, Countries, or Segments in Veterinary Services Industry
The North American region currently dominates the global veterinary services market, driven by high pet ownership rates, strong regulatory support, and significant investment in animal healthcare infrastructure. The companion animal segment holds the largest market share, with the primary care sub-segment exhibiting the highest growth trajectory. Europe and Asia-Pacific are projected to witness significant growth in the forecast period.
- Dominant Region: North America
- Dominant Segment (By Animal Type): Companion Animal
- Dominant Segment (By Type of Care): Primary Care
- Key Drivers (North America):
- High pet ownership rates
- Strong regulatory support for animal health innovation
- Significant investment in animal healthcare infrastructure
Veterinary Services Industry Product Innovations
Recent innovations include advanced diagnostic tools (e.g., point-of-care diagnostics), personalized medicine approaches tailored to specific animal breeds and diseases, and the development of novel therapeutics. These innovations enhance the accuracy, speed, and effectiveness of veterinary care, leading to improved animal health outcomes. The use of telemedicine platforms is also gaining traction, providing convenient access to veterinary services, particularly for remote areas and specialized consultations.
Propelling Factors for Veterinary Services Industry Growth
Technological advancements in diagnostics, therapeutics, and telehealth are key growth drivers. Rising pet ownership and increasing disposable incomes are boosting expenditure on pet healthcare. Favorable regulatory environments in certain regions, promoting innovation and market access, are further enhancing growth. The increasing prevalence of chronic diseases in animals fuels demand for ongoing veterinary services.
Obstacles in the Veterinary Services Industry Market
Regulatory hurdles for new product approvals and market entry present significant challenges. Supply chain disruptions can impact the availability of essential medications and equipment, leading to treatment delays and increased costs. Intense competition among established players and the emergence of new entrants create pricing pressures and limit profitability.
Future Opportunities in Veterinary Services Industry
Expansion into emerging markets with growing pet ownership, particularly in Asia-Pacific and Latin America, offers significant growth potential. Development of innovative diagnostic tools and personalized medicine solutions for specific animal species and diseases are key opportunities. Telemedicine and remote monitoring technologies will continue to reshape veterinary service delivery.
Major Players in the Veterinary Services Industry Ecosystem
- Zoetis Services LLC
- Elanco
- Boehringer Ingelheim GmbH
- IDEXX Laboratories Inc
- Indian Immunologicals Ltd
- Vetoquinol S A
- Hester Bioscience
- Heska Corp
- Ceva Sant Animale
- Phibro Animal Health
- Virbac
- Merck Animal Health
Key Developments in Veterinary Services Industry Industry
- April 2022: Animalcare launched Plaqtiv+, a range of dental care products for cats and dogs designed to reduce calculus formation, impacting the companion animal dental care market.
- April 2022: Aurena Laboratories AB (Aurena) entered a collaboration with Swedish start-up Emollivet, expanding the availability of innovative animal healthcare products based on Lipitor AKVANO technology.
Strategic Veterinary Services Industry Market Forecast
The veterinary services market is poised for substantial growth over the forecast period (2025-2033), driven by technological innovation, increasing pet ownership, and rising consumer spending on animal healthcare. Emerging markets and the expansion of specialized services will further fuel market expansion. The market's robust growth trajectory indicates significant potential for investors and industry players.
Veterinary Services Industry Segmentation
-
1. Animal Type
- 1.1. Companion Animal
- 1.2. Production Animal
-
2. Type of Care
- 2.1. Primary
- 2.2. Emergency
- 2.3. Critical
- 2.4. Specialty Services
- 2.5. Others S
Veterinary Services Industry Segmentation By Geography
-
1. North America
- 1.1. United States
- 1.2. Canada
- 1.3. Mexico
-
2. Europe
- 2.1. Germany
- 2.2. United Kingdom
- 2.3. France
- 2.4. Italy
- 2.5. Spain
- 2.6. Rest of Europe
-
3. Asia Pacific
- 3.1. China
- 3.2. Japan
- 3.3. India
- 3.4. Australia
- 3.5. South Korea
- 3.6. Rest of Asia Pacific
-
4. Middle East and Africa
- 4.1. GCC
- 4.2. South Africa
- 4.3. Rest of Middle East and Africa
-
5. South America
- 5.1. Brazil
- 5.2. Argentina
- 5.3. Rest of South America
Veterinary Services Industry REPORT HIGHLIGHTS
| Aspects | Details |
|---|---|
| Study Period | 2019-2033 |
| Base Year | 2024 |
| Estimated Year | 2025 |
| Forecast Period | 2025-2033 |
| Historical Period | 2019-2024 |
| Growth Rate | CAGR of 5.59% from 2019-2033 |
| Segmentation |
|
Table of Contents
- 1. Introduction
- 1.1. Research Scope
- 1.2. Market Segmentation
- 1.3. Research Methodology
- 1.4. Definitions and Assumptions
- 2. Executive Summary
- 2.1. Introduction
- 3. Market Dynamics
- 3.1. Introduction
- 3.2. Market Drivers
- 3.2.1. Rising Chronic Diseases and Awareness Regarding Veterinary Care; Increasing Initiatives by Governments and Animal Welfare Associations in Different Countries
- 3.3. Market Restrains
- 3.3.1. Increasing Costs of Animal Care Product and Veterinary Services
- 3.4. Market Trends
- 3.4.1. Companion Animal Segment is Expected to Hold Significant Market Share in the Market Over the Forecast Period
- 4. Market Factor Analysis
- 4.1. Porters Five Forces
- 4.2. Supply/Value Chain
- 4.3. PESTEL analysis
- 4.4. Market Entropy
- 4.5. Patent/Trademark Analysis
- 5. Global Veterinary Services Industry Analysis, Insights and Forecast, 2019-2031
- 5.1. Market Analysis, Insights and Forecast - by Animal Type
- 5.1.1. Companion Animal
- 5.1.2. Production Animal
- 5.2. Market Analysis, Insights and Forecast - by Type of Care
- 5.2.1. Primary
- 5.2.2. Emergency
- 5.2.3. Critical
- 5.2.4. Specialty Services
- 5.2.5. Others S
- 5.3. Market Analysis, Insights and Forecast - by Region
- 5.3.1. North America
- 5.3.2. Europe
- 5.3.3. Asia Pacific
- 5.3.4. Middle East and Africa
- 5.3.5. South America
- 5.1. Market Analysis, Insights and Forecast - by Animal Type
- 6. North America Veterinary Services Industry Analysis, Insights and Forecast, 2019-2031
- 6.1. Market Analysis, Insights and Forecast - by Animal Type
- 6.1.1. Companion Animal
- 6.1.2. Production Animal
- 6.2. Market Analysis, Insights and Forecast - by Type of Care
- 6.2.1. Primary
- 6.2.2. Emergency
- 6.2.3. Critical
- 6.2.4. Specialty Services
- 6.2.5. Others S
- 6.1. Market Analysis, Insights and Forecast - by Animal Type
- 7. Europe Veterinary Services Industry Analysis, Insights and Forecast, 2019-2031
- 7.1. Market Analysis, Insights and Forecast - by Animal Type
- 7.1.1. Companion Animal
- 7.1.2. Production Animal
- 7.2. Market Analysis, Insights and Forecast - by Type of Care
- 7.2.1. Primary
- 7.2.2. Emergency
- 7.2.3. Critical
- 7.2.4. Specialty Services
- 7.2.5. Others S
- 7.1. Market Analysis, Insights and Forecast - by Animal Type
- 8. Asia Pacific Veterinary Services Industry Analysis, Insights and Forecast, 2019-2031
- 8.1. Market Analysis, Insights and Forecast - by Animal Type
- 8.1.1. Companion Animal
- 8.1.2. Production Animal
- 8.2. Market Analysis, Insights and Forecast - by Type of Care
- 8.2.1. Primary
- 8.2.2. Emergency
- 8.2.3. Critical
- 8.2.4. Specialty Services
- 8.2.5. Others S
- 8.1. Market Analysis, Insights and Forecast - by Animal Type
- 9. Middle East and Africa Veterinary Services Industry Analysis, Insights and Forecast, 2019-2031
- 9.1. Market Analysis, Insights and Forecast - by Animal Type
- 9.1.1. Companion Animal
- 9.1.2. Production Animal
- 9.2. Market Analysis, Insights and Forecast - by Type of Care
- 9.2.1. Primary
- 9.2.2. Emergency
- 9.2.3. Critical
- 9.2.4. Specialty Services
- 9.2.5. Others S
- 9.1. Market Analysis, Insights and Forecast - by Animal Type
- 10. South America Veterinary Services Industry Analysis, Insights and Forecast, 2019-2031
- 10.1. Market Analysis, Insights and Forecast - by Animal Type
- 10.1.1. Companion Animal
- 10.1.2. Production Animal
- 10.2. Market Analysis, Insights and Forecast - by Type of Care
- 10.2.1. Primary
- 10.2.2. Emergency
- 10.2.3. Critical
- 10.2.4. Specialty Services
- 10.2.5. Others S
- 10.1. Market Analysis, Insights and Forecast - by Animal Type
- 11. North America Veterinary Services Industry Analysis, Insights and Forecast, 2019-2031
- 11.1. Market Analysis, Insights and Forecast - By Country/Sub-region
- 11.1.1 United States
- 11.1.2 Canada
- 11.1.3 Mexico
- 12. Europe Veterinary Services Industry Analysis, Insights and Forecast, 2019-2031
- 12.1. Market Analysis, Insights and Forecast - By Country/Sub-region
- 12.1.1 Germany
- 12.1.2 United Kingdom
- 12.1.3 France
- 12.1.4 Italy
- 12.1.5 Spain
- 12.1.6 Rest of Europe
- 13. Asia Pacific Veterinary Services Industry Analysis, Insights and Forecast, 2019-2031
- 13.1. Market Analysis, Insights and Forecast - By Country/Sub-region
- 13.1.1 China
- 13.1.2 Japan
- 13.1.3 India
- 13.1.4 Australia
- 13.1.5 South Korea
- 13.1.6 Rest of Asia Pacific
- 14. Middle East and Africa Veterinary Services Industry Analysis, Insights and Forecast, 2019-2031
- 14.1. Market Analysis, Insights and Forecast - By Country/Sub-region
- 14.1.1 GCC
- 14.1.2 South Africa
- 14.1.3 Rest of Middle East and Africa
- 15. South America Veterinary Services Industry Analysis, Insights and Forecast, 2019-2031
- 15.1. Market Analysis, Insights and Forecast - By Country/Sub-region
- 15.1.1 Brazil
- 15.1.2 Argentina
- 15.1.3 Rest of South America
- 16. Competitive Analysis
- 16.1. Global Market Share Analysis 2024
- 16.2. Company Profiles
- 16.2.1 Zoetis Services LLC
- 16.2.1.1. Overview
- 16.2.1.2. Products
- 16.2.1.3. SWOT Analysis
- 16.2.1.4. Recent Developments
- 16.2.1.5. Financials (Based on Availability)
- 16.2.2 Elanco
- 16.2.2.1. Overview
- 16.2.2.2. Products
- 16.2.2.3. SWOT Analysis
- 16.2.2.4. Recent Developments
- 16.2.2.5. Financials (Based on Availability)
- 16.2.3 Boehringer Ingelheim GmbH
- 16.2.3.1. Overview
- 16.2.3.2. Products
- 16.2.3.3. SWOT Analysis
- 16.2.3.4. Recent Developments
- 16.2.3.5. Financials (Based on Availability)
- 16.2.4 IDEXX Laboratories Inc
- 16.2.4.1. Overview
- 16.2.4.2. Products
- 16.2.4.3. SWOT Analysis
- 16.2.4.4. Recent Developments
- 16.2.4.5. Financials (Based on Availability)
- 16.2.5 Indian Immunologicals Ltd
- 16.2.5.1. Overview
- 16.2.5.2. Products
- 16.2.5.3. SWOT Analysis
- 16.2.5.4. Recent Developments
- 16.2.5.5. Financials (Based on Availability)
- 16.2.6 Vetoquinol S A
- 16.2.6.1. Overview
- 16.2.6.2. Products
- 16.2.6.3. SWOT Analysis
- 16.2.6.4. Recent Developments
- 16.2.6.5. Financials (Based on Availability)
- 16.2.7 Hester Bioscience
- 16.2.7.1. Overview
- 16.2.7.2. Products
- 16.2.7.3. SWOT Analysis
- 16.2.7.4. Recent Developments
- 16.2.7.5. Financials (Based on Availability)
- 16.2.8 Heska Corp
- 16.2.8.1. Overview
- 16.2.8.2. Products
- 16.2.8.3. SWOT Analysis
- 16.2.8.4. Recent Developments
- 16.2.8.5. Financials (Based on Availability)
- 16.2.9 Ceva Sant Animale
- 16.2.9.1. Overview
- 16.2.9.2. Products
- 16.2.9.3. SWOT Analysis
- 16.2.9.4. Recent Developments
- 16.2.9.5. Financials (Based on Availability)
- 16.2.10 Phibro Animal Health
- 16.2.10.1. Overview
- 16.2.10.2. Products
- 16.2.10.3. SWOT Analysis
- 16.2.10.4. Recent Developments
- 16.2.10.5. Financials (Based on Availability)
- 16.2.11 Virbac
- 16.2.11.1. Overview
- 16.2.11.2. Products
- 16.2.11.3. SWOT Analysis
- 16.2.11.4. Recent Developments
- 16.2.11.5. Financials (Based on Availability)
- 16.2.12 Merck Animal Health
- 16.2.12.1. Overview
- 16.2.12.2. Products
- 16.2.12.3. SWOT Analysis
- 16.2.12.4. Recent Developments
- 16.2.12.5. Financials (Based on Availability)
- 16.2.1 Zoetis Services LLC
List of Figures
- Figure 1: Global Veterinary Services Industry Revenue Breakdown (Million, %) by Region 2024 & 2032
- Figure 2: Global Veterinary Services Industry Volume Breakdown (K Unit, %) by Region 2024 & 2032
- Figure 3: North America Veterinary Services Industry Revenue (Million), by Country 2024 & 2032
- Figure 4: North America Veterinary Services Industry Volume (K Unit), by Country 2024 & 2032
- Figure 5: North America Veterinary Services Industry Revenue Share (%), by Country 2024 & 2032
- Figure 6: North America Veterinary Services Industry Volume Share (%), by Country 2024 & 2032
- Figure 7: Europe Veterinary Services Industry Revenue (Million), by Country 2024 & 2032
- Figure 8: Europe Veterinary Services Industry Volume (K Unit), by Country 2024 & 2032
- Figure 9: Europe Veterinary Services Industry Revenue Share (%), by Country 2024 & 2032
- Figure 10: Europe Veterinary Services Industry Volume Share (%), by Country 2024 & 2032
- Figure 11: Asia Pacific Veterinary Services Industry Revenue (Million), by Country 2024 & 2032
- Figure 12: Asia Pacific Veterinary Services Industry Volume (K Unit), by Country 2024 & 2032
- Figure 13: Asia Pacific Veterinary Services Industry Revenue Share (%), by Country 2024 & 2032
- Figure 14: Asia Pacific Veterinary Services Industry Volume Share (%), by Country 2024 & 2032
- Figure 15: Middle East and Africa Veterinary Services Industry Revenue (Million), by Country 2024 & 2032
- Figure 16: Middle East and Africa Veterinary Services Industry Volume (K Unit), by Country 2024 & 2032
- Figure 17: Middle East and Africa Veterinary Services Industry Revenue Share (%), by Country 2024 & 2032
- Figure 18: Middle East and Africa Veterinary Services Industry Volume Share (%), by Country 2024 & 2032
- Figure 19: South America Veterinary Services Industry Revenue (Million), by Country 2024 & 2032
- Figure 20: South America Veterinary Services Industry Volume (K Unit), by Country 2024 & 2032
- Figure 21: South America Veterinary Services Industry Revenue Share (%), by Country 2024 & 2032
- Figure 22: South America Veterinary Services Industry Volume Share (%), by Country 2024 & 2032
- Figure 23: North America Veterinary Services Industry Revenue (Million), by Animal Type 2024 & 2032
- Figure 24: North America Veterinary Services Industry Volume (K Unit), by Animal Type 2024 & 2032
- Figure 25: North America Veterinary Services Industry Revenue Share (%), by Animal Type 2024 & 2032
- Figure 26: North America Veterinary Services Industry Volume Share (%), by Animal Type 2024 & 2032
- Figure 27: North America Veterinary Services Industry Revenue (Million), by Type of Care 2024 & 2032
- Figure 28: North America Veterinary Services Industry Volume (K Unit), by Type of Care 2024 & 2032
- Figure 29: North America Veterinary Services Industry Revenue Share (%), by Type of Care 2024 & 2032
- Figure 30: North America Veterinary Services Industry Volume Share (%), by Type of Care 2024 & 2032
- Figure 31: North America Veterinary Services Industry Revenue (Million), by Country 2024 & 2032
- Figure 32: North America Veterinary Services Industry Volume (K Unit), by Country 2024 & 2032
- Figure 33: North America Veterinary Services Industry Revenue Share (%), by Country 2024 & 2032
- Figure 34: North America Veterinary Services Industry Volume Share (%), by Country 2024 & 2032
- Figure 35: Europe Veterinary Services Industry Revenue (Million), by Animal Type 2024 & 2032
- Figure 36: Europe Veterinary Services Industry Volume (K Unit), by Animal Type 2024 & 2032
- Figure 37: Europe Veterinary Services Industry Revenue Share (%), by Animal Type 2024 & 2032
- Figure 38: Europe Veterinary Services Industry Volume Share (%), by Animal Type 2024 & 2032
- Figure 39: Europe Veterinary Services Industry Revenue (Million), by Type of Care 2024 & 2032
- Figure 40: Europe Veterinary Services Industry Volume (K Unit), by Type of Care 2024 & 2032
- Figure 41: Europe Veterinary Services Industry Revenue Share (%), by Type of Care 2024 & 2032
- Figure 42: Europe Veterinary Services Industry Volume Share (%), by Type of Care 2024 & 2032
- Figure 43: Europe Veterinary Services Industry Revenue (Million), by Country 2024 & 2032
- Figure 44: Europe Veterinary Services Industry Volume (K Unit), by Country 2024 & 2032
- Figure 45: Europe Veterinary Services Industry Revenue Share (%), by Country 2024 & 2032
- Figure 46: Europe Veterinary Services Industry Volume Share (%), by Country 2024 & 2032
- Figure 47: Asia Pacific Veterinary Services Industry Revenue (Million), by Animal Type 2024 & 2032
- Figure 48: Asia Pacific Veterinary Services Industry Volume (K Unit), by Animal Type 2024 & 2032
- Figure 49: Asia Pacific Veterinary Services Industry Revenue Share (%), by Animal Type 2024 & 2032
- Figure 50: Asia Pacific Veterinary Services Industry Volume Share (%), by Animal Type 2024 & 2032
- Figure 51: Asia Pacific Veterinary Services Industry Revenue (Million), by Type of Care 2024 & 2032
- Figure 52: Asia Pacific Veterinary Services Industry Volume (K Unit), by Type of Care 2024 & 2032
- Figure 53: Asia Pacific Veterinary Services Industry Revenue Share (%), by Type of Care 2024 & 2032
- Figure 54: Asia Pacific Veterinary Services Industry Volume Share (%), by Type of Care 2024 & 2032
- Figure 55: Asia Pacific Veterinary Services Industry Revenue (Million), by Country 2024 & 2032
- Figure 56: Asia Pacific Veterinary Services Industry Volume (K Unit), by Country 2024 & 2032
- Figure 57: Asia Pacific Veterinary Services Industry Revenue Share (%), by Country 2024 & 2032
- Figure 58: Asia Pacific Veterinary Services Industry Volume Share (%), by Country 2024 & 2032
- Figure 59: Middle East and Africa Veterinary Services Industry Revenue (Million), by Animal Type 2024 & 2032
- Figure 60: Middle East and Africa Veterinary Services Industry Volume (K Unit), by Animal Type 2024 & 2032
- Figure 61: Middle East and Africa Veterinary Services Industry Revenue Share (%), by Animal Type 2024 & 2032
- Figure 62: Middle East and Africa Veterinary Services Industry Volume Share (%), by Animal Type 2024 & 2032
- Figure 63: Middle East and Africa Veterinary Services Industry Revenue (Million), by Type of Care 2024 & 2032
- Figure 64: Middle East and Africa Veterinary Services Industry Volume (K Unit), by Type of Care 2024 & 2032
- Figure 65: Middle East and Africa Veterinary Services Industry Revenue Share (%), by Type of Care 2024 & 2032
- Figure 66: Middle East and Africa Veterinary Services Industry Volume Share (%), by Type of Care 2024 & 2032
- Figure 67: Middle East and Africa Veterinary Services Industry Revenue (Million), by Country 2024 & 2032
- Figure 68: Middle East and Africa Veterinary Services Industry Volume (K Unit), by Country 2024 & 2032
- Figure 69: Middle East and Africa Veterinary Services Industry Revenue Share (%), by Country 2024 & 2032
- Figure 70: Middle East and Africa Veterinary Services Industry Volume Share (%), by Country 2024 & 2032
- Figure 71: South America Veterinary Services Industry Revenue (Million), by Animal Type 2024 & 2032
- Figure 72: South America Veterinary Services Industry Volume (K Unit), by Animal Type 2024 & 2032
- Figure 73: South America Veterinary Services Industry Revenue Share (%), by Animal Type 2024 & 2032
- Figure 74: South America Veterinary Services Industry Volume Share (%), by Animal Type 2024 & 2032
- Figure 75: South America Veterinary Services Industry Revenue (Million), by Type of Care 2024 & 2032
- Figure 76: South America Veterinary Services Industry Volume (K Unit), by Type of Care 2024 & 2032
- Figure 77: South America Veterinary Services Industry Revenue Share (%), by Type of Care 2024 & 2032
- Figure 78: South America Veterinary Services Industry Volume Share (%), by Type of Care 2024 & 2032
- Figure 79: South America Veterinary Services Industry Revenue (Million), by Country 2024 & 2032
- Figure 80: South America Veterinary Services Industry Volume (K Unit), by Country 2024 & 2032
- Figure 81: South America Veterinary Services Industry Revenue Share (%), by Country 2024 & 2032
- Figure 82: South America Veterinary Services Industry Volume Share (%), by Country 2024 & 2032
List of Tables
- Table 1: Global Veterinary Services Industry Revenue Million Forecast, by Region 2019 & 2032
- Table 2: Global Veterinary Services Industry Volume K Unit Forecast, by Region 2019 & 2032
- Table 3: Global Veterinary Services Industry Revenue Million Forecast, by Animal Type 2019 & 2032
- Table 4: Global Veterinary Services Industry Volume K Unit Forecast, by Animal Type 2019 & 2032
- Table 5: Global Veterinary Services Industry Revenue Million Forecast, by Type of Care 2019 & 2032
- Table 6: Global Veterinary Services Industry Volume K Unit Forecast, by Type of Care 2019 & 2032
- Table 7: Global Veterinary Services Industry Revenue Million Forecast, by Region 2019 & 2032
- Table 8: Global Veterinary Services Industry Volume K Unit Forecast, by Region 2019 & 2032
- Table 9: Global Veterinary Services Industry Revenue Million Forecast, by Country 2019 & 2032
- Table 10: Global Veterinary Services Industry Volume K Unit Forecast, by Country 2019 & 2032
- Table 11: United States Veterinary Services Industry Revenue (Million) Forecast, by Application 2019 & 2032
- Table 12: United States Veterinary Services Industry Volume (K Unit) Forecast, by Application 2019 & 2032
- Table 13: Canada Veterinary Services Industry Revenue (Million) Forecast, by Application 2019 & 2032
- Table 14: Canada Veterinary Services Industry Volume (K Unit) Forecast, by Application 2019 & 2032
- Table 15: Mexico Veterinary Services Industry Revenue (Million) Forecast, by Application 2019 & 2032
- Table 16: Mexico Veterinary Services Industry Volume (K Unit) Forecast, by Application 2019 & 2032
- Table 17: Global Veterinary Services Industry Revenue Million Forecast, by Country 2019 & 2032
- Table 18: Global Veterinary Services Industry Volume K Unit Forecast, by Country 2019 & 2032
- Table 19: Germany Veterinary Services Industry Revenue (Million) Forecast, by Application 2019 & 2032
- Table 20: Germany Veterinary Services Industry Volume (K Unit) Forecast, by Application 2019 & 2032
- Table 21: United Kingdom Veterinary Services Industry Revenue (Million) Forecast, by Application 2019 & 2032
- Table 22: United Kingdom Veterinary Services Industry Volume (K Unit) Forecast, by Application 2019 & 2032
- Table 23: France Veterinary Services Industry Revenue (Million) Forecast, by Application 2019 & 2032
- Table 24: France Veterinary Services Industry Volume (K Unit) Forecast, by Application 2019 & 2032
- Table 25: Italy Veterinary Services Industry Revenue (Million) Forecast, by Application 2019 & 2032
- Table 26: Italy Veterinary Services Industry Volume (K Unit) Forecast, by Application 2019 & 2032
- Table 27: Spain Veterinary Services Industry Revenue (Million) Forecast, by Application 2019 & 2032
- Table 28: Spain Veterinary Services Industry Volume (K Unit) Forecast, by Application 2019 & 2032
- Table 29: Rest of Europe Veterinary Services Industry Revenue (Million) Forecast, by Application 2019 & 2032
- Table 30: Rest of Europe Veterinary Services Industry Volume (K Unit) Forecast, by Application 2019 & 2032
- Table 31: Global Veterinary Services Industry Revenue Million Forecast, by Country 2019 & 2032
- Table 32: Global Veterinary Services Industry Volume K Unit Forecast, by Country 2019 & 2032
- Table 33: China Veterinary Services Industry Revenue (Million) Forecast, by Application 2019 & 2032
- Table 34: China Veterinary Services Industry Volume (K Unit) Forecast, by Application 2019 & 2032
- Table 35: Japan Veterinary Services Industry Revenue (Million) Forecast, by Application 2019 & 2032
- Table 36: Japan Veterinary Services Industry Volume (K Unit) Forecast, by Application 2019 & 2032
- Table 37: India Veterinary Services Industry Revenue (Million) Forecast, by Application 2019 & 2032
- Table 38: India Veterinary Services Industry Volume (K Unit) Forecast, by Application 2019 & 2032
- Table 39: Australia Veterinary Services Industry Revenue (Million) Forecast, by Application 2019 & 2032
- Table 40: Australia Veterinary Services Industry Volume (K Unit) Forecast, by Application 2019 & 2032
- Table 41: South Korea Veterinary Services Industry Revenue (Million) Forecast, by Application 2019 & 2032
- Table 42: South Korea Veterinary Services Industry Volume (K Unit) Forecast, by Application 2019 & 2032
- Table 43: Rest of Asia Pacific Veterinary Services Industry Revenue (Million) Forecast, by Application 2019 & 2032
- Table 44: Rest of Asia Pacific Veterinary Services Industry Volume (K Unit) Forecast, by Application 2019 & 2032
- Table 45: Global Veterinary Services Industry Revenue Million Forecast, by Country 2019 & 2032
- Table 46: Global Veterinary Services Industry Volume K Unit Forecast, by Country 2019 & 2032
- Table 47: GCC Veterinary Services Industry Revenue (Million) Forecast, by Application 2019 & 2032
- Table 48: GCC Veterinary Services Industry Volume (K Unit) Forecast, by Application 2019 & 2032
- Table 49: South Africa Veterinary Services Industry Revenue (Million) Forecast, by Application 2019 & 2032
- Table 50: South Africa Veterinary Services Industry Volume (K Unit) Forecast, by Application 2019 & 2032
- Table 51: Rest of Middle East and Africa Veterinary Services Industry Revenue (Million) Forecast, by Application 2019 & 2032
- Table 52: Rest of Middle East and Africa Veterinary Services Industry Volume (K Unit) Forecast, by Application 2019 & 2032
- Table 53: Global Veterinary Services Industry Revenue Million Forecast, by Country 2019 & 2032
- Table 54: Global Veterinary Services Industry Volume K Unit Forecast, by Country 2019 & 2032
- Table 55: Brazil Veterinary Services Industry Revenue (Million) Forecast, by Application 2019 & 2032
- Table 56: Brazil Veterinary Services Industry Volume (K Unit) Forecast, by Application 2019 & 2032
- Table 57: Argentina Veterinary Services Industry Revenue (Million) Forecast, by Application 2019 & 2032
- Table 58: Argentina Veterinary Services Industry Volume (K Unit) Forecast, by Application 2019 & 2032
- Table 59: Rest of South America Veterinary Services Industry Revenue (Million) Forecast, by Application 2019 & 2032
- Table 60: Rest of South America Veterinary Services Industry Volume (K Unit) Forecast, by Application 2019 & 2032
- Table 61: Global Veterinary Services Industry Revenue Million Forecast, by Animal Type 2019 & 2032
- Table 62: Global Veterinary Services Industry Volume K Unit Forecast, by Animal Type 2019 & 2032
- Table 63: Global Veterinary Services Industry Revenue Million Forecast, by Type of Care 2019 & 2032
- Table 64: Global Veterinary Services Industry Volume K Unit Forecast, by Type of Care 2019 & 2032
- Table 65: Global Veterinary Services Industry Revenue Million Forecast, by Country 2019 & 2032
- Table 66: Global Veterinary Services Industry Volume K Unit Forecast, by Country 2019 & 2032
- Table 67: United States Veterinary Services Industry Revenue (Million) Forecast, by Application 2019 & 2032
- Table 68: United States Veterinary Services Industry Volume (K Unit) Forecast, by Application 2019 & 2032
- Table 69: Canada Veterinary Services Industry Revenue (Million) Forecast, by Application 2019 & 2032
- Table 70: Canada Veterinary Services Industry Volume (K Unit) Forecast, by Application 2019 & 2032
- Table 71: Mexico Veterinary Services Industry Revenue (Million) Forecast, by Application 2019 & 2032
- Table 72: Mexico Veterinary Services Industry Volume (K Unit) Forecast, by Application 2019 & 2032
- Table 73: Global Veterinary Services Industry Revenue Million Forecast, by Animal Type 2019 & 2032
- Table 74: Global Veterinary Services Industry Volume K Unit Forecast, by Animal Type 2019 & 2032
- Table 75: Global Veterinary Services Industry Revenue Million Forecast, by Type of Care 2019 & 2032
- Table 76: Global Veterinary Services Industry Volume K Unit Forecast, by Type of Care 2019 & 2032
- Table 77: Global Veterinary Services Industry Revenue Million Forecast, by Country 2019 & 2032
- Table 78: Global Veterinary Services Industry Volume K Unit Forecast, by Country 2019 & 2032
- Table 79: Germany Veterinary Services Industry Revenue (Million) Forecast, by Application 2019 & 2032
- Table 80: Germany Veterinary Services Industry Volume (K Unit) Forecast, by Application 2019 & 2032
- Table 81: United Kingdom Veterinary Services Industry Revenue (Million) Forecast, by Application 2019 & 2032
- Table 82: United Kingdom Veterinary Services Industry Volume (K Unit) Forecast, by Application 2019 & 2032
- Table 83: France Veterinary Services Industry Revenue (Million) Forecast, by Application 2019 & 2032
- Table 84: France Veterinary Services Industry Volume (K Unit) Forecast, by Application 2019 & 2032
- Table 85: Italy Veterinary Services Industry Revenue (Million) Forecast, by Application 2019 & 2032
- Table 86: Italy Veterinary Services Industry Volume (K Unit) Forecast, by Application 2019 & 2032
- Table 87: Spain Veterinary Services Industry Revenue (Million) Forecast, by Application 2019 & 2032
- Table 88: Spain Veterinary Services Industry Volume (K Unit) Forecast, by Application 2019 & 2032
- Table 89: Rest of Europe Veterinary Services Industry Revenue (Million) Forecast, by Application 2019 & 2032
- Table 90: Rest of Europe Veterinary Services Industry Volume (K Unit) Forecast, by Application 2019 & 2032
- Table 91: Global Veterinary Services Industry Revenue Million Forecast, by Animal Type 2019 & 2032
- Table 92: Global Veterinary Services Industry Volume K Unit Forecast, by Animal Type 2019 & 2032
- Table 93: Global Veterinary Services Industry Revenue Million Forecast, by Type of Care 2019 & 2032
- Table 94: Global Veterinary Services Industry Volume K Unit Forecast, by Type of Care 2019 & 2032
- Table 95: Global Veterinary Services Industry Revenue Million Forecast, by Country 2019 & 2032
- Table 96: Global Veterinary Services Industry Volume K Unit Forecast, by Country 2019 & 2032
- Table 97: China Veterinary Services Industry Revenue (Million) Forecast, by Application 2019 & 2032
- Table 98: China Veterinary Services Industry Volume (K Unit) Forecast, by Application 2019 & 2032
- Table 99: Japan Veterinary Services Industry Revenue (Million) Forecast, by Application 2019 & 2032
- Table 100: Japan Veterinary Services Industry Volume (K Unit) Forecast, by Application 2019 & 2032
- Table 101: India Veterinary Services Industry Revenue (Million) Forecast, by Application 2019 & 2032
- Table 102: India Veterinary Services Industry Volume (K Unit) Forecast, by Application 2019 & 2032
- Table 103: Australia Veterinary Services Industry Revenue (Million) Forecast, by Application 2019 & 2032
- Table 104: Australia Veterinary Services Industry Volume (K Unit) Forecast, by Application 2019 & 2032
- Table 105: South Korea Veterinary Services Industry Revenue (Million) Forecast, by Application 2019 & 2032
- Table 106: South Korea Veterinary Services Industry Volume (K Unit) Forecast, by Application 2019 & 2032
- Table 107: Rest of Asia Pacific Veterinary Services Industry Revenue (Million) Forecast, by Application 2019 & 2032
- Table 108: Rest of Asia Pacific Veterinary Services Industry Volume (K Unit) Forecast, by Application 2019 & 2032
- Table 109: Global Veterinary Services Industry Revenue Million Forecast, by Animal Type 2019 & 2032
- Table 110: Global Veterinary Services Industry Volume K Unit Forecast, by Animal Type 2019 & 2032
- Table 111: Global Veterinary Services Industry Revenue Million Forecast, by Type of Care 2019 & 2032
- Table 112: Global Veterinary Services Industry Volume K Unit Forecast, by Type of Care 2019 & 2032
- Table 113: Global Veterinary Services Industry Revenue Million Forecast, by Country 2019 & 2032
- Table 114: Global Veterinary Services Industry Volume K Unit Forecast, by Country 2019 & 2032
- Table 115: GCC Veterinary Services Industry Revenue (Million) Forecast, by Application 2019 & 2032
- Table 116: GCC Veterinary Services Industry Volume (K Unit) Forecast, by Application 2019 & 2032
- Table 117: South Africa Veterinary Services Industry Revenue (Million) Forecast, by Application 2019 & 2032
- Table 118: South Africa Veterinary Services Industry Volume (K Unit) Forecast, by Application 2019 & 2032
- Table 119: Rest of Middle East and Africa Veterinary Services Industry Revenue (Million) Forecast, by Application 2019 & 2032
- Table 120: Rest of Middle East and Africa Veterinary Services Industry Volume (K Unit) Forecast, by Application 2019 & 2032
- Table 121: Global Veterinary Services Industry Revenue Million Forecast, by Animal Type 2019 & 2032
- Table 122: Global Veterinary Services Industry Volume K Unit Forecast, by Animal Type 2019 & 2032
- Table 123: Global Veterinary Services Industry Revenue Million Forecast, by Type of Care 2019 & 2032
- Table 124: Global Veterinary Services Industry Volume K Unit Forecast, by Type of Care 2019 & 2032
- Table 125: Global Veterinary Services Industry Revenue Million Forecast, by Country 2019 & 2032
- Table 126: Global Veterinary Services Industry Volume K Unit Forecast, by Country 2019 & 2032
- Table 127: Brazil Veterinary Services Industry Revenue (Million) Forecast, by Application 2019 & 2032
- Table 128: Brazil Veterinary Services Industry Volume (K Unit) Forecast, by Application 2019 & 2032
- Table 129: Argentina Veterinary Services Industry Revenue (Million) Forecast, by Application 2019 & 2032
- Table 130: Argentina Veterinary Services Industry Volume (K Unit) Forecast, by Application 2019 & 2032
- Table 131: Rest of South America Veterinary Services Industry Revenue (Million) Forecast, by Application 2019 & 2032
- Table 132: Rest of South America Veterinary Services Industry Volume (K Unit) Forecast, by Application 2019 & 2032
Frequently Asked Questions
1. What is the projected Compound Annual Growth Rate (CAGR) of the Veterinary Services Industry?
The projected CAGR is approximately 5.59%.
2. Which companies are prominent players in the Veterinary Services Industry?
Key companies in the market include Zoetis Services LLC, Elanco, Boehringer Ingelheim GmbH, IDEXX Laboratories Inc, Indian Immunologicals Ltd, Vetoquinol S A, Hester Bioscience, Heska Corp, Ceva Sant Animale, Phibro Animal Health, Virbac, Merck Animal Health.
3. What are the main segments of the Veterinary Services Industry?
The market segments include Animal Type, Type of Care.
4. Can you provide details about the market size?
The market size is estimated to be USD 88.22 Million as of 2022.
5. What are some drivers contributing to market growth?
Rising Chronic Diseases and Awareness Regarding Veterinary Care; Increasing Initiatives by Governments and Animal Welfare Associations in Different Countries.
6. What are the notable trends driving market growth?
Companion Animal Segment is Expected to Hold Significant Market Share in the Market Over the Forecast Period.
7. Are there any restraints impacting market growth?
Increasing Costs of Animal Care Product and Veterinary Services.
8. Can you provide examples of recent developments in the market?
April 2022: Animalcare launched Plaqtiv+, a range of dental care products for cats and dogs designed to reduce calculus formation.
9. What pricing options are available for accessing the report?
Pricing options include single-user, multi-user, and enterprise licenses priced at USD 4750, USD 5250, and USD 8750 respectively.
10. Is the market size provided in terms of value or volume?
The market size is provided in terms of value, measured in Million and volume, measured in K Unit.
11. Are there any specific market keywords associated with the report?
Yes, the market keyword associated with the report is "Veterinary Services Industry," which aids in identifying and referencing the specific market segment covered.
12. How do I determine which pricing option suits my needs best?
The pricing options vary based on user requirements and access needs. Individual users may opt for single-user licenses, while businesses requiring broader access may choose multi-user or enterprise licenses for cost-effective access to the report.
13. Are there any additional resources or data provided in the Veterinary Services Industry report?
While the report offers comprehensive insights, it's advisable to review the specific contents or supplementary materials provided to ascertain if additional resources or data are available.
14. How can I stay updated on further developments or reports in the Veterinary Services Industry?
To stay informed about further developments, trends, and reports in the Veterinary Services Industry, consider subscribing to industry newsletters, following relevant companies and organizations, or regularly checking reputable industry news sources and publications.
Methodology
Step 1 - Identification of Relevant Samples Size from Population Database


Step 2 - Approaches for Defining Global Market Size (Value, Volume* & Price*)

Note*: In applicable scenarios
Step 3 - Data Sources
Primary Research
- Web Analytics
- Survey Reports
- Research Institute
- Latest Research Reports
- Opinion Leaders
Secondary Research
- Annual Reports
- White Paper
- Latest Press Release
- Industry Association
- Paid Database
- Investor Presentations

Step 4 - Data Triangulation
Involves using different sources of information in order to increase the validity of a study
These sources are likely to be stakeholders in a program - participants, other researchers, program staff, other community members, and so on.
Then we put all data in single framework & apply various statistical tools to find out the dynamic on the market.
During the analysis stage, feedback from the stakeholder groups would be compared to determine areas of agreement as well as areas of divergence
