

Key Insights
The High Content Screening (HCS) market is projected for significant growth, anticipating a market size of 1.52 billion by 2025, with a CAGR of 7.5. This expansion is driven by the accelerating pace of drug discovery and development, necessitating efficient cellular analysis tools to identify drug candidates and understand biological mechanisms. Pharmaceutical, biotechnology, academic, and government research institutions are key contributors, investing in HCS platforms for deeper disease insights and therapeutic response analysis. The integration of advanced software, imaging systems, and analytical tools enhances experimental complexity, throughput, and sensitivity, surpassing traditional screening limitations with a detailed, quantitative approach.
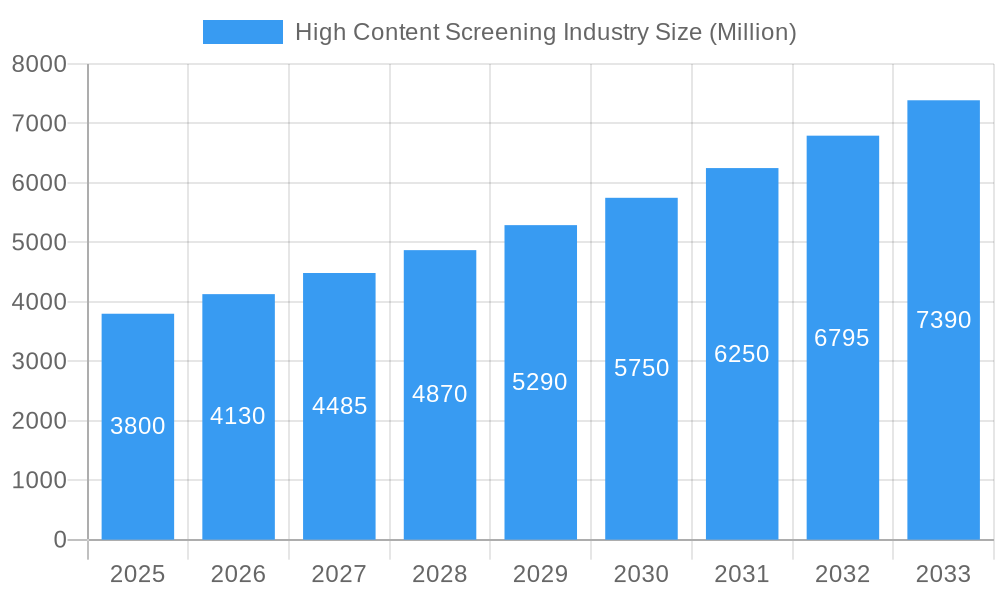
High Content Screening Industry Market Size (In Billion)
Key growth drivers include the demand for personalized medicine, the rising incidence of chronic diseases, and continuous innovation in HCS instrumentation and methodologies. The market encompasses Instruments, Consumables, Software, and Services, vital for the HCS ecosystem. Applications include Primary and Secondary Screening, Target Identification and Validation, Toxicity Studies, and Compound Profiling. North America and Europe lead market share due to robust research infrastructure and R&D investment. The Asia Pacific region is expected to experience the fastest growth, supported by government initiatives and the adoption of HCS by contract research organizations (CROs). High initial system costs and the need for skilled personnel are being mitigated by technological advancements and service-based models.
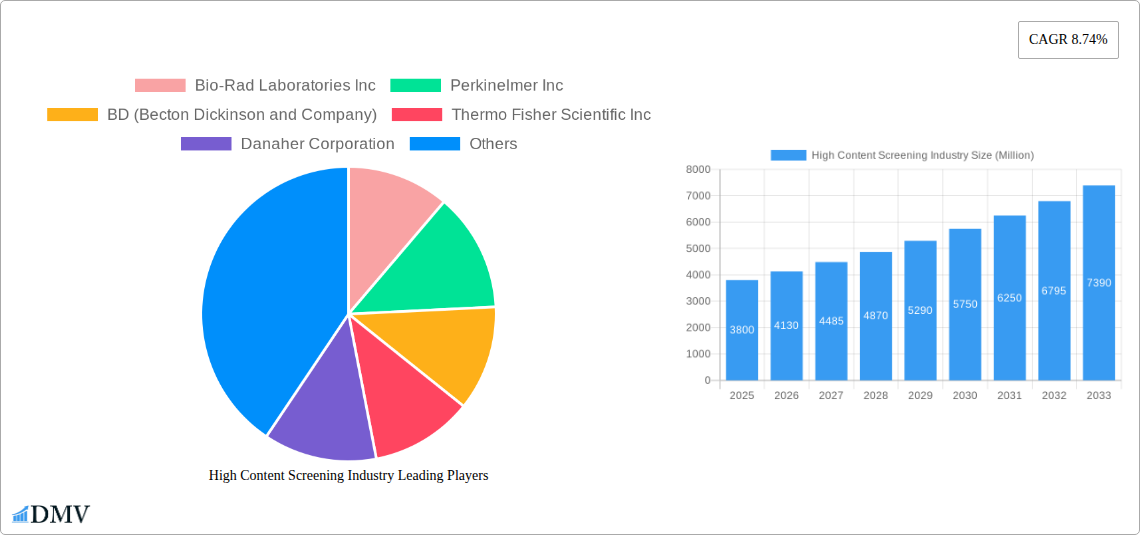
High Content Screening Industry Company Market Share
High Content Screening Industry Market Composition & Trends
The global High Content Screening (HCS) industry is characterized by a dynamic market composition driven by continuous innovation and strategic collaborations. The market concentration is moderately fragmented, with key players like Thermo Fisher Scientific Inc., Danaher Corporation, and Merck KGaA holding significant market shares, estimated at approximately 15% each in the base year 2025. Bio-Rad Laboratories Inc. and PerkinElmer Inc. follow closely, with individual shares hovering around 10%. These leading companies are actively investing in research and development, fueling innovation catalysts such as advanced imaging technologies and novel assay development. The regulatory landscape, particularly in the pharmaceutical and biotechnology sectors, plays a crucial role, with stringent guidelines influencing product development and market entry. Substitute products, while present in certain niche applications, are largely unable to replicate the comprehensive, multi-parameter analysis capabilities offered by HCS. End-user profiles are dominated by pharmaceutical and biotechnology companies, accounting for an estimated 65% of market demand, followed by academic and government institutions (25%) and contract research organizations (10%). Mergers and acquisitions (M&A) activities are a significant trend, with an estimated total M&A deal value of $500 Million in the historical period 2019-2024, aimed at expanding product portfolios and market reach. The market is projected to witness steady growth throughout the forecast period, driven by increasing drug discovery R&D spending and the need for efficient screening methodologies.
High Content Screening Industry Industry Evolution
The High Content Screening (HCS) industry has undergone a significant evolution, transforming from a niche technology into an indispensable tool across drug discovery and life sciences research. Historically, the market has witnessed a consistent upward trajectory, with a Compound Annual Growth Rate (CAGR) of approximately 8.5% during the historical period (2019-2024), reaching a market size of $6.5 Billion in 2024. This robust growth is attributed to the increasing demand for personalized medicine and targeted therapies, which necessitates sophisticated screening platforms capable of analyzing cellular responses to various compounds and genetic perturbations at high throughput. Technological advancements have been the primary engine of this evolution. Early HCS systems were limited in their resolution and throughput. However, continuous innovation has led to the development of advanced imaging systems with higher sensitivity and speed, coupled with sophisticated image analysis software utilizing artificial intelligence (AI) and machine learning (ML) algorithms. These advancements enable researchers to extract more detailed and relevant data from complex biological samples, leading to quicker and more accurate insights. For instance, the adoption of single-cell analysis techniques within HCS has surged by an estimated 30% in the last five years, allowing for a deeper understanding of cellular heterogeneity and drug efficacy at the individual cell level. Shifting consumer demands, primarily from the pharmaceutical and biotechnology sectors, have also shaped the industry. There is a growing emphasis on phenotypic screening over traditional target-based screening, as it allows for the discovery of novel drug targets and mechanisms of action. Furthermore, the increasing complexity of biological targets, such as protein-protein interactions and epigenetic modifications, requires HCS platforms that can simultaneously measure multiple parameters. The integration of automation and robotics into HCS workflows has further enhanced efficiency, reducing hands-on time and minimizing human error, thereby accelerating the drug discovery pipeline. The market size is projected to reach approximately $12.8 Billion by 2033, with the forecast period (2025-2033) expected to see a continued CAGR of 8.0% to 9.0%. The base year 2025 estimates the market at $7.0 Billion.
Leading Regions, Countries, or Segments in High Content Screening Industry
The High Content Screening (HCS) industry's dominance is notably concentrated within North America, particularly the United States, which consistently leads in terms of market share, accounting for an estimated 40% of the global market in 2025. This regional leadership is driven by a confluence of factors, including a robust pharmaceutical and biotechnology sector, substantial government funding for life sciences research, and the presence of leading research institutions and contract research organizations (CROs). The United States’ proactive approach to adopting cutting-edge technologies and its strong ecosystem for innovation further solidify its position.
- Key Drivers for North American Dominance:
- High R&D Expenditure: Pharmaceutical and biotechnology companies in North America invest heavily in drug discovery and development, creating a sustained demand for advanced screening solutions.
- Government Funding: Significant funding from agencies like the National Institutes of Health (NIH) supports academic research and technology development in the life sciences.
- Presence of Key Players: Major HCS instrument manufacturers and service providers are headquartered or have a strong presence in North America, fostering innovation and market growth.
- Technological Adoption: The region demonstrates a high propensity to adopt new technologies, including AI-powered image analysis and multi-omics integration within HCS platforms.
Product Segment Dominance: Within the HCS product landscape, Instruments emerge as the largest segment, commanding an estimated 50% market share in 2025. This is further broken down into:
- Cell Imaging and Analysis Systems: This sub-segment, valued at approximately $2.8 Billion in 2025, is the primary driver of instrument revenue, offering unparalleled capabilities in visualizing and quantifying cellular phenotypes.
- Flow Cytometers: While a significant segment in its own right, particularly with recent advancements in clinical applications, flow cytometers contribute approximately $0.7 Billion to the instrument market.
Application Segment Dominance: The Primary and Secondary Screening application segment is the most prominent, representing an estimated 35% of the HCS market. This is due to its direct relevance in the early stages of drug discovery, where identifying promising drug candidates is paramount.
End User Segment Dominance: Pharmaceutical and Biotechnology Companies constitute the largest end-user segment, accounting for a substantial 65% of the market. Their critical need for high-throughput, data-rich screening solutions to accelerate drug development pipelines fuels their significant market contribution.
The dominance of these segments and regions is reinforced by continuous investment in advanced technologies and a strong demand for efficient and accurate biological analysis. The market is expected to maintain this regional and segmental distribution throughout the forecast period (2025-2033), with continued growth driven by innovation and application expansion.
High Content Screening Industry Product Innovations
Product innovation in the High Content Screening (HCS) industry centers on enhancing sensitivity, throughput, and data analysis capabilities. Leading companies are developing next-generation cell imaging and analysis systems that offer higher resolution and faster scanning speeds, enabling the analysis of more complex cellular models and larger compound libraries. The integration of AI and machine learning algorithms into image analysis software is a significant advancement, allowing for automated feature extraction, sophisticated phenotype classification, and the identification of subtle biological responses previously undetectable. Furthermore, advancements in reagent and assay kit development, particularly in multiplexing capabilities, allow for the simultaneous measurement of multiple biomarkers and cellular events within a single assay, providing richer datasets for compound profiling and toxicity studies. The performance metrics are continuously improving, with current systems capable of analyzing millions of cells per day, offering detailed quantitative data on hundreds of cellular parameters.
Propelling Factors for High Content Screening Industry Growth
Several key factors are propelling the growth of the High Content Screening (HCS) industry. The relentless pursuit of novel therapeutics for unmet medical needs, particularly in oncology, autoimmune diseases, and neurodegenerative disorders, is a primary driver. The increasing complexity of drug targets, such as protein-protein interactions and epigenetic modifications, necessitates advanced screening platforms like HCS that can provide multi-parameter, phenotypic insights. Technological advancements, including the miniaturization of microplates, enhanced imaging resolution, and sophisticated AI-driven image analysis, are making HCS more accessible and powerful. Furthermore, the growing emphasis on personalized medicine, which requires the screening of drugs against patient-derived cells, fuels the demand for flexible and sensitive HCS solutions. Government initiatives and increased funding for life sciences research and development globally also contribute significantly to market expansion.
Obstacles in the High Content Screening Industry Market
Despite its robust growth, the High Content Screening (HCS) industry faces several obstacles. The substantial initial capital investment required for advanced HCS instrumentation can be a barrier for smaller research institutions and emerging biotechnology companies. The complexity of operating and analyzing data from HCS systems necessitates specialized expertise, leading to a shortage of skilled personnel. Regulatory hurdles, particularly for assays intended for clinical diagnostics, can slow down the adoption and validation of new HCS applications. Furthermore, the sheer volume of data generated by HCS experiments poses significant data management and storage challenges, requiring robust bioinformatics infrastructure. Supply chain disruptions for critical reagents and consumables, as witnessed in recent global events, can also impact operational continuity and lead to increased costs.
Future Opportunities in High Content Screening Industry
The High Content Screening (HCS) industry is ripe with future opportunities. The expansion of HCS into new therapeutic areas, such as infectious diseases and rare genetic disorders, presents significant untapped potential. The increasing adoption of AI and machine learning in drug discovery is poised to further revolutionize HCS data analysis, enabling more predictive and insightful screening outcomes. The growing trend towards organ-on-a-chip and 3D cell culture models offers a more physiologically relevant platform for HCS, promising to improve drug translation from preclinical to clinical stages. The development of more affordable and user-friendly HCS systems could broaden market access to academic and smaller research labs. Furthermore, the integration of HCS with other high-throughput technologies, such as genomics and proteomics, opens avenues for multi-omics drug discovery and biomarker identification.
Major Players in the High Content Screening Industry Ecosystem
- Bio-Rad Laboratories Inc.
- Perkinelmer Inc.
- BD (Becton Dickinson and Company)
- Thermo Fisher Scientific Inc.
- Danaher Corporation
- Merck KGaA
- Yokogawa Electric Corporation
- Agilent Technologies
Key Developments in High Content Screening Industry Industry
- September 2022: BD (Becton, Dickinson and Company) launched BD Research Cloud, a cloud-based software solution designed to streamline the flow cytometry workflow. Its goal is to simplify the workflow for scientists working in a variety of fields, such as immunology, virology, oncology, and infectious disease monitoring, to enable higher-quality experiments with quicker time to insight. This development significantly enhances data analysis and accessibility in cytometry-based screening.
- April 2022: Sysmex Europe launched CE-IVD-marked Flow Cytometer XF-1600, offering clinical flow cytometry laboratories robust and reliable immunophenotyping. This marks a crucial step towards bringing advanced flow cytometry applications, often integrated with HCS principles, into clinical settings, thereby expanding the reach and impact of cell analysis technologies.
Strategic High Content Screening Industry Market Forecast
The strategic forecast for the High Content Screening (HCS) industry indicates sustained and robust growth, driven by the increasing demand for more effective and targeted drug discovery solutions. The forecast period (2025-2033) is projected to witness a CAGR of approximately 8.5%, with the market size expected to expand from an estimated $7.0 Billion in 2025 to $12.8 Billion by 2033. This expansion will be fueled by continued innovation in imaging technology, AI-driven data analysis, and the broadening application of HCS in areas such as phenotypic screening, toxicity testing, and personalized medicine. Strategic investments in R&D by major players and increasing adoption by pharmaceutical, biotechnology, and academic institutions will further solidify market growth. The development of more accessible and integrated HCS solutions will also be a key factor in unlocking new market potential and driving strategic expansion.
High Content Screening Industry Segmentation
-
1. Product
-
1.1. Instruments
- 1.1.1. Cell Imaging and Analysis Systems
- 1.1.2. Flow Cytometers
-
1.2. Consumables
- 1.2.1. Reagents and Assay Kits
- 1.2.2. Microplates
- 1.2.3. Other Consumables
- 1.3. Software
- 1.4. Services
-
1.1. Instruments
-
2. Application
- 2.1. Primary and Secondary Screening
- 2.2. Target Identification and Validation
- 2.3. Toxicity Studies
- 2.4. Compound Profiling
- 2.5. Other Applications
-
3. End User
- 3.1. Pharmaceutical and Biotechnology Companies
- 3.2. Academic and Government Institutions
- 3.3. Contract Research Organization
High Content Screening Industry Segmentation By Geography
-
1. North America
- 1.1. United States
- 1.2. Canada
- 1.3. Mexico
-
2. Europe
- 2.1. Germany
- 2.2. United Kingdom
- 2.3. France
- 2.4. Italy
- 2.5. Spain
- 2.6. Rest of Europe
-
3. Asia Pacific
- 3.1. China
- 3.2. Japan
- 3.3. India
- 3.4. Australia
- 3.5. South Korea
- 3.6. Rest of Asia Pacific
-
4. Middle East and Africa
- 4.1. GCC
- 4.2. South Africa
- 4.3. Rest of Middle East and Africa
-
5. South America
- 5.1. Brazil
- 5.2. Argentina
- 5.3. Rest of South America
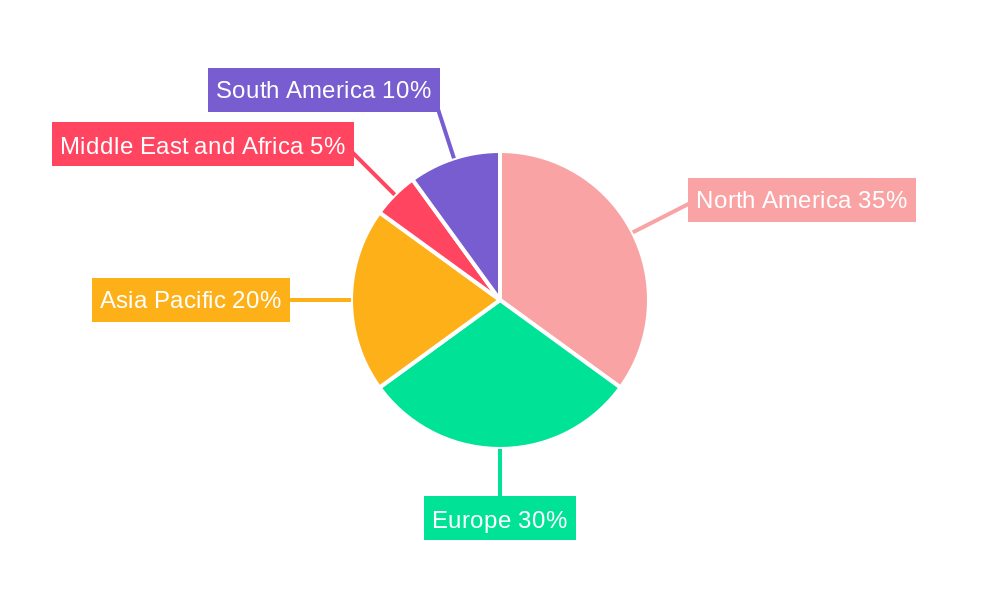
High Content Screening Industry Regional Market Share
Geographic Coverage of High Content Screening Industry
High Content Screening Industry REPORT HIGHLIGHTS
| Aspects | Details |
|---|---|
| Study Period | 2020-2034 |
| Base Year | 2025 |
| Estimated Year | 2026 |
| Forecast Period | 2026-2034 |
| Historical Period | 2020-2025 |
| Growth Rate | CAGR of 7.5% from 2020-2034 |
| Segmentation |
|
Table of Contents
- 1. Introduction
- 1.1. Research Scope
- 1.2. Market Segmentation
- 1.3. Research Objective
- 1.4. Definitions and Assumptions
- 2. Executive Summary
- 2.1. Market Snapshot
- 3. Market Dynamics
- 3.1. Market Drivers
- 3.2. Market Restrains
- 3.3. Market Trends
- 3.4. Market Opportunities
- 4. Market Factor Analysis
- 4.1. Porters Five Forces
- 4.1.1. Bargaining Power of Suppliers
- 4.1.2. Bargaining Power of Buyers
- 4.1.3. Threat of New Entrants
- 4.1.4. Threat of Substitutes
- 4.1.5. Competitive Rivalry
- 4.2. PESTEL analysis
- 4.3. BCG Analysis
- 4.3.1. Stars (High Growth, High Market Share)
- 4.3.2. Cash Cows (Low Growth, High Market Share)
- 4.3.3. Question Mark (High Growth, Low Market Share)
- 4.3.4. Dogs (Low Growth, Low Market Share)
- 4.4. Ansoff Matrix Analysis
- 4.5. Supply Chain Analysis
- 4.6. Regulatory Landscape
- 4.7. Current Market Potential and Opportunity Assessment (TAM–SAM–SOM Framework)
- 4.8. DMV Analyst Note
- 4.1. Porters Five Forces
- 5. Market Analysis, Insights and Forecast 2021-2033
- 5.1. Market Analysis, Insights and Forecast - by Product
- 5.1.1. Instruments
- 5.1.1.1. Cell Imaging and Analysis Systems
- 5.1.1.2. Flow Cytometers
- 5.1.2. Consumables
- 5.1.2.1. Reagents and Assay Kits
- 5.1.2.2. Microplates
- 5.1.2.3. Other Consumables
- 5.1.3. Software
- 5.1.4. Services
- 5.1.1. Instruments
- 5.2. Market Analysis, Insights and Forecast - by Application
- 5.2.1. Primary and Secondary Screening
- 5.2.2. Target Identification and Validation
- 5.2.3. Toxicity Studies
- 5.2.4. Compound Profiling
- 5.2.5. Other Applications
- 5.3. Market Analysis, Insights and Forecast - by End User
- 5.3.1. Pharmaceutical and Biotechnology Companies
- 5.3.2. Academic and Government Institutions
- 5.3.3. Contract Research Organization
- 5.4. Market Analysis, Insights and Forecast - by Region
- 5.4.1. North America
- 5.4.2. Europe
- 5.4.3. Asia Pacific
- 5.4.4. Middle East and Africa
- 5.4.5. South America
- 5.1. Market Analysis, Insights and Forecast - by Product
- 6. Global High Content Screening Industry Analysis, Insights and Forecast, 2021-2033
- 6.1. Market Analysis, Insights and Forecast - by Product
- 6.1.1. Instruments
- 6.1.1.1. Cell Imaging and Analysis Systems
- 6.1.1.2. Flow Cytometers
- 6.1.2. Consumables
- 6.1.2.1. Reagents and Assay Kits
- 6.1.2.2. Microplates
- 6.1.2.3. Other Consumables
- 6.1.3. Software
- 6.1.4. Services
- 6.1.1. Instruments
- 6.2. Market Analysis, Insights and Forecast - by Application
- 6.2.1. Primary and Secondary Screening
- 6.2.2. Target Identification and Validation
- 6.2.3. Toxicity Studies
- 6.2.4. Compound Profiling
- 6.2.5. Other Applications
- 6.3. Market Analysis, Insights and Forecast - by End User
- 6.3.1. Pharmaceutical and Biotechnology Companies
- 6.3.2. Academic and Government Institutions
- 6.3.3. Contract Research Organization
- 6.1. Market Analysis, Insights and Forecast - by Product
- 7. North America High Content Screening Industry Analysis, Insights and Forecast, 2020-2032
- 7.1. Market Analysis, Insights and Forecast - by Product
- 7.1.1. Instruments
- 7.1.1.1. Cell Imaging and Analysis Systems
- 7.1.1.2. Flow Cytometers
- 7.1.2. Consumables
- 7.1.2.1. Reagents and Assay Kits
- 7.1.2.2. Microplates
- 7.1.2.3. Other Consumables
- 7.1.3. Software
- 7.1.4. Services
- 7.1.1. Instruments
- 7.2. Market Analysis, Insights and Forecast - by Application
- 7.2.1. Primary and Secondary Screening
- 7.2.2. Target Identification and Validation
- 7.2.3. Toxicity Studies
- 7.2.4. Compound Profiling
- 7.2.5. Other Applications
- 7.3. Market Analysis, Insights and Forecast - by End User
- 7.3.1. Pharmaceutical and Biotechnology Companies
- 7.3.2. Academic and Government Institutions
- 7.3.3. Contract Research Organization
- 7.1. Market Analysis, Insights and Forecast - by Product
- 8. Europe High Content Screening Industry Analysis, Insights and Forecast, 2020-2032
- 8.1. Market Analysis, Insights and Forecast - by Product
- 8.1.1. Instruments
- 8.1.1.1. Cell Imaging and Analysis Systems
- 8.1.1.2. Flow Cytometers
- 8.1.2. Consumables
- 8.1.2.1. Reagents and Assay Kits
- 8.1.2.2. Microplates
- 8.1.2.3. Other Consumables
- 8.1.3. Software
- 8.1.4. Services
- 8.1.1. Instruments
- 8.2. Market Analysis, Insights and Forecast - by Application
- 8.2.1. Primary and Secondary Screening
- 8.2.2. Target Identification and Validation
- 8.2.3. Toxicity Studies
- 8.2.4. Compound Profiling
- 8.2.5. Other Applications
- 8.3. Market Analysis, Insights and Forecast - by End User
- 8.3.1. Pharmaceutical and Biotechnology Companies
- 8.3.2. Academic and Government Institutions
- 8.3.3. Contract Research Organization
- 8.1. Market Analysis, Insights and Forecast - by Product
- 9. Asia Pacific High Content Screening Industry Analysis, Insights and Forecast, 2020-2032
- 9.1. Market Analysis, Insights and Forecast - by Product
- 9.1.1. Instruments
- 9.1.1.1. Cell Imaging and Analysis Systems
- 9.1.1.2. Flow Cytometers
- 9.1.2. Consumables
- 9.1.2.1. Reagents and Assay Kits
- 9.1.2.2. Microplates
- 9.1.2.3. Other Consumables
- 9.1.3. Software
- 9.1.4. Services
- 9.1.1. Instruments
- 9.2. Market Analysis, Insights and Forecast - by Application
- 9.2.1. Primary and Secondary Screening
- 9.2.2. Target Identification and Validation
- 9.2.3. Toxicity Studies
- 9.2.4. Compound Profiling
- 9.2.5. Other Applications
- 9.3. Market Analysis, Insights and Forecast - by End User
- 9.3.1. Pharmaceutical and Biotechnology Companies
- 9.3.2. Academic and Government Institutions
- 9.3.3. Contract Research Organization
- 9.1. Market Analysis, Insights and Forecast - by Product
- 10. Middle East and Africa High Content Screening Industry Analysis, Insights and Forecast, 2020-2032
- 10.1. Market Analysis, Insights and Forecast - by Product
- 10.1.1. Instruments
- 10.1.1.1. Cell Imaging and Analysis Systems
- 10.1.1.2. Flow Cytometers
- 10.1.2. Consumables
- 10.1.2.1. Reagents and Assay Kits
- 10.1.2.2. Microplates
- 10.1.2.3. Other Consumables
- 10.1.3. Software
- 10.1.4. Services
- 10.1.1. Instruments
- 10.2. Market Analysis, Insights and Forecast - by Application
- 10.2.1. Primary and Secondary Screening
- 10.2.2. Target Identification and Validation
- 10.2.3. Toxicity Studies
- 10.2.4. Compound Profiling
- 10.2.5. Other Applications
- 10.3. Market Analysis, Insights and Forecast - by End User
- 10.3.1. Pharmaceutical and Biotechnology Companies
- 10.3.2. Academic and Government Institutions
- 10.3.3. Contract Research Organization
- 10.1. Market Analysis, Insights and Forecast - by Product
- 11. South America High Content Screening Industry Analysis, Insights and Forecast, 2020-2032
- 11.1. Market Analysis, Insights and Forecast - by Product
- 11.1.1. Instruments
- 11.1.1.1. Cell Imaging and Analysis Systems
- 11.1.1.2. Flow Cytometers
- 11.1.2. Consumables
- 11.1.2.1. Reagents and Assay Kits
- 11.1.2.2. Microplates
- 11.1.2.3. Other Consumables
- 11.1.3. Software
- 11.1.4. Services
- 11.1.1. Instruments
- 11.2. Market Analysis, Insights and Forecast - by Application
- 11.2.1. Primary and Secondary Screening
- 11.2.2. Target Identification and Validation
- 11.2.3. Toxicity Studies
- 11.2.4. Compound Profiling
- 11.2.5. Other Applications
- 11.3. Market Analysis, Insights and Forecast - by End User
- 11.3.1. Pharmaceutical and Biotechnology Companies
- 11.3.2. Academic and Government Institutions
- 11.3.3. Contract Research Organization
- 11.1. Market Analysis, Insights and Forecast - by Product
- 12. Competitive Analysis
- 12.1. Company Profiles
- 12.1.1 Bio-Rad Laboratories Inc
- 12.1.1.1. Company Overview
- 12.1.1.2. Products
- 12.1.1.3. Company Financials
- 12.1.1.4. SWOT Analysis
- 12.1.2 Perkinelmer Inc
- 12.1.2.1. Company Overview
- 12.1.2.2. Products
- 12.1.2.3. Company Financials
- 12.1.2.4. SWOT Analysis
- 12.1.3 BD (Becton Dickinson and Company)
- 12.1.3.1. Company Overview
- 12.1.3.2. Products
- 12.1.3.3. Company Financials
- 12.1.3.4. SWOT Analysis
- 12.1.4 Thermo Fisher Scientific Inc
- 12.1.4.1. Company Overview
- 12.1.4.2. Products
- 12.1.4.3. Company Financials
- 12.1.4.4. SWOT Analysis
- 12.1.5 Danaher Corporation
- 12.1.5.1. Company Overview
- 12.1.5.2. Products
- 12.1.5.3. Company Financials
- 12.1.5.4. SWOT Analysis
- 12.1.6 Merck KGaA
- 12.1.6.1. Company Overview
- 12.1.6.2. Products
- 12.1.6.3. Company Financials
- 12.1.6.4. SWOT Analysis
- 12.1.7 Yokogawa Electric Corporation
- 12.1.7.1. Company Overview
- 12.1.7.2. Products
- 12.1.7.3. Company Financials
- 12.1.7.4. SWOT Analysis
- 12.1.8 Agilent Technologies
- 12.1.8.1. Company Overview
- 12.1.8.2. Products
- 12.1.8.3. Company Financials
- 12.1.8.4. SWOT Analysis
- 12.1.1 Bio-Rad Laboratories Inc
- 12.2. Market Entropy
- 12.2.1 Company's Key Areas Served
- 12.2.2 Recent Developments
- 12.3. Company Market Share Analysis 2025
- 12.3.1 Top 5 Companies Market Share Analysis
- 12.3.2 Top 3 Companies Market Share Analysis
- 12.4. List of Potential Customers
- 13. Research Methodology
List of Figures
- Figure 1: Global High Content Screening Industry Revenue Breakdown (billion, %) by Region 2025 & 2033
- Figure 2: North America High Content Screening Industry Revenue (billion), by Product 2025 & 2033
- Figure 3: North America High Content Screening Industry Revenue Share (%), by Product 2025 & 2033
- Figure 4: North America High Content Screening Industry Revenue (billion), by Application 2025 & 2033
- Figure 5: North America High Content Screening Industry Revenue Share (%), by Application 2025 & 2033
- Figure 6: North America High Content Screening Industry Revenue (billion), by End User 2025 & 2033
- Figure 7: North America High Content Screening Industry Revenue Share (%), by End User 2025 & 2033
- Figure 8: North America High Content Screening Industry Revenue (billion), by Country 2025 & 2033
- Figure 9: North America High Content Screening Industry Revenue Share (%), by Country 2025 & 2033
- Figure 10: Europe High Content Screening Industry Revenue (billion), by Product 2025 & 2033
- Figure 11: Europe High Content Screening Industry Revenue Share (%), by Product 2025 & 2033
- Figure 12: Europe High Content Screening Industry Revenue (billion), by Application 2025 & 2033
- Figure 13: Europe High Content Screening Industry Revenue Share (%), by Application 2025 & 2033
- Figure 14: Europe High Content Screening Industry Revenue (billion), by End User 2025 & 2033
- Figure 15: Europe High Content Screening Industry Revenue Share (%), by End User 2025 & 2033
- Figure 16: Europe High Content Screening Industry Revenue (billion), by Country 2025 & 2033
- Figure 17: Europe High Content Screening Industry Revenue Share (%), by Country 2025 & 2033
- Figure 18: Asia Pacific High Content Screening Industry Revenue (billion), by Product 2025 & 2033
- Figure 19: Asia Pacific High Content Screening Industry Revenue Share (%), by Product 2025 & 2033
- Figure 20: Asia Pacific High Content Screening Industry Revenue (billion), by Application 2025 & 2033
- Figure 21: Asia Pacific High Content Screening Industry Revenue Share (%), by Application 2025 & 2033
- Figure 22: Asia Pacific High Content Screening Industry Revenue (billion), by End User 2025 & 2033
- Figure 23: Asia Pacific High Content Screening Industry Revenue Share (%), by End User 2025 & 2033
- Figure 24: Asia Pacific High Content Screening Industry Revenue (billion), by Country 2025 & 2033
- Figure 25: Asia Pacific High Content Screening Industry Revenue Share (%), by Country 2025 & 2033
- Figure 26: Middle East and Africa High Content Screening Industry Revenue (billion), by Product 2025 & 2033
- Figure 27: Middle East and Africa High Content Screening Industry Revenue Share (%), by Product 2025 & 2033
- Figure 28: Middle East and Africa High Content Screening Industry Revenue (billion), by Application 2025 & 2033
- Figure 29: Middle East and Africa High Content Screening Industry Revenue Share (%), by Application 2025 & 2033
- Figure 30: Middle East and Africa High Content Screening Industry Revenue (billion), by End User 2025 & 2033
- Figure 31: Middle East and Africa High Content Screening Industry Revenue Share (%), by End User 2025 & 2033
- Figure 32: Middle East and Africa High Content Screening Industry Revenue (billion), by Country 2025 & 2033
- Figure 33: Middle East and Africa High Content Screening Industry Revenue Share (%), by Country 2025 & 2033
- Figure 34: South America High Content Screening Industry Revenue (billion), by Product 2025 & 2033
- Figure 35: South America High Content Screening Industry Revenue Share (%), by Product 2025 & 2033
- Figure 36: South America High Content Screening Industry Revenue (billion), by Application 2025 & 2033
- Figure 37: South America High Content Screening Industry Revenue Share (%), by Application 2025 & 2033
- Figure 38: South America High Content Screening Industry Revenue (billion), by End User 2025 & 2033
- Figure 39: South America High Content Screening Industry Revenue Share (%), by End User 2025 & 2033
- Figure 40: South America High Content Screening Industry Revenue (billion), by Country 2025 & 2033
- Figure 41: South America High Content Screening Industry Revenue Share (%), by Country 2025 & 2033
List of Tables
- Table 1: Global High Content Screening Industry Revenue billion Forecast, by Product 2020 & 2033
- Table 2: Global High Content Screening Industry Revenue billion Forecast, by Application 2020 & 2033
- Table 3: Global High Content Screening Industry Revenue billion Forecast, by End User 2020 & 2033
- Table 4: Global High Content Screening Industry Revenue billion Forecast, by Region 2020 & 2033
- Table 5: Global High Content Screening Industry Revenue billion Forecast, by Product 2020 & 2033
- Table 6: Global High Content Screening Industry Revenue billion Forecast, by Application 2020 & 2033
- Table 7: Global High Content Screening Industry Revenue billion Forecast, by End User 2020 & 2033
- Table 8: Global High Content Screening Industry Revenue billion Forecast, by Country 2020 & 2033
- Table 9: United States High Content Screening Industry Revenue (billion) Forecast, by Application 2020 & 2033
- Table 10: Canada High Content Screening Industry Revenue (billion) Forecast, by Application 2020 & 2033
- Table 11: Mexico High Content Screening Industry Revenue (billion) Forecast, by Application 2020 & 2033
- Table 12: Global High Content Screening Industry Revenue billion Forecast, by Product 2020 & 2033
- Table 13: Global High Content Screening Industry Revenue billion Forecast, by Application 2020 & 2033
- Table 14: Global High Content Screening Industry Revenue billion Forecast, by End User 2020 & 2033
- Table 15: Global High Content Screening Industry Revenue billion Forecast, by Country 2020 & 2033
- Table 16: Germany High Content Screening Industry Revenue (billion) Forecast, by Application 2020 & 2033
- Table 17: United Kingdom High Content Screening Industry Revenue (billion) Forecast, by Application 2020 & 2033
- Table 18: France High Content Screening Industry Revenue (billion) Forecast, by Application 2020 & 2033
- Table 19: Italy High Content Screening Industry Revenue (billion) Forecast, by Application 2020 & 2033
- Table 20: Spain High Content Screening Industry Revenue (billion) Forecast, by Application 2020 & 2033
- Table 21: Rest of Europe High Content Screening Industry Revenue (billion) Forecast, by Application 2020 & 2033
- Table 22: Global High Content Screening Industry Revenue billion Forecast, by Product 2020 & 2033
- Table 23: Global High Content Screening Industry Revenue billion Forecast, by Application 2020 & 2033
- Table 24: Global High Content Screening Industry Revenue billion Forecast, by End User 2020 & 2033
- Table 25: Global High Content Screening Industry Revenue billion Forecast, by Country 2020 & 2033
- Table 26: China High Content Screening Industry Revenue (billion) Forecast, by Application 2020 & 2033
- Table 27: Japan High Content Screening Industry Revenue (billion) Forecast, by Application 2020 & 2033
- Table 28: India High Content Screening Industry Revenue (billion) Forecast, by Application 2020 & 2033
- Table 29: Australia High Content Screening Industry Revenue (billion) Forecast, by Application 2020 & 2033
- Table 30: South Korea High Content Screening Industry Revenue (billion) Forecast, by Application 2020 & 2033
- Table 31: Rest of Asia Pacific High Content Screening Industry Revenue (billion) Forecast, by Application 2020 & 2033
- Table 32: Global High Content Screening Industry Revenue billion Forecast, by Product 2020 & 2033
- Table 33: Global High Content Screening Industry Revenue billion Forecast, by Application 2020 & 2033
- Table 34: Global High Content Screening Industry Revenue billion Forecast, by End User 2020 & 2033
- Table 35: Global High Content Screening Industry Revenue billion Forecast, by Country 2020 & 2033
- Table 36: GCC High Content Screening Industry Revenue (billion) Forecast, by Application 2020 & 2033
- Table 37: South Africa High Content Screening Industry Revenue (billion) Forecast, by Application 2020 & 2033
- Table 38: Rest of Middle East and Africa High Content Screening Industry Revenue (billion) Forecast, by Application 2020 & 2033
- Table 39: Global High Content Screening Industry Revenue billion Forecast, by Product 2020 & 2033
- Table 40: Global High Content Screening Industry Revenue billion Forecast, by Application 2020 & 2033
- Table 41: Global High Content Screening Industry Revenue billion Forecast, by End User 2020 & 2033
- Table 42: Global High Content Screening Industry Revenue billion Forecast, by Country 2020 & 2033
- Table 43: Brazil High Content Screening Industry Revenue (billion) Forecast, by Application 2020 & 2033
- Table 44: Argentina High Content Screening Industry Revenue (billion) Forecast, by Application 2020 & 2033
- Table 45: Rest of South America High Content Screening Industry Revenue (billion) Forecast, by Application 2020 & 2033
Frequently Asked Questions
1. What is the projected Compound Annual Growth Rate (CAGR) of the High Content Screening Industry?
The projected CAGR is approximately 7.5%.
2. Which companies are prominent players in the High Content Screening Industry?
Key companies in the market include Bio-Rad Laboratories Inc, Perkinelmer Inc, BD (Becton Dickinson and Company), Thermo Fisher Scientific Inc, Danaher Corporation, Merck KGaA, Yokogawa Electric Corporation, Agilent Technologies.
3. What are the main segments of the High Content Screening Industry?
The market segments include Product, Application, End User.
4. Can you provide details about the market size?
The market size is estimated to be USD 1.52 billion as of 2022.
5. What are some drivers contributing to market growth?
Government Funding and Venture Capital Investments Across Developed Markets; Increasing Applications of High Content Screening in Life Science Research; Advancements in Informatic Solutions and Imaging Systems.
6. What are the notable trends driving market growth?
Flow Cytometry is Expected to Hold a Significant Market Share Over The Forecast Period.
7. Are there any restraints impacting market growth?
Lower Adoption of High Content Screening Instruments Due to Their High Prices.
8. Can you provide examples of recent developments in the market?
September 2022: BD (Becton, Dickinson and Company) launched BD Research Cloud, a cloud-based software solution designed to streamline the flow cytometry workflow. Its goal is to simplify the workflow for scientists working in a variety of fields, such as immunology, virology, oncology, and infectious disease monitoring, to enable higher-quality experiments with quicker time to insight.
9. What pricing options are available for accessing the report?
Pricing options include single-user, multi-user, and enterprise licenses priced at USD 4750, USD 5250, and USD 8750 respectively.
10. Is the market size provided in terms of value or volume?
The market size is provided in terms of value, measured in billion.
11. Are there any specific market keywords associated with the report?
Yes, the market keyword associated with the report is "High Content Screening Industry," which aids in identifying and referencing the specific market segment covered.
12. How do I determine which pricing option suits my needs best?
The pricing options vary based on user requirements and access needs. Individual users may opt for single-user licenses, while businesses requiring broader access may choose multi-user or enterprise licenses for cost-effective access to the report.
13. Are there any additional resources or data provided in the High Content Screening Industry report?
While the report offers comprehensive insights, it's advisable to review the specific contents or supplementary materials provided to ascertain if additional resources or data are available.
14. How can I stay updated on further developments or reports in the High Content Screening Industry?
To stay informed about further developments, trends, and reports in the High Content Screening Industry, consider subscribing to industry newsletters, following relevant companies and organizations, or regularly checking reputable industry news sources and publications.
Methodology
Step 1 - Identification of Relevant Samples Size from Population Database


Step 2 - Approaches for Defining Global Market Size (Value, Volume* & Price*)

Note*: In applicable scenarios
Step 3 - Data Sources
Primary Research
- Web Analytics
- Survey Reports
- Research Institute
- Latest Research Reports
- Opinion Leaders
Secondary Research
- Annual Reports
- White Paper
- Latest Press Release
- Industry Association
- Paid Database
- Investor Presentations

Step 4 - Data Triangulation
Involves using different sources of information in order to increase the validity of a study
These sources are likely to be stakeholders in a program - participants, other researchers, program staff, other community members, and so on.
Then we put all data in single framework & apply various statistical tools to find out the dynamic on the market.
During the analysis stage, feedback from the stakeholder groups would be compared to determine areas of agreement as well as areas of divergence