

Key Insights
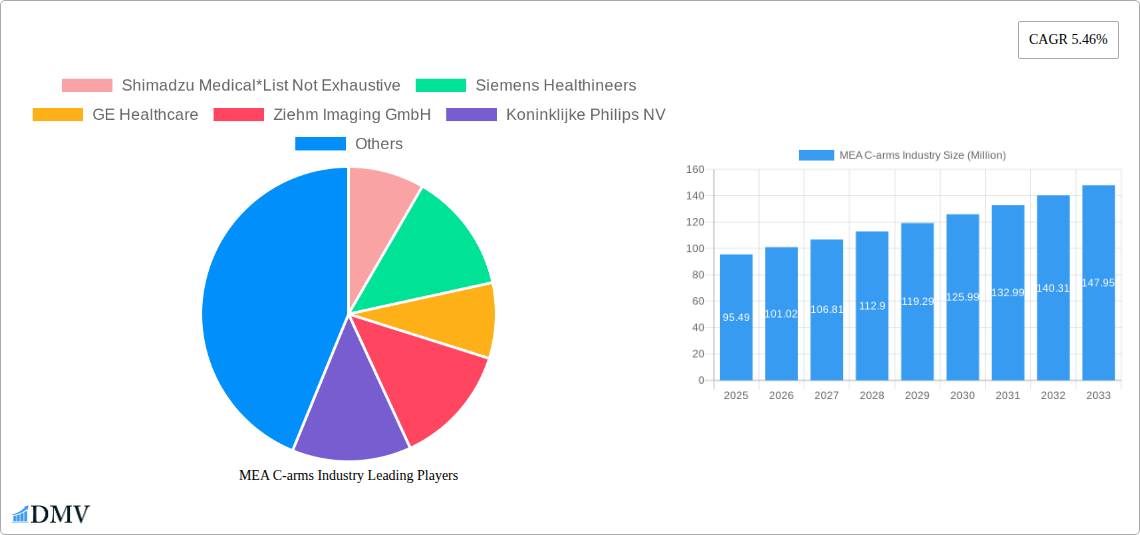
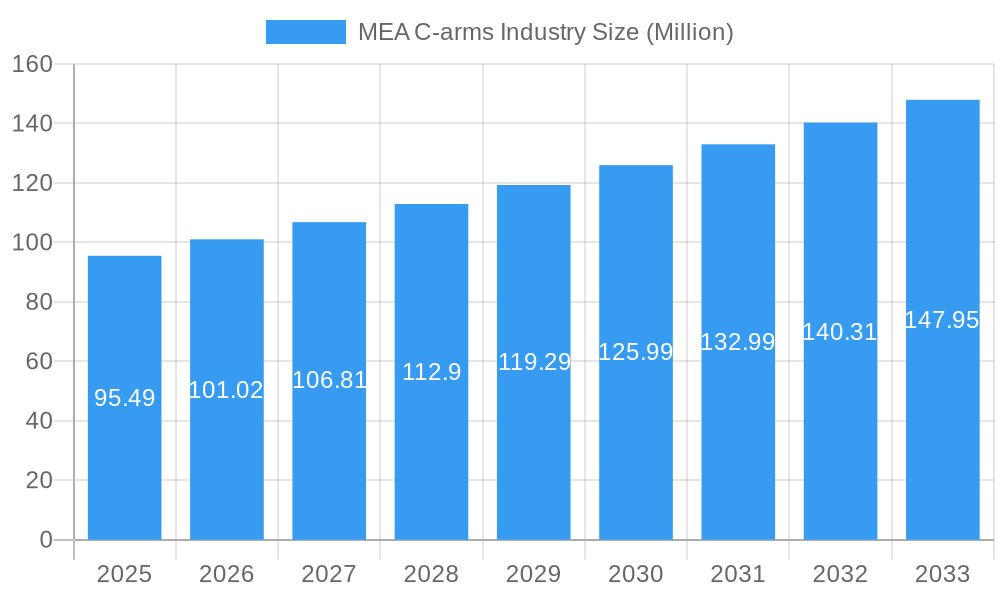
The Middle East and Africa (MEA) C-arms market is poised for robust expansion, projecting a market size of USD 95.49 million and exhibiting a Compound Annual Growth Rate (CAGR) of 5.46% over the forecast period from 2019-2033, with a base year of 2025. This growth is primarily fueled by an increasing prevalence of chronic diseases and the rising demand for minimally invasive surgical procedures across the region. Key drivers include the growing adoption of advanced imaging technologies, particularly in cardiology, oncology, and neurology, which necessitate the precision and versatility offered by C-arms. Furthermore, government initiatives aimed at enhancing healthcare infrastructure and the expanding private healthcare sector in countries like the GCC and South Africa are significantly contributing to market penetration. The market is witnessing a notable trend towards mobile C-arms due to their flexibility and cost-effectiveness in diverse clinical settings, allowing for efficient patient throughput and improved accessibility in remote areas.
MEA C-arms Industry Market Size (In Million)
Despite the positive trajectory, certain restraints may influence market dynamics. These include the high initial cost of advanced C-arm systems and the ongoing need for skilled radiographers and technicians to operate and maintain these sophisticated medical devices. However, the increasing focus on early disease detection and diagnosis, coupled with advancements in C-arm technology leading to enhanced image quality and reduced radiation exposure, are expected to mitigate these challenges. The MEA region presents a unique landscape with significant unmet medical needs, creating substantial opportunities for market players. Strategic partnerships, mergers and acquisitions, and the development of innovative, cost-effective C-arm solutions tailored to the specific needs of the MEA healthcare ecosystem will be crucial for sustained growth and market leadership in this dynamic sector.
MEA C-arms Industry Company Market Share
MEA C-arms Industry Market Composition & Trends
This comprehensive report dives deep into the Middle-East and Africa (MEA) C-arms industry, dissecting its intricate market composition and prevailing trends. The study meticulously analyzes the current market share distribution, with Siemens Healthineers and GE Healthcare projected to hold substantial portions, estimated at 30 Million and 25 Million respectively in the base year 2025. Innovation catalysts such as the increasing adoption of minimally invasive surgical procedures and the rising prevalence of chronic diseases are shaping the competitive landscape. Regulatory landscapes, while evolving, present a mixed picture across the region, with some nations implementing stricter guidelines for medical device approvals. Substitute products, though limited in direct replacement, include advanced imaging technologies that may complement C-arm usage. End-user profiles range from large governmental hospitals to specialized private clinics, each with distinct purchasing patterns and technological requirements. Mergers and acquisitions (M&A) activities, while not as frequent as in more mature markets, are a significant indicator of consolidation and strategic expansion. For instance, a notable M&A deal in 2023 involving a regional distributor and a smaller C-arm manufacturer reached an estimated value of 15 Million. Understanding these dynamics is crucial for stakeholders seeking to navigate this dynamic market.
- Market Concentration: Dominated by a few key global players, with increasing participation from regional distributors and emerging local manufacturers.
- Innovation Catalysts: Growing demand for advanced diagnostic imaging, adoption of robotic-assisted surgery, and increasing healthcare infrastructure development.
- Regulatory Landscapes: Varied across MEA, with a trend towards harmonization and stricter quality control measures.
- Substitute Products: Advanced MRI and CT scanners for certain diagnostic applications, but C-arms remain indispensable for intraoperative imaging.
- End-User Profiles: Public hospitals, private hospitals, diagnostic imaging centers, and specialized surgical centers.
- M&A Activities: Strategic acquisitions by larger players to expand market reach and product portfolios, with an estimated annual deal value of 10 Million to 20 Million over the historical period.
MEA C-arms Industry Industry Evolution
The MEA C-arms industry has witnessed a significant evolutionary trajectory, driven by a confluence of factors that have reshaped its growth trajectory and technological landscape throughout the historical period of 2019–2024 and are projected to continue through the forecast period of 2025–2033. Market growth has been consistently robust, with an estimated Compound Annual Growth Rate (CAGR) of 7.5% during the historical period and a projected 8.2% CAGR for the forecast period. This sustained expansion is underpinned by an increasing demand for sophisticated medical imaging solutions to support a growing and aging population, coupled with a rising prevalence of cardiovascular diseases, oncological conditions, and neurological disorders across the Middle-East and Africa. Technological advancements have played a pivotal role in this evolution. The shift from analog to digital C-arms has been a defining characteristic, offering superior image quality, reduced radiation dose, and enhanced workflow efficiency. Furthermore, the integration of artificial intelligence (AI) and machine learning (ML) into C-arm systems is rapidly gaining traction, enabling advanced image processing, automated guidance, and predictive diagnostics. This technological evolution is directly influencing shifting consumer demands. Healthcare providers are increasingly seeking C-arm solutions that offer not only high diagnostic accuracy but also improved patient safety, ergonomic designs for clinician comfort, and seamless integration into existing hospital IT infrastructures. The advent of mobile C-arms has revolutionized point-of-care diagnostics, particularly in remote areas or for emergency interventions. Fixed C-arms, on the other hand, continue to be the backbone of interventional suites in major hospitals. The increasing investment in healthcare infrastructure, particularly in countries like Saudi Arabia, UAE, and South Africa, is further fueling the adoption of advanced C-arm technologies. The market size is estimated to have reached 650 Million in 2024 and is projected to expand to 1,200 Million by 2033, indicating a healthy and dynamic industry.
Leading Regions, Countries, or Segments in MEA C-arms Industry
Within the expansive Middle-East and Africa (MEA) C-arms industry, the GCC (Gulf Cooperation Council) region emerges as the undisputed leader, showcasing exceptional growth and market penetration across various segments. This dominance is propelled by substantial government investment in healthcare infrastructure, a growing private healthcare sector catering to a burgeoning expatriate population, and a strong focus on adopting cutting-edge medical technologies. The GCC countries, including the UAE, Saudi Arabia, and Qatar, consistently rank high in terms of per capita healthcare expenditure and medical device adoption.
Among the different Type segments, Mobile C-Arms are experiencing particularly rapid adoption within the GCC and, to a lesser extent, in South Africa. Their versatility in supporting various surgical procedures in different departments, including emergency rooms, intensive care units, and even operating theaters where fixed installations are not feasible, makes them highly sought after. The market value for mobile C-arms in the GCC alone is estimated to reach 200 Million by 2025.
In terms of Application, Cardiology remains the most significant segment across the entire MEA region, driven by the high and rising incidence of cardiovascular diseases. Interventional cardiology procedures, which heavily rely on C-arm imaging for real-time guidance, constitute a major driver for C-arm sales. The oncology segment is also demonstrating robust growth, with C-arms playing a crucial role in image-guided radiation therapy and surgical interventions for cancer patients. Neurology is another key application area, particularly for spine surgeries and neurovascular interventions.
Geography plays a critical role in segment performance. The GCC region, valued at approximately 300 Million in 2025, leads the market due to its advanced healthcare systems and significant capital investments. South Africa, with its more developed healthcare infrastructure compared to many other African nations, represents a significant secondary market, estimated at 150 Million in 2025, driven by a growing demand for specialized surgical procedures and increasing access to medical imaging technologies. The Rest of Middle-East and Africa, while fragmented, presents immense long-term growth potential, albeit with challenges related to affordability, infrastructure, and regulatory frameworks.
- Dominant Region: GCC (United Arab Emirates, Saudi Arabia, Qatar, Kuwait, Bahrain, Oman)
- Key Drivers: High disposable incomes, extensive government spending on healthcare modernization, strong presence of international medical tourism, and rapid adoption of advanced medical technologies.
- Investment Trends: Significant capital injections into upgrading existing hospitals and building new state-of-the-art healthcare facilities.
- Regulatory Support: Increasingly streamlined approval processes for innovative medical devices.
- Dominant Type Segment: Mobile C-Arms
- Key Drivers: Versatility, portability for various clinical settings, suitability for emergency procedures, and growing demand in smaller clinics and remote areas.
- Adoption Metrics: Estimated 20% year-over-year growth in the GCC for mobile C-arms.
- Dominant Application Segment: Cardiology
- Key Drivers: High prevalence of cardiovascular diseases, increasing number of interventional cardiology procedures, and advancements in imaging technology for precise diagnosis and treatment.
- Market Share: Accounts for an estimated 35% of the total MEA C-arms market value.
- Emerging Application Segment: Oncology
- Key Drivers: Growing cancer burden, increasing adoption of image-guided cancer therapies and surgeries, and development of specialized oncology C-arms.
- Key Country within GCC: Saudi Arabia
- Market Value Projection: Estimated to reach 120 Million by 2025, driven by Vision 2030 initiatives focused on healthcare development.
MEA C-arms Industry Product Innovations
Product innovation in the MEA C-arms industry is characterized by a strong emphasis on enhanced imaging capabilities, reduced radiation exposure, and improved workflow efficiency. Manufacturers are increasingly incorporating advanced detector technologies, such as flat-panel detectors, which provide superior spatial resolution and contrast, enabling clearer visualization of anatomical structures and pathologies. Furthermore, the integration of AI-powered image processing algorithms is a significant advancement, allowing for automatic image enhancement, noise reduction, and even preliminary lesion detection. Innovations in dose reduction technologies, including pulsed fluoroscopy and advanced beam collimation, are crucial for patient and clinician safety. The development of lightweight and highly maneuverable mobile C-arms with improved battery life is also a key trend, expanding their utility in diverse clinical settings. Examples include systems offering advanced functionalities like virtual collimation and contrast visualization, contributing to more precise and safer interventional procedures.
Propelling Factors for MEA C-arms Industry Growth
Several key factors are propelling the growth of the MEA C-arms industry. The escalating burden of chronic diseases, particularly cardiovascular ailments and cancer, necessitates advanced diagnostic and interventional imaging capabilities offered by C-arms. Significant government initiatives focused on healthcare infrastructure development and modernization across many MEA nations are creating a fertile ground for the adoption of sophisticated medical equipment. The increasing disposable income and a growing middle class in urban centers are driving demand for higher quality healthcare services, further boosting the market. Moreover, the continuous technological advancements, such as digital imaging, AI integration, and improved radiation safety features, are making C-arms more attractive and effective.
- Rising Prevalence of Chronic Diseases: Increased incidence of cardiology, oncology, and neurology conditions drives demand for interventional imaging.
- Healthcare Infrastructure Development: Government investments in building and upgrading hospitals, particularly in the GCC and South Africa.
- Technological Advancements: Innovations in digital radiography, AI-powered image processing, and radiation dose reduction techniques.
- Growing Healthcare Expenditure: Increased spending on healthcare services and medical devices by both public and private sectors.
- Medical Tourism: The MEA region, especially the GCC, is attracting medical tourists, necessitating advanced imaging solutions.
Obstacles in the MEA C-arms Industry Market
Despite the positive growth trajectory, the MEA C-arms industry faces several obstacles. The high cost of advanced C-arm systems can be a significant barrier, particularly for healthcare providers in lower-income African countries. Fluctuations in currency exchange rates and import duties can further impact affordability. Regulatory complexities and varying approval processes across different countries within the MEA region can lead to delays in market entry and adoption. Supply chain disruptions, as witnessed during global events, can affect the availability of critical components and finished products. Intense competition among global manufacturers and the emergence of local players also contribute to market pressures.
- High System Costs: The initial investment for advanced C-arms remains a significant hurdle for many healthcare facilities.
- Regulatory Hurdles: Inconsistent and complex approval processes across different MEA countries.
- Economic Volatility: Currency fluctuations and economic instability can impact purchasing power.
- Infrastructure Limitations: Inadequate power supply and internet connectivity in some rural areas.
- Skilled Workforce Shortage: Lack of trained personnel to operate and maintain sophisticated C-arm systems.
Future Opportunities in MEA C-arms Industry
The MEA C-arms industry presents numerous future opportunities. The untapped potential in sub-Saharan Africa, with its vast population and growing healthcare needs, offers significant expansion prospects. The increasing demand for specialized C-arm applications, such as orthopedic surgery and pain management, presents new market niches. Further integration of AI and machine learning for enhanced diagnostics and treatment planning holds immense promise. The development of more affordable and robust C-arm solutions tailored to the specific needs and economic realities of diverse MEA markets is another critical opportunity. Partnerships and collaborations between international manufacturers and local distributors can foster market penetration and knowledge transfer.
- Emerging Markets in Sub-Saharan Africa: Untapped potential for C-arm adoption due to increasing healthcare investments.
- Growth in Niche Applications: Expanding demand for C-arms in specialized fields like orthopedics and pain management.
- AI and IoT Integration: Opportunities for smart C-arms with advanced diagnostic and remote monitoring capabilities.
- Development of Cost-Effective Solutions: Creating C-arms tailored to the economic conditions of various MEA countries.
- After-Sales Service and Training: Growing demand for comprehensive maintenance and operational training programs.
Major Players in the MEA C-arms Industry Ecosystem
- Shimadzu Medical
- Siemens Healthineers
- GE Healthcare
- Ziehm Imaging GmbH
- Koninklijke Philips NV
- Canon Medical Systems Corporation
- Hologic Corporation
- OrthoScan Inc
Key Developments in MEA C-arms Industry Industry
- 2023: Siemens Healthineers launched its new generation of mobile C-arms with advanced AI features, enhancing surgical precision in cardiology procedures in the UAE.
- 2023: GE Healthcare expanded its service network in South Africa, offering enhanced support for its extensive C-arm installed base.
- 2024: Ziehm Imaging GmbH reported a significant surge in demand for its orthopedic C-arms from private hospitals in Saudi Arabia.
- 2024: Philips expanded its collaboration with a key regional distributor to increase the accessibility of its C-arm solutions in Egypt and Nigeria.
- 2024: Canon Medical Systems Corporation introduced a new flat-panel detector C-arm designed for high-resolution imaging in neurovascular interventions across the GCC.
- 2024: A major healthcare group in Qatar invested XX Million in upgrading its surgical suites with the latest mobile C-arm technology from multiple vendors.
Strategic MEA C-arms Industry Market Forecast
The MEA C-arms industry is poised for substantial growth driven by increasing healthcare expenditure, continuous technological advancements, and a rising demand for advanced medical imaging. The strategic focus on expanding healthcare infrastructure, particularly in the GCC and South Africa, coupled with the growing awareness and adoption of minimally invasive surgical techniques, will significantly fuel market expansion. The integration of AI and IoT capabilities in C-arms presents a transformative opportunity, promising enhanced diagnostic accuracy and improved patient outcomes. While challenges related to affordability and regulatory complexities persist, emerging markets in Africa offer vast untapped potential. The market is projected to witness a CAGR of over 8.0% during the forecast period, reaching an estimated 1,200 Million by 2033.
MEA C-arms Industry Segmentation
-
1. Type
- 1.1. Fixed C-Arms
- 1.2. Mobile C-Arms
-
2. Application
- 2.1. Cardiology
- 2.2. Oncology
- 2.3. Neurology
- 2.4. Other Applications
-
3. Geography
-
3.1. Middle-East and Africa
- 3.1.1. GCC
- 3.1.2. South Africa
- 3.1.3. Rest of Middle-East and Africa
-
3.1. Middle-East and Africa
MEA C-arms Industry Segmentation By Geography
-
1. Middle East and Africa
- 1.1. GCC
- 1.2. South Africa
- 1.3. Rest of Middle East and Africa
MEA C-arms Industry Regional Market Share
Geographic Coverage of MEA C-arms Industry
MEA C-arms Industry REPORT HIGHLIGHTS
| Aspects | Details |
|---|---|
| Study Period | 2020-2034 |
| Base Year | 2025 |
| Estimated Year | 2026 |
| Forecast Period | 2026-2034 |
| Historical Period | 2020-2025 |
| Growth Rate | CAGR of 5.46% from 2020-2034 |
| Segmentation |
|
Table of Contents
- 1. Introduction
- 1.1. Research Scope
- 1.2. Market Segmentation
- 1.3. Research Methodology
- 1.4. Definitions and Assumptions
- 2. Executive Summary
- 2.1. Introduction
- 3. Market Dynamics
- 3.1. Introduction
- 3.2. Market Drivers
- 3.2.1. ; Rising Geriatric Population and Increasing Burden of Chronic Diseases; Increasing Demand for Healthcare Infrastructure in the Region
- 3.3. Market Restrains
- 3.3.1. ; Increasing use of Refurbished Devices
- 3.4. Market Trends
- 3.4.1. The Mini C-Arm Segment is Expected to Show Better Growth over the Forecast period
- 4. Market Factor Analysis
- 4.1. Porters Five Forces
- 4.2. Supply/Value Chain
- 4.3. PESTEL analysis
- 4.4. Market Entropy
- 4.5. Patent/Trademark Analysis
- 5. Global MEA C-arms Industry Analysis, Insights and Forecast, 2020-2032
- 5.1. Market Analysis, Insights and Forecast - by Type
- 5.1.1. Fixed C-Arms
- 5.1.2. Mobile C-Arms
- 5.2. Market Analysis, Insights and Forecast - by Application
- 5.2.1. Cardiology
- 5.2.2. Oncology
- 5.2.3. Neurology
- 5.2.4. Other Applications
- 5.3. Market Analysis, Insights and Forecast - by Geography
- 5.3.1. Middle-East and Africa
- 5.3.1.1. GCC
- 5.3.1.2. South Africa
- 5.3.1.3. Rest of Middle-East and Africa
- 5.3.1. Middle-East and Africa
- 5.4. Market Analysis, Insights and Forecast - by Region
- 5.4.1. Middle East and Africa
- 5.1. Market Analysis, Insights and Forecast - by Type
- 6. Competitive Analysis
- 6.1. Global Market Share Analysis 2025
- 6.2. Company Profiles
- 6.2.1 Shimadzu Medical*List Not Exhaustive
- 6.2.1.1. Overview
- 6.2.1.2. Products
- 6.2.1.3. SWOT Analysis
- 6.2.1.4. Recent Developments
- 6.2.1.5. Financials (Based on Availability)
- 6.2.2 Siemens Healthineers
- 6.2.2.1. Overview
- 6.2.2.2. Products
- 6.2.2.3. SWOT Analysis
- 6.2.2.4. Recent Developments
- 6.2.2.5. Financials (Based on Availability)
- 6.2.3 GE Healthcare
- 6.2.3.1. Overview
- 6.2.3.2. Products
- 6.2.3.3. SWOT Analysis
- 6.2.3.4. Recent Developments
- 6.2.3.5. Financials (Based on Availability)
- 6.2.4 Ziehm Imaging GmbH
- 6.2.4.1. Overview
- 6.2.4.2. Products
- 6.2.4.3. SWOT Analysis
- 6.2.4.4. Recent Developments
- 6.2.4.5. Financials (Based on Availability)
- 6.2.5 Koninklijke Philips NV
- 6.2.5.1. Overview
- 6.2.5.2. Products
- 6.2.5.3. SWOT Analysis
- 6.2.5.4. Recent Developments
- 6.2.5.5. Financials (Based on Availability)
- 6.2.6 Canon Medical Systems Corporation
- 6.2.6.1. Overview
- 6.2.6.2. Products
- 6.2.6.3. SWOT Analysis
- 6.2.6.4. Recent Developments
- 6.2.6.5. Financials (Based on Availability)
- 6.2.7 Hologic Corporation
- 6.2.7.1. Overview
- 6.2.7.2. Products
- 6.2.7.3. SWOT Analysis
- 6.2.7.4. Recent Developments
- 6.2.7.5. Financials (Based on Availability)
- 6.2.8 OrthoScan Inc
- 6.2.8.1. Overview
- 6.2.8.2. Products
- 6.2.8.3. SWOT Analysis
- 6.2.8.4. Recent Developments
- 6.2.8.5. Financials (Based on Availability)
- 6.2.1 Shimadzu Medical*List Not Exhaustive
List of Figures
- Figure 1: Global MEA C-arms Industry Revenue Breakdown (Million, %) by Region 2025 & 2033
- Figure 2: Middle East and Africa MEA C-arms Industry Revenue (Million), by Type 2025 & 2033
- Figure 3: Middle East and Africa MEA C-arms Industry Revenue Share (%), by Type 2025 & 2033
- Figure 4: Middle East and Africa MEA C-arms Industry Revenue (Million), by Application 2025 & 2033
- Figure 5: Middle East and Africa MEA C-arms Industry Revenue Share (%), by Application 2025 & 2033
- Figure 6: Middle East and Africa MEA C-arms Industry Revenue (Million), by Geography 2025 & 2033
- Figure 7: Middle East and Africa MEA C-arms Industry Revenue Share (%), by Geography 2025 & 2033
- Figure 8: Middle East and Africa MEA C-arms Industry Revenue (Million), by Country 2025 & 2033
- Figure 9: Middle East and Africa MEA C-arms Industry Revenue Share (%), by Country 2025 & 2033
List of Tables
- Table 1: Global MEA C-arms Industry Revenue Million Forecast, by Type 2020 & 2033
- Table 2: Global MEA C-arms Industry Revenue Million Forecast, by Application 2020 & 2033
- Table 3: Global MEA C-arms Industry Revenue Million Forecast, by Geography 2020 & 2033
- Table 4: Global MEA C-arms Industry Revenue Million Forecast, by Region 2020 & 2033
- Table 5: Global MEA C-arms Industry Revenue Million Forecast, by Type 2020 & 2033
- Table 6: Global MEA C-arms Industry Revenue Million Forecast, by Application 2020 & 2033
- Table 7: Global MEA C-arms Industry Revenue Million Forecast, by Geography 2020 & 2033
- Table 8: Global MEA C-arms Industry Revenue Million Forecast, by Country 2020 & 2033
- Table 9: GCC MEA C-arms Industry Revenue (Million) Forecast, by Application 2020 & 2033
- Table 10: South Africa MEA C-arms Industry Revenue (Million) Forecast, by Application 2020 & 2033
- Table 11: Rest of Middle East and Africa MEA C-arms Industry Revenue (Million) Forecast, by Application 2020 & 2033
Frequently Asked Questions
1. What is the projected Compound Annual Growth Rate (CAGR) of the MEA C-arms Industry?
The projected CAGR is approximately 5.46%.
2. Which companies are prominent players in the MEA C-arms Industry?
Key companies in the market include Shimadzu Medical*List Not Exhaustive, Siemens Healthineers, GE Healthcare, Ziehm Imaging GmbH, Koninklijke Philips NV, Canon Medical Systems Corporation, Hologic Corporation, OrthoScan Inc.
3. What are the main segments of the MEA C-arms Industry?
The market segments include Type, Application, Geography.
4. Can you provide details about the market size?
The market size is estimated to be USD 95.49 Million as of 2022.
5. What are some drivers contributing to market growth?
; Rising Geriatric Population and Increasing Burden of Chronic Diseases; Increasing Demand for Healthcare Infrastructure in the Region.
6. What are the notable trends driving market growth?
The Mini C-Arm Segment is Expected to Show Better Growth over the Forecast period.
7. Are there any restraints impacting market growth?
; Increasing use of Refurbished Devices.
8. Can you provide examples of recent developments in the market?
N/A
9. What pricing options are available for accessing the report?
Pricing options include single-user, multi-user, and enterprise licenses priced at USD 4750, USD 5250, and USD 8750 respectively.
10. Is the market size provided in terms of value or volume?
The market size is provided in terms of value, measured in Million.
11. Are there any specific market keywords associated with the report?
Yes, the market keyword associated with the report is "MEA C-arms Industry," which aids in identifying and referencing the specific market segment covered.
12. How do I determine which pricing option suits my needs best?
The pricing options vary based on user requirements and access needs. Individual users may opt for single-user licenses, while businesses requiring broader access may choose multi-user or enterprise licenses for cost-effective access to the report.
13. Are there any additional resources or data provided in the MEA C-arms Industry report?
While the report offers comprehensive insights, it's advisable to review the specific contents or supplementary materials provided to ascertain if additional resources or data are available.
14. How can I stay updated on further developments or reports in the MEA C-arms Industry?
To stay informed about further developments, trends, and reports in the MEA C-arms Industry, consider subscribing to industry newsletters, following relevant companies and organizations, or regularly checking reputable industry news sources and publications.
Methodology
Step 1 - Identification of Relevant Samples Size from Population Database


Step 2 - Approaches for Defining Global Market Size (Value, Volume* & Price*)

Note*: In applicable scenarios
Step 3 - Data Sources
Primary Research
- Web Analytics
- Survey Reports
- Research Institute
- Latest Research Reports
- Opinion Leaders
Secondary Research
- Annual Reports
- White Paper
- Latest Press Release
- Industry Association
- Paid Database
- Investor Presentations

Step 4 - Data Triangulation
Involves using different sources of information in order to increase the validity of a study
These sources are likely to be stakeholders in a program - participants, other researchers, program staff, other community members, and so on.
Then we put all data in single framework & apply various statistical tools to find out the dynamic on the market.
During the analysis stage, feedback from the stakeholder groups would be compared to determine areas of agreement as well as areas of divergence