

Key Insights
The Graft Versus Host Disease (GVHD) Treatment Market is projected for substantial growth, expected to reach USD 3.07 billion by 2025, with a Compound Annual Growth Rate (CAGR) of 7.5%. This expansion is driven by advancements in stem cell transplantation, leading to a higher incidence of GVHD requiring advanced treatment solutions. Key growth factors include the increasing prevalence of hematological malignancies and other conditions necessitating stem cell transplants, alongside rising global healthcare spending, which improves access to sophisticated GVHD therapies. The development of novel therapeutics, including monoclonal antibodies and tyrosine kinase inhibitors targeting specific inflammatory pathways, further fuels market expansion. An aging global population, more susceptible to post-transplant complications like GVHD, also contributes to sustained demand for effective treatments.
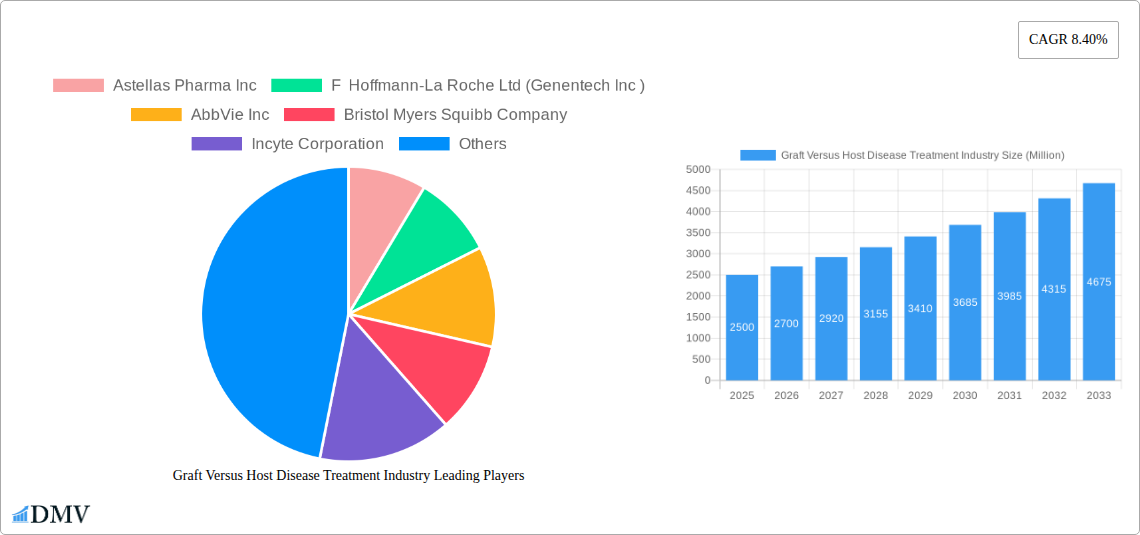
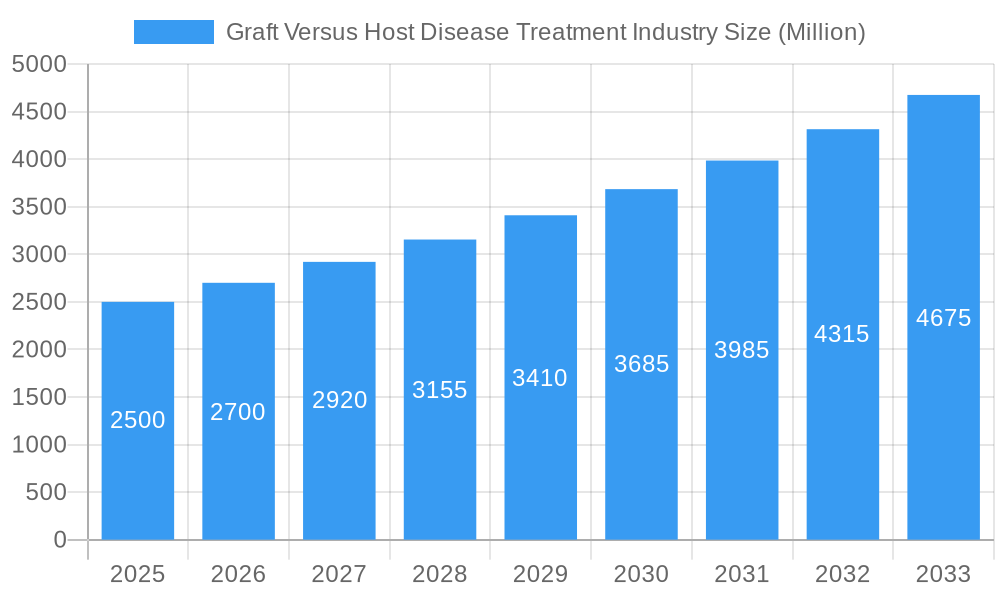
Graft Versus Host Disease Treatment Industry Market Size (In Billion)
The market segmentation reveals a dynamic landscape. Within disease categories, both Acute and Chronic GVHD are significant treatment areas, with chronic forms demanding ongoing management. Product-wise, while corticosteroids remain a primary treatment, the market is trending towards targeted therapies such as monoclonal antibodies and tyrosine kinase inhibitors, offering enhanced efficacy and reduced adverse effects. The 'Other Products' segment includes emerging immunomodulatory and cellular therapies with strong growth potential. Distribution is primarily through hospital pharmacies due to the specialized nature of GVHD treatment, though online and retail pharmacies are growing for supportive care medications. Geographically, North America and Europe are expected to dominate, supported by advanced healthcare infrastructure, high transplant volumes, and robust R&D. The Asia Pacific region is poised for the fastest growth, driven by increased awareness, improved healthcare access, and a rising number of transplant centers.
Graft Versus Host Disease Treatment Industry Company Market Share
This comprehensive report offers an in-depth analysis of the Graft Versus Host Disease (GVHD) treatment market, detailing its current status, historical trends, and future projections. Covering a study period from 2019 to 2033, with a base year of 2025, this report is an essential resource for stakeholders seeking to understand market dynamics, identify growth opportunities, and navigate the complexities of GVHD treatment strategies. It meticulously examines key market segments, leading players, technological advancements, and regulatory influences shaping the future of GVHD therapies.
Graft Versus Host Disease Treatment Industry Market Composition & Trends
The Graft Versus Host Disease (GvHD) treatment market, projected to reach xx Million by 2025, is characterized by a moderately concentrated landscape with key pharmaceutical giants and emerging biotechs vying for market share. Innovation in novel therapeutic modalities, particularly monoclonal antibodies and tyrosine kinase inhibitors, is a significant catalyst, driving demand for more effective GvHD management. The regulatory environment, while stringent, has seen a positive shift with approvals for advanced therapies, encouraging further investment. Substitute products, primarily corticosteroids, still hold a substantial market share due to their established efficacy and affordability, but newer treatments are gaining traction for steroid-refractory cases. End-user profiles are dominated by hospital pharmacies due to the critical care nature of GvHD treatment, followed by online and retail pharmacies catering to patient convenience and ongoing management. Mergers and acquisitions (M&A) activity, with reported deal values in the range of xx Million to xx Million, are crucial for portfolio expansion and market consolidation.
- Market Concentration: Dominated by a few large pharmaceutical players and an increasing number of specialized biotech firms.
- Innovation Catalysts: Development of novel biologics and targeted therapies for steroid-refractory GvHD.
- Regulatory Landscape: Approvals for advanced therapies are accelerating market growth.
- Substitute Products: Corticosteroids remain a benchmark, but their limitations drive demand for alternatives.
- End-User Profile: Hospital pharmacies are primary channels, with growing importance of other channels.
- M&A Activity: Strategic acquisitions to enhance R&D pipelines and market reach.
Graft Versus Host Disease Treatment Industry Industry Evolution
The Graft Versus Host Disease (GvHD) treatment industry has undergone a significant transformation over the historical period of 2019-2024, driven by a confluence of evolving scientific understanding, groundbreaking technological advancements, and a growing imperative for improved patient outcomes. The market trajectory has been consistently upward, fueled by an increasing incidence of hematopoietic stem cell transplantation (HSCT), the primary context in which GvHD arises. Early in this period, treatment strategies largely relied on broad immunosuppression, primarily corticosteroids, which, while effective in managing acute symptoms, often came with substantial side effects and limited efficacy in chronic or refractory GvHD.
The evolution has been marked by a paradigm shift towards more targeted therapies. The introduction and subsequent refinement of monoclonal antibodies, such as those targeting T-cells or cytokine pathways, have revolutionized GvHD management, offering a more nuanced approach to immune modulation. This has led to improved survival rates and a better quality of life for transplant recipients. The burgeoning field of tyrosine kinase inhibitors has also emerged as a potent weapon against GvHD, particularly in tackling inflammatory cascades and cellular signaling pathways implicated in the disease. These advancements have not only expanded the therapeutic arsenal but have also necessitated a re-evaluation of treatment protocols and patient stratification.
Consumer demands have also played a crucial role in shaping the industry's evolution. Patients and their caregivers are increasingly seeking treatments that offer not only efficacy but also minimize long-term toxicity and improve overall well-being. This has spurred research into therapies with better safety profiles and more personalized treatment approaches. Consequently, the industry has witnessed substantial investment in research and development, with a focus on understanding the intricate mechanisms of GvHD and identifying novel drug targets. Adoption metrics for newer therapies have seen a steady increase, reflecting their growing acceptance by the medical community and their demonstrated clinical benefits. For instance, the adoption rate for novel biologics has risen by an estimated xx% annually between 2020 and 2024, indicating a clear shift away from traditional treatments in specific patient populations. The market growth rate, estimated at xx% CAGR during the forecast period, underscores the industry's robust expansion and its potential to address a significant unmet medical need.
Leading Regions, Countries, or Segments in Graft Versus Host Disease Treatment Industry
The Graft Versus Host Disease (GvHD) treatment market's dominance is multifaceted, with specific segments and regions exhibiting significant growth and influence. Among the disease categories, Acute Graft-versus-Host Disease (aGvHD) currently holds a leading position due to its immediate post-transplant threat and the associated urgency for effective interventions. The development of novel therapies targeting the early inflammatory cascade in aGvHD has been a significant driver. However, Chronic Graft-versus-Host Disease (cGvHD) is rapidly gaining prominence as transplant survival rates improve, leading to a larger population experiencing this debilitating long-term complication.
In terms of product segments, Monoclonal antibodies are emerging as a key growth driver, showcasing remarkable efficacy in both acute and chronic GvHD, particularly in steroid-refractory cases. These biologics offer targeted immunosuppression, minimizing off-target effects and improving patient outcomes. Tyrosine kinase inhibitors are also carving out a significant niche, demonstrating promising results in modulating key signaling pathways involved in GvHD pathogenesis. While Corticosteroids remain a foundational treatment, their limitations in chronic and refractory settings are propelling the growth of newer agents.
From an end-user perspective, Hospital Pharmacies are unequivocally the dominant channel. The critical nature of GvHD management, often requiring intensive care and specialized administration protocols, mandates direct access through hospital settings. This segment accounts for an estimated xx% of all GvHD treatment sales. Online Pharmacies are witnessing a steady rise, driven by the increasing acceptance of telehealth and the convenience they offer for managing chronic conditions and delivering specialized medications. Retail Pharmacies, while currently a smaller segment for GvHD treatments due to the specialized nature of these drugs, are expected to see incremental growth as treatment protocols become more standardized and outpatient management increases.
Geographically, North America, led by the United States, is the leading region, driven by advanced healthcare infrastructure, significant R&D investment, and a high prevalence of HSCT procedures. Europe follows closely, with countries like Germany and the UK showing strong market penetration due to robust healthcare systems and active pharmaceutical research. Asia-Pacific is an emerging market with high growth potential, fueled by increasing access to advanced medical treatments and a growing transplant patient population.
- Dominant Disease Segment: Acute Graft-versus-Host Disease (aGvHD) due to immediate post-transplant threat, with Chronic Graft-versus-Host Disease (cGvHD) experiencing significant growth.
- Key Product Drivers: Monoclonal antibodies and Tyrosine kinase inhibitors are revolutionizing treatment, while Corticosteroids remain foundational.
- Primary End User: Hospital Pharmacies dominate due to the critical care nature of GvHD.
- Emerging End User Channels: Online Pharmacies are gaining traction for convenience and accessibility.
- Leading Geographic Regions: North America (USA) and Europe are key markets, with Asia-Pacific showing high growth potential.
- Investment Trends: Significant R&D investment in novel biologics and targeted therapies.
- Regulatory Support: Approvals for advanced therapies are accelerating market penetration.
Graft Versus Host Disease Treatment Industry Product Innovations
Product innovation in the Graft Versus Host Disease (GvHD) treatment market is primarily focused on developing more targeted and less toxic therapies. advancements include novel monoclonal antibodies that precisely target specific immune cells or inflammatory cytokines responsible for GvHD, offering improved efficacy and reduced side effects compared to broad immunosuppressants. Tyrosine kinase inhibitors are also making strides by inhibiting key signaling pathways that drive GvHD pathogenesis. Furthermore, research into cell-based therapies and gene editing techniques holds promise for future GvHD prevention and treatment. These innovations are driven by a deep understanding of GvHD's complex immunological mechanisms, aiming to achieve superior patient outcomes and a better quality of life.
Propelling Factors for Graft Versus Host Disease Treatment Industry Growth
The Graft Versus Host Disease (GvHD) treatment market's growth is propelled by several key factors. Technologically, advancements in stem cell transplantation techniques have led to a greater number of successful transplants, subsequently increasing the patient population at risk for GvHD. Economically, increased healthcare spending and a growing understanding of GvHD's impact on long-term patient survival and quality of life are driving investment in novel therapies. Regulatory bodies are also playing a crucial role by streamlining approval processes for promising new GvHD treatments, such as the European Commission's approval of Jakavi for specific GvHD patient populations. The ongoing development of targeted therapies like monoclonal antibodies and tyrosine kinase inhibitors, offering improved efficacy and safety profiles, is a significant catalyst.
Obstacles in the Graft Versus Host Disease Treatment Industry Market
Despite promising advancements, the Graft Versus Host Disease (GvHD) treatment market faces several obstacles. Stringent and lengthy regulatory approval pathways for new drugs can delay market entry and increase development costs. The high cost of novel biologic therapies and targeted treatments poses a significant barrier to widespread adoption, especially in resource-limited settings, leading to affordability concerns for patients and healthcare systems. Supply chain disruptions for specialized medications and manufacturing challenges for complex biologics can also impact product availability. Furthermore, the inherent complexity of GvHD, with its diverse clinical presentations and underlying immunological mechanisms, makes it challenging to develop universally effective treatments, leading to significant unmet needs for refractory or severe cases.
Future Opportunities in Graft Versus Host Disease Treatment Industry
The future of the Graft Versus Host Disease (GvHD) treatment industry is rich with opportunity. The increasing success rates and volume of HSCT procedures globally will continue to expand the patient pool requiring GvHD management. Advancements in personalized medicine, including pharmacogenomics and predictive biomarkers, offer the potential for tailoring treatments to individual patient profiles, thereby optimizing efficacy and minimizing adverse events. The exploration of novel therapeutic modalities, such as cell therapies (e.g., CAR-T for GvHD) and ex vivo gene editing techniques, presents groundbreaking avenues for prevention and treatment. Furthermore, emerging markets with growing healthcare infrastructure and increasing access to advanced medical technologies represent significant untapped potential for market expansion.
Major Players in the Graft Versus Host Disease Treatment Industry Ecosystem
Astellas Pharma Inc F Hoffmann-La Roche Ltd (Genentech Inc ) AbbVie Inc Bristol Myers Squibb Company Incyte Corporation Sanofi (Genzyme) Sanofi (Kadmon Pharmaceuticals) Pfizer Inc Novartis AG Equillium Inc.
Key Developments in Graft Versus Host Disease Treatment Industry Industry
- May 2022: Novartis received European Commission (EC) approval for Jakavi (ruxolitinib) for the treatment of patients aged 12 years and older with acute or chronic GvHD who have an inadequate response to corticosteroids or other systemic therapies.
- Mar 2022: Equillium Inc. initiated the EQUATOR study, a pivotal Phase III clinical study of itolizumab in patients with acute graft-versus-host disease (aGvHD). The randomized, double-blind study will assess the efficacy and safety of itolizumab versus placebo as first-line therapy for aGvHD in combination with corticosteroids.
Strategic Graft Versus Host Disease Treatment Industry Market Forecast
The Graft Versus Host Disease (GvHD) treatment market is poised for robust growth, projected to reach xx Million by 2033. This expansion will be fueled by increasing rates of hematopoietic stem cell transplantation, driving demand for effective GvHD management. Innovations in targeted therapies, including monoclonal antibodies and tyrosine kinase inhibitors, are expected to capture significant market share, offering improved efficacy and better safety profiles than conventional treatments. Favorable regulatory landscapes and increased R&D investments, evidenced by recent approvals and ongoing clinical trials, will further accelerate market penetration. The growing emphasis on personalized medicine and the exploration of novel therapeutic avenues will create substantial future opportunities for stakeholders within this critical healthcare sector.
Graft Versus Host Disease Treatment Industry Segmentation
-
1. Disease
- 1.1. Acute Graft-versus-Host Disease
- 1.2. Chronic Graft-versus-Host Disease
-
2. Product
- 2.1. Corticosteroids
- 2.2. Monoclonal antibodies
- 2.3. Tyrosine kinase inhibitors
- 2.4. Other Products
-
3. End User
- 3.1. Hospital Pharmacies
- 3.2. Online Pharmacies
- 3.3. Retail Pharmacies
Graft Versus Host Disease Treatment Industry Segmentation By Geography
-
1. North America
- 1.1. United States
- 1.2. Canada
- 1.3. Mexico
-
2. Europe
- 2.1. Germany
- 2.2. United Kingdom
- 2.3. France
- 2.4. Italy
- 2.5. Spain
- 2.6. Rest of Europe
-
3. Asia Pacific
- 3.1. China
- 3.2. Japan
- 3.3. India
- 3.4. Australia
- 3.5. South Korea
- 3.6. Rest of Asia Pacific
- 4. Rest of the World
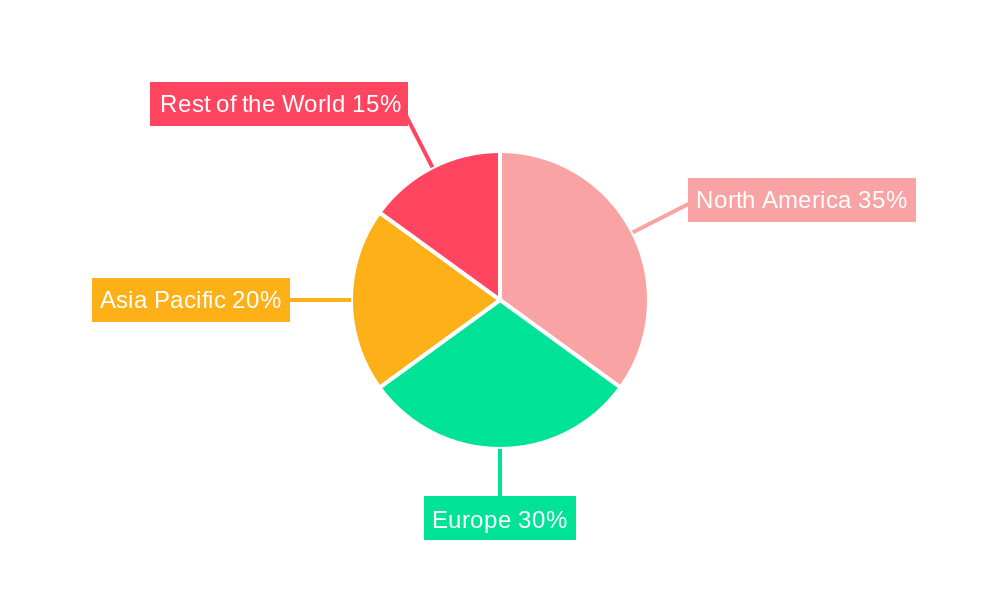
Graft Versus Host Disease Treatment Industry Regional Market Share
Geographic Coverage of Graft Versus Host Disease Treatment Industry
Graft Versus Host Disease Treatment Industry REPORT HIGHLIGHTS
| Aspects | Details |
|---|---|
| Study Period | 2020-2034 |
| Base Year | 2025 |
| Estimated Year | 2026 |
| Forecast Period | 2026-2034 |
| Historical Period | 2020-2025 |
| Growth Rate | CAGR of 7.5% from 2020-2034 |
| Segmentation |
|
Table of Contents
- 1. Introduction
- 1.1. Research Scope
- 1.2. Market Segmentation
- 1.3. Research Objective
- 1.4. Definitions and Assumptions
- 2. Executive Summary
- 2.1. Market Snapshot
- 3. Market Dynamics
- 3.1. Market Drivers
- 3.2. Market Restrains
- 3.3. Market Trends
- 3.4. Market Opportunities
- 4. Market Factor Analysis
- 4.1. Porters Five Forces
- 4.1.1. Bargaining Power of Suppliers
- 4.1.2. Bargaining Power of Buyers
- 4.1.3. Threat of New Entrants
- 4.1.4. Threat of Substitutes
- 4.1.5. Competitive Rivalry
- 4.2. PESTEL analysis
- 4.3. BCG Analysis
- 4.3.1. Stars (High Growth, High Market Share)
- 4.3.2. Cash Cows (Low Growth, High Market Share)
- 4.3.3. Question Mark (High Growth, Low Market Share)
- 4.3.4. Dogs (Low Growth, Low Market Share)
- 4.4. Ansoff Matrix Analysis
- 4.5. Supply Chain Analysis
- 4.6. Regulatory Landscape
- 4.7. Current Market Potential and Opportunity Assessment (TAM–SAM–SOM Framework)
- 4.8. DMV Analyst Note
- 4.1. Porters Five Forces
- 5. Market Analysis, Insights and Forecast 2021-2033
- 5.1. Market Analysis, Insights and Forecast - by Disease
- 5.1.1. Acute Graft-versus-Host Disease
- 5.1.2. Chronic Graft-versus-Host Disease
- 5.2. Market Analysis, Insights and Forecast - by Product
- 5.2.1. Corticosteroids
- 5.2.2. Monoclonal antibodies
- 5.2.3. Tyrosine kinase inhibitors
- 5.2.4. Other Products
- 5.3. Market Analysis, Insights and Forecast - by End User
- 5.3.1. Hospital Pharmacies
- 5.3.2. Online Pharmacies
- 5.3.3. Retail Pharmacies
- 5.4. Market Analysis, Insights and Forecast - by Region
- 5.4.1. North America
- 5.4.2. Europe
- 5.4.3. Asia Pacific
- 5.4.4. Rest of the World
- 5.1. Market Analysis, Insights and Forecast - by Disease
- 6. Global Graft Versus Host Disease Treatment Industry Analysis, Insights and Forecast, 2021-2033
- 6.1. Market Analysis, Insights and Forecast - by Disease
- 6.1.1. Acute Graft-versus-Host Disease
- 6.1.2. Chronic Graft-versus-Host Disease
- 6.2. Market Analysis, Insights and Forecast - by Product
- 6.2.1. Corticosteroids
- 6.2.2. Monoclonal antibodies
- 6.2.3. Tyrosine kinase inhibitors
- 6.2.4. Other Products
- 6.3. Market Analysis, Insights and Forecast - by End User
- 6.3.1. Hospital Pharmacies
- 6.3.2. Online Pharmacies
- 6.3.3. Retail Pharmacies
- 6.1. Market Analysis, Insights and Forecast - by Disease
- 7. North America Graft Versus Host Disease Treatment Industry Analysis, Insights and Forecast, 2020-2032
- 7.1. Market Analysis, Insights and Forecast - by Disease
- 7.1.1. Acute Graft-versus-Host Disease
- 7.1.2. Chronic Graft-versus-Host Disease
- 7.2. Market Analysis, Insights and Forecast - by Product
- 7.2.1. Corticosteroids
- 7.2.2. Monoclonal antibodies
- 7.2.3. Tyrosine kinase inhibitors
- 7.2.4. Other Products
- 7.3. Market Analysis, Insights and Forecast - by End User
- 7.3.1. Hospital Pharmacies
- 7.3.2. Online Pharmacies
- 7.3.3. Retail Pharmacies
- 7.1. Market Analysis, Insights and Forecast - by Disease
- 8. Europe Graft Versus Host Disease Treatment Industry Analysis, Insights and Forecast, 2020-2032
- 8.1. Market Analysis, Insights and Forecast - by Disease
- 8.1.1. Acute Graft-versus-Host Disease
- 8.1.2. Chronic Graft-versus-Host Disease
- 8.2. Market Analysis, Insights and Forecast - by Product
- 8.2.1. Corticosteroids
- 8.2.2. Monoclonal antibodies
- 8.2.3. Tyrosine kinase inhibitors
- 8.2.4. Other Products
- 8.3. Market Analysis, Insights and Forecast - by End User
- 8.3.1. Hospital Pharmacies
- 8.3.2. Online Pharmacies
- 8.3.3. Retail Pharmacies
- 8.1. Market Analysis, Insights and Forecast - by Disease
- 9. Asia Pacific Graft Versus Host Disease Treatment Industry Analysis, Insights and Forecast, 2020-2032
- 9.1. Market Analysis, Insights and Forecast - by Disease
- 9.1.1. Acute Graft-versus-Host Disease
- 9.1.2. Chronic Graft-versus-Host Disease
- 9.2. Market Analysis, Insights and Forecast - by Product
- 9.2.1. Corticosteroids
- 9.2.2. Monoclonal antibodies
- 9.2.3. Tyrosine kinase inhibitors
- 9.2.4. Other Products
- 9.3. Market Analysis, Insights and Forecast - by End User
- 9.3.1. Hospital Pharmacies
- 9.3.2. Online Pharmacies
- 9.3.3. Retail Pharmacies
- 9.1. Market Analysis, Insights and Forecast - by Disease
- 10. Rest of the World Graft Versus Host Disease Treatment Industry Analysis, Insights and Forecast, 2020-2032
- 10.1. Market Analysis, Insights and Forecast - by Disease
- 10.1.1. Acute Graft-versus-Host Disease
- 10.1.2. Chronic Graft-versus-Host Disease
- 10.2. Market Analysis, Insights and Forecast - by Product
- 10.2.1. Corticosteroids
- 10.2.2. Monoclonal antibodies
- 10.2.3. Tyrosine kinase inhibitors
- 10.2.4. Other Products
- 10.3. Market Analysis, Insights and Forecast - by End User
- 10.3.1. Hospital Pharmacies
- 10.3.2. Online Pharmacies
- 10.3.3. Retail Pharmacies
- 10.1. Market Analysis, Insights and Forecast - by Disease
- 11. Competitive Analysis
- 11.1. Company Profiles
- 11.1.1 Astellas Pharma Inc
- 11.1.1.1. Company Overview
- 11.1.1.2. Products
- 11.1.1.3. Company Financials
- 11.1.1.4. SWOT Analysis
- 11.1.2 F Hoffmann-La Roche Ltd (Genentech Inc )
- 11.1.2.1. Company Overview
- 11.1.2.2. Products
- 11.1.2.3. Company Financials
- 11.1.2.4. SWOT Analysis
- 11.1.3 AbbVie Inc
- 11.1.3.1. Company Overview
- 11.1.3.2. Products
- 11.1.3.3. Company Financials
- 11.1.3.4. SWOT Analysis
- 11.1.4 Bristol Myers Squibb Company
- 11.1.4.1. Company Overview
- 11.1.4.2. Products
- 11.1.4.3. Company Financials
- 11.1.4.4. SWOT Analysis
- 11.1.5 Incyte Corporation
- 11.1.5.1. Company Overview
- 11.1.5.2. Products
- 11.1.5.3. Company Financials
- 11.1.5.4. SWOT Analysis
- 11.1.6 Sanofi (Genzyme)
- 11.1.6.1. Company Overview
- 11.1.6.2. Products
- 11.1.6.3. Company Financials
- 11.1.6.4. SWOT Analysis
- 11.1.7 Sanofi (Kadmon Pharmaceuticals)
- 11.1.7.1. Company Overview
- 11.1.7.2. Products
- 11.1.7.3. Company Financials
- 11.1.7.4. SWOT Analysis
- 11.1.8 Pfizer Inc
- 11.1.8.1. Company Overview
- 11.1.8.2. Products
- 11.1.8.3. Company Financials
- 11.1.8.4. SWOT Analysis
- 11.1.1 Astellas Pharma Inc
- 11.2. Market Entropy
- 11.2.1 Company's Key Areas Served
- 11.2.2 Recent Developments
- 11.3. Company Market Share Analysis 2025
- 11.3.1 Top 5 Companies Market Share Analysis
- 11.3.2 Top 3 Companies Market Share Analysis
- 11.4. List of Potential Customers
- 12. Research Methodology
List of Figures
- Figure 1: Global Graft Versus Host Disease Treatment Industry Revenue Breakdown (billion, %) by Region 2025 & 2033
- Figure 2: Global Graft Versus Host Disease Treatment Industry Volume Breakdown (K Unit, %) by Region 2025 & 2033
- Figure 3: North America Graft Versus Host Disease Treatment Industry Revenue (billion), by Disease 2025 & 2033
- Figure 4: North America Graft Versus Host Disease Treatment Industry Volume (K Unit), by Disease 2025 & 2033
- Figure 5: North America Graft Versus Host Disease Treatment Industry Revenue Share (%), by Disease 2025 & 2033
- Figure 6: North America Graft Versus Host Disease Treatment Industry Volume Share (%), by Disease 2025 & 2033
- Figure 7: North America Graft Versus Host Disease Treatment Industry Revenue (billion), by Product 2025 & 2033
- Figure 8: North America Graft Versus Host Disease Treatment Industry Volume (K Unit), by Product 2025 & 2033
- Figure 9: North America Graft Versus Host Disease Treatment Industry Revenue Share (%), by Product 2025 & 2033
- Figure 10: North America Graft Versus Host Disease Treatment Industry Volume Share (%), by Product 2025 & 2033
- Figure 11: North America Graft Versus Host Disease Treatment Industry Revenue (billion), by End User 2025 & 2033
- Figure 12: North America Graft Versus Host Disease Treatment Industry Volume (K Unit), by End User 2025 & 2033
- Figure 13: North America Graft Versus Host Disease Treatment Industry Revenue Share (%), by End User 2025 & 2033
- Figure 14: North America Graft Versus Host Disease Treatment Industry Volume Share (%), by End User 2025 & 2033
- Figure 15: North America Graft Versus Host Disease Treatment Industry Revenue (billion), by Country 2025 & 2033
- Figure 16: North America Graft Versus Host Disease Treatment Industry Volume (K Unit), by Country 2025 & 2033
- Figure 17: North America Graft Versus Host Disease Treatment Industry Revenue Share (%), by Country 2025 & 2033
- Figure 18: North America Graft Versus Host Disease Treatment Industry Volume Share (%), by Country 2025 & 2033
- Figure 19: Europe Graft Versus Host Disease Treatment Industry Revenue (billion), by Disease 2025 & 2033
- Figure 20: Europe Graft Versus Host Disease Treatment Industry Volume (K Unit), by Disease 2025 & 2033
- Figure 21: Europe Graft Versus Host Disease Treatment Industry Revenue Share (%), by Disease 2025 & 2033
- Figure 22: Europe Graft Versus Host Disease Treatment Industry Volume Share (%), by Disease 2025 & 2033
- Figure 23: Europe Graft Versus Host Disease Treatment Industry Revenue (billion), by Product 2025 & 2033
- Figure 24: Europe Graft Versus Host Disease Treatment Industry Volume (K Unit), by Product 2025 & 2033
- Figure 25: Europe Graft Versus Host Disease Treatment Industry Revenue Share (%), by Product 2025 & 2033
- Figure 26: Europe Graft Versus Host Disease Treatment Industry Volume Share (%), by Product 2025 & 2033
- Figure 27: Europe Graft Versus Host Disease Treatment Industry Revenue (billion), by End User 2025 & 2033
- Figure 28: Europe Graft Versus Host Disease Treatment Industry Volume (K Unit), by End User 2025 & 2033
- Figure 29: Europe Graft Versus Host Disease Treatment Industry Revenue Share (%), by End User 2025 & 2033
- Figure 30: Europe Graft Versus Host Disease Treatment Industry Volume Share (%), by End User 2025 & 2033
- Figure 31: Europe Graft Versus Host Disease Treatment Industry Revenue (billion), by Country 2025 & 2033
- Figure 32: Europe Graft Versus Host Disease Treatment Industry Volume (K Unit), by Country 2025 & 2033
- Figure 33: Europe Graft Versus Host Disease Treatment Industry Revenue Share (%), by Country 2025 & 2033
- Figure 34: Europe Graft Versus Host Disease Treatment Industry Volume Share (%), by Country 2025 & 2033
- Figure 35: Asia Pacific Graft Versus Host Disease Treatment Industry Revenue (billion), by Disease 2025 & 2033
- Figure 36: Asia Pacific Graft Versus Host Disease Treatment Industry Volume (K Unit), by Disease 2025 & 2033
- Figure 37: Asia Pacific Graft Versus Host Disease Treatment Industry Revenue Share (%), by Disease 2025 & 2033
- Figure 38: Asia Pacific Graft Versus Host Disease Treatment Industry Volume Share (%), by Disease 2025 & 2033
- Figure 39: Asia Pacific Graft Versus Host Disease Treatment Industry Revenue (billion), by Product 2025 & 2033
- Figure 40: Asia Pacific Graft Versus Host Disease Treatment Industry Volume (K Unit), by Product 2025 & 2033
- Figure 41: Asia Pacific Graft Versus Host Disease Treatment Industry Revenue Share (%), by Product 2025 & 2033
- Figure 42: Asia Pacific Graft Versus Host Disease Treatment Industry Volume Share (%), by Product 2025 & 2033
- Figure 43: Asia Pacific Graft Versus Host Disease Treatment Industry Revenue (billion), by End User 2025 & 2033
- Figure 44: Asia Pacific Graft Versus Host Disease Treatment Industry Volume (K Unit), by End User 2025 & 2033
- Figure 45: Asia Pacific Graft Versus Host Disease Treatment Industry Revenue Share (%), by End User 2025 & 2033
- Figure 46: Asia Pacific Graft Versus Host Disease Treatment Industry Volume Share (%), by End User 2025 & 2033
- Figure 47: Asia Pacific Graft Versus Host Disease Treatment Industry Revenue (billion), by Country 2025 & 2033
- Figure 48: Asia Pacific Graft Versus Host Disease Treatment Industry Volume (K Unit), by Country 2025 & 2033
- Figure 49: Asia Pacific Graft Versus Host Disease Treatment Industry Revenue Share (%), by Country 2025 & 2033
- Figure 50: Asia Pacific Graft Versus Host Disease Treatment Industry Volume Share (%), by Country 2025 & 2033
- Figure 51: Rest of the World Graft Versus Host Disease Treatment Industry Revenue (billion), by Disease 2025 & 2033
- Figure 52: Rest of the World Graft Versus Host Disease Treatment Industry Volume (K Unit), by Disease 2025 & 2033
- Figure 53: Rest of the World Graft Versus Host Disease Treatment Industry Revenue Share (%), by Disease 2025 & 2033
- Figure 54: Rest of the World Graft Versus Host Disease Treatment Industry Volume Share (%), by Disease 2025 & 2033
- Figure 55: Rest of the World Graft Versus Host Disease Treatment Industry Revenue (billion), by Product 2025 & 2033
- Figure 56: Rest of the World Graft Versus Host Disease Treatment Industry Volume (K Unit), by Product 2025 & 2033
- Figure 57: Rest of the World Graft Versus Host Disease Treatment Industry Revenue Share (%), by Product 2025 & 2033
- Figure 58: Rest of the World Graft Versus Host Disease Treatment Industry Volume Share (%), by Product 2025 & 2033
- Figure 59: Rest of the World Graft Versus Host Disease Treatment Industry Revenue (billion), by End User 2025 & 2033
- Figure 60: Rest of the World Graft Versus Host Disease Treatment Industry Volume (K Unit), by End User 2025 & 2033
- Figure 61: Rest of the World Graft Versus Host Disease Treatment Industry Revenue Share (%), by End User 2025 & 2033
- Figure 62: Rest of the World Graft Versus Host Disease Treatment Industry Volume Share (%), by End User 2025 & 2033
- Figure 63: Rest of the World Graft Versus Host Disease Treatment Industry Revenue (billion), by Country 2025 & 2033
- Figure 64: Rest of the World Graft Versus Host Disease Treatment Industry Volume (K Unit), by Country 2025 & 2033
- Figure 65: Rest of the World Graft Versus Host Disease Treatment Industry Revenue Share (%), by Country 2025 & 2033
- Figure 66: Rest of the World Graft Versus Host Disease Treatment Industry Volume Share (%), by Country 2025 & 2033
List of Tables
- Table 1: Global Graft Versus Host Disease Treatment Industry Revenue billion Forecast, by Disease 2020 & 2033
- Table 2: Global Graft Versus Host Disease Treatment Industry Volume K Unit Forecast, by Disease 2020 & 2033
- Table 3: Global Graft Versus Host Disease Treatment Industry Revenue billion Forecast, by Product 2020 & 2033
- Table 4: Global Graft Versus Host Disease Treatment Industry Volume K Unit Forecast, by Product 2020 & 2033
- Table 5: Global Graft Versus Host Disease Treatment Industry Revenue billion Forecast, by End User 2020 & 2033
- Table 6: Global Graft Versus Host Disease Treatment Industry Volume K Unit Forecast, by End User 2020 & 2033
- Table 7: Global Graft Versus Host Disease Treatment Industry Revenue billion Forecast, by Region 2020 & 2033
- Table 8: Global Graft Versus Host Disease Treatment Industry Volume K Unit Forecast, by Region 2020 & 2033
- Table 9: Global Graft Versus Host Disease Treatment Industry Revenue billion Forecast, by Disease 2020 & 2033
- Table 10: Global Graft Versus Host Disease Treatment Industry Volume K Unit Forecast, by Disease 2020 & 2033
- Table 11: Global Graft Versus Host Disease Treatment Industry Revenue billion Forecast, by Product 2020 & 2033
- Table 12: Global Graft Versus Host Disease Treatment Industry Volume K Unit Forecast, by Product 2020 & 2033
- Table 13: Global Graft Versus Host Disease Treatment Industry Revenue billion Forecast, by End User 2020 & 2033
- Table 14: Global Graft Versus Host Disease Treatment Industry Volume K Unit Forecast, by End User 2020 & 2033
- Table 15: Global Graft Versus Host Disease Treatment Industry Revenue billion Forecast, by Country 2020 & 2033
- Table 16: Global Graft Versus Host Disease Treatment Industry Volume K Unit Forecast, by Country 2020 & 2033
- Table 17: United States Graft Versus Host Disease Treatment Industry Revenue (billion) Forecast, by Application 2020 & 2033
- Table 18: United States Graft Versus Host Disease Treatment Industry Volume (K Unit) Forecast, by Application 2020 & 2033
- Table 19: Canada Graft Versus Host Disease Treatment Industry Revenue (billion) Forecast, by Application 2020 & 2033
- Table 20: Canada Graft Versus Host Disease Treatment Industry Volume (K Unit) Forecast, by Application 2020 & 2033
- Table 21: Mexico Graft Versus Host Disease Treatment Industry Revenue (billion) Forecast, by Application 2020 & 2033
- Table 22: Mexico Graft Versus Host Disease Treatment Industry Volume (K Unit) Forecast, by Application 2020 & 2033
- Table 23: Global Graft Versus Host Disease Treatment Industry Revenue billion Forecast, by Disease 2020 & 2033
- Table 24: Global Graft Versus Host Disease Treatment Industry Volume K Unit Forecast, by Disease 2020 & 2033
- Table 25: Global Graft Versus Host Disease Treatment Industry Revenue billion Forecast, by Product 2020 & 2033
- Table 26: Global Graft Versus Host Disease Treatment Industry Volume K Unit Forecast, by Product 2020 & 2033
- Table 27: Global Graft Versus Host Disease Treatment Industry Revenue billion Forecast, by End User 2020 & 2033
- Table 28: Global Graft Versus Host Disease Treatment Industry Volume K Unit Forecast, by End User 2020 & 2033
- Table 29: Global Graft Versus Host Disease Treatment Industry Revenue billion Forecast, by Country 2020 & 2033
- Table 30: Global Graft Versus Host Disease Treatment Industry Volume K Unit Forecast, by Country 2020 & 2033
- Table 31: Germany Graft Versus Host Disease Treatment Industry Revenue (billion) Forecast, by Application 2020 & 2033
- Table 32: Germany Graft Versus Host Disease Treatment Industry Volume (K Unit) Forecast, by Application 2020 & 2033
- Table 33: United Kingdom Graft Versus Host Disease Treatment Industry Revenue (billion) Forecast, by Application 2020 & 2033
- Table 34: United Kingdom Graft Versus Host Disease Treatment Industry Volume (K Unit) Forecast, by Application 2020 & 2033
- Table 35: France Graft Versus Host Disease Treatment Industry Revenue (billion) Forecast, by Application 2020 & 2033
- Table 36: France Graft Versus Host Disease Treatment Industry Volume (K Unit) Forecast, by Application 2020 & 2033
- Table 37: Italy Graft Versus Host Disease Treatment Industry Revenue (billion) Forecast, by Application 2020 & 2033
- Table 38: Italy Graft Versus Host Disease Treatment Industry Volume (K Unit) Forecast, by Application 2020 & 2033
- Table 39: Spain Graft Versus Host Disease Treatment Industry Revenue (billion) Forecast, by Application 2020 & 2033
- Table 40: Spain Graft Versus Host Disease Treatment Industry Volume (K Unit) Forecast, by Application 2020 & 2033
- Table 41: Rest of Europe Graft Versus Host Disease Treatment Industry Revenue (billion) Forecast, by Application 2020 & 2033
- Table 42: Rest of Europe Graft Versus Host Disease Treatment Industry Volume (K Unit) Forecast, by Application 2020 & 2033
- Table 43: Global Graft Versus Host Disease Treatment Industry Revenue billion Forecast, by Disease 2020 & 2033
- Table 44: Global Graft Versus Host Disease Treatment Industry Volume K Unit Forecast, by Disease 2020 & 2033
- Table 45: Global Graft Versus Host Disease Treatment Industry Revenue billion Forecast, by Product 2020 & 2033
- Table 46: Global Graft Versus Host Disease Treatment Industry Volume K Unit Forecast, by Product 2020 & 2033
- Table 47: Global Graft Versus Host Disease Treatment Industry Revenue billion Forecast, by End User 2020 & 2033
- Table 48: Global Graft Versus Host Disease Treatment Industry Volume K Unit Forecast, by End User 2020 & 2033
- Table 49: Global Graft Versus Host Disease Treatment Industry Revenue billion Forecast, by Country 2020 & 2033
- Table 50: Global Graft Versus Host Disease Treatment Industry Volume K Unit Forecast, by Country 2020 & 2033
- Table 51: China Graft Versus Host Disease Treatment Industry Revenue (billion) Forecast, by Application 2020 & 2033
- Table 52: China Graft Versus Host Disease Treatment Industry Volume (K Unit) Forecast, by Application 2020 & 2033
- Table 53: Japan Graft Versus Host Disease Treatment Industry Revenue (billion) Forecast, by Application 2020 & 2033
- Table 54: Japan Graft Versus Host Disease Treatment Industry Volume (K Unit) Forecast, by Application 2020 & 2033
- Table 55: India Graft Versus Host Disease Treatment Industry Revenue (billion) Forecast, by Application 2020 & 2033
- Table 56: India Graft Versus Host Disease Treatment Industry Volume (K Unit) Forecast, by Application 2020 & 2033
- Table 57: Australia Graft Versus Host Disease Treatment Industry Revenue (billion) Forecast, by Application 2020 & 2033
- Table 58: Australia Graft Versus Host Disease Treatment Industry Volume (K Unit) Forecast, by Application 2020 & 2033
- Table 59: South Korea Graft Versus Host Disease Treatment Industry Revenue (billion) Forecast, by Application 2020 & 2033
- Table 60: South Korea Graft Versus Host Disease Treatment Industry Volume (K Unit) Forecast, by Application 2020 & 2033
- Table 61: Rest of Asia Pacific Graft Versus Host Disease Treatment Industry Revenue (billion) Forecast, by Application 2020 & 2033
- Table 62: Rest of Asia Pacific Graft Versus Host Disease Treatment Industry Volume (K Unit) Forecast, by Application 2020 & 2033
- Table 63: Global Graft Versus Host Disease Treatment Industry Revenue billion Forecast, by Disease 2020 & 2033
- Table 64: Global Graft Versus Host Disease Treatment Industry Volume K Unit Forecast, by Disease 2020 & 2033
- Table 65: Global Graft Versus Host Disease Treatment Industry Revenue billion Forecast, by Product 2020 & 2033
- Table 66: Global Graft Versus Host Disease Treatment Industry Volume K Unit Forecast, by Product 2020 & 2033
- Table 67: Global Graft Versus Host Disease Treatment Industry Revenue billion Forecast, by End User 2020 & 2033
- Table 68: Global Graft Versus Host Disease Treatment Industry Volume K Unit Forecast, by End User 2020 & 2033
- Table 69: Global Graft Versus Host Disease Treatment Industry Revenue billion Forecast, by Country 2020 & 2033
- Table 70: Global Graft Versus Host Disease Treatment Industry Volume K Unit Forecast, by Country 2020 & 2033
Frequently Asked Questions
1. What is the projected Compound Annual Growth Rate (CAGR) of the Graft Versus Host Disease Treatment Industry?
The projected CAGR is approximately 7.5%.
2. Which companies are prominent players in the Graft Versus Host Disease Treatment Industry?
Key companies in the market include Astellas Pharma Inc, F Hoffmann-La Roche Ltd (Genentech Inc ), AbbVie Inc, Bristol Myers Squibb Company, Incyte Corporation, Sanofi (Genzyme), Sanofi (Kadmon Pharmaceuticals), Pfizer Inc.
3. What are the main segments of the Graft Versus Host Disease Treatment Industry?
The market segments include Disease, Product, End User.
4. Can you provide details about the market size?
The market size is estimated to be USD 3.07 billion as of 2022.
5. What are some drivers contributing to market growth?
Increasing Rate of Bone Marrow or Hematopoietic Stem Cell Treatment; Increasing Number of Pipeline Drugs.
6. What are the notable trends driving market growth?
Corticosteroids Segment Expected to Witness Notable Growth in the Graft-versus-Host disease treatment Market.
7. Are there any restraints impacting market growth?
High Cost of Graft-Versus-Host Disease Treatment.
8. Can you provide examples of recent developments in the market?
May 2022: Novartis received European Commission (EC) approval for Jakavi (ruxolitinib) for the treatment of patients aged 12 years and older with acute or chronic GvHD who have an inadequate response to corticosteroids or other systemic therapies.
9. What pricing options are available for accessing the report?
Pricing options include single-user, multi-user, and enterprise licenses priced at USD 4750, USD 5250, and USD 8750 respectively.
10. Is the market size provided in terms of value or volume?
The market size is provided in terms of value, measured in billion and volume, measured in K Unit.
11. Are there any specific market keywords associated with the report?
Yes, the market keyword associated with the report is "Graft Versus Host Disease Treatment Industry," which aids in identifying and referencing the specific market segment covered.
12. How do I determine which pricing option suits my needs best?
The pricing options vary based on user requirements and access needs. Individual users may opt for single-user licenses, while businesses requiring broader access may choose multi-user or enterprise licenses for cost-effective access to the report.
13. Are there any additional resources or data provided in the Graft Versus Host Disease Treatment Industry report?
While the report offers comprehensive insights, it's advisable to review the specific contents or supplementary materials provided to ascertain if additional resources or data are available.
14. How can I stay updated on further developments or reports in the Graft Versus Host Disease Treatment Industry?
To stay informed about further developments, trends, and reports in the Graft Versus Host Disease Treatment Industry, consider subscribing to industry newsletters, following relevant companies and organizations, or regularly checking reputable industry news sources and publications.
Methodology
Step 1 - Identification of Relevant Samples Size from Population Database


Step 2 - Approaches for Defining Global Market Size (Value, Volume* & Price*)

Note*: In applicable scenarios
Step 3 - Data Sources
Primary Research
- Web Analytics
- Survey Reports
- Research Institute
- Latest Research Reports
- Opinion Leaders
Secondary Research
- Annual Reports
- White Paper
- Latest Press Release
- Industry Association
- Paid Database
- Investor Presentations

Step 4 - Data Triangulation
Involves using different sources of information in order to increase the validity of a study
These sources are likely to be stakeholders in a program - participants, other researchers, program staff, other community members, and so on.
Then we put all data in single framework & apply various statistical tools to find out the dynamic on the market.
During the analysis stage, feedback from the stakeholder groups would be compared to determine areas of agreement as well as areas of divergence