

Key Insights
The global Laser Therapy market is poised for significant expansion, projected to reach a substantial valuation by 2033. Driven by a robust Compound Annual Growth Rate (CAGR) of 10.31%, this growth trajectory indicates increasing adoption of laser-based treatments across various sectors. The market's current size of USD 240.80 million is expected to multiply considerably over the forecast period, fueled by advancements in laser technology and a growing understanding of its therapeutic benefits. A key driver of this surge is the escalating demand for non-invasive and minimally invasive treatment options, particularly in wound care and pain management. As medical professionals and patients alike seek effective alternatives to traditional methods, laser therapy offers promising solutions with enhanced efficacy and reduced recovery times. Furthermore, the expanding applications in cosmetic procedures, addressing concerns like skin rejuvenation and hair removal, are contributing significantly to market expansion. The integration of advanced laser systems, offering precise targeting and customizable treatment parameters, is also a crucial factor propelling market growth forward.
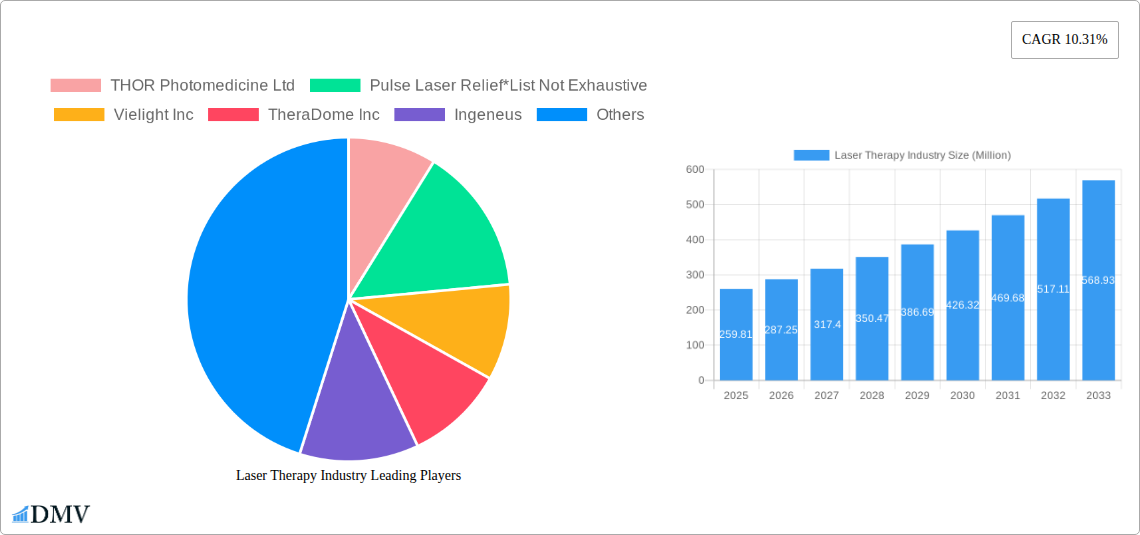
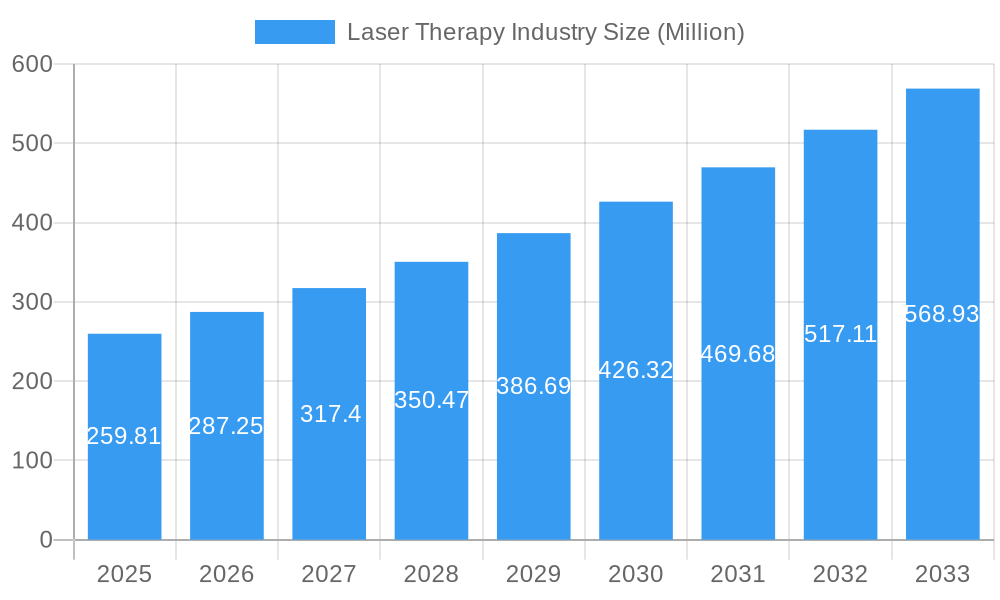
Laser Therapy Industry Market Size (In Million)
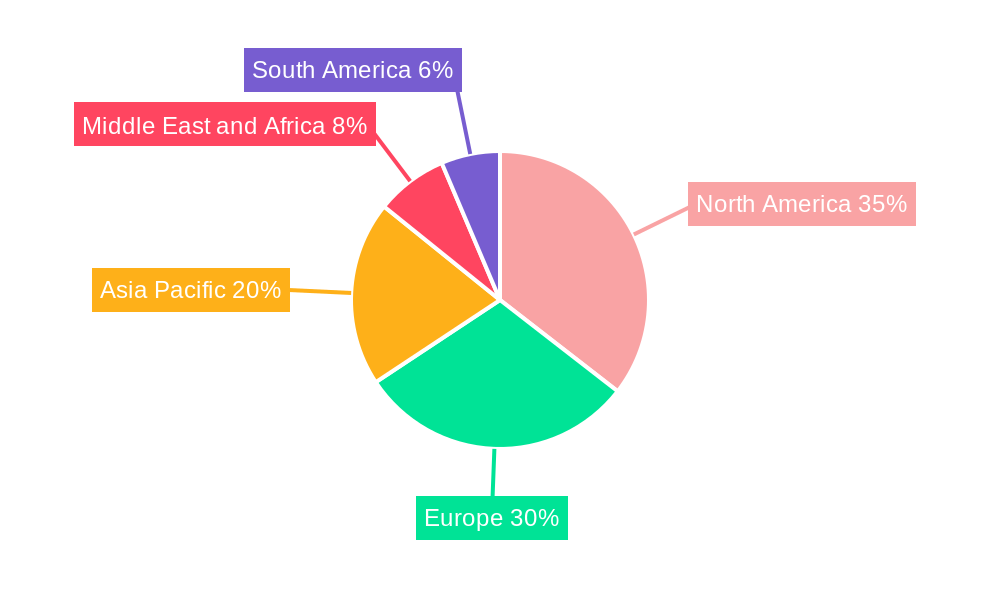
The market segmentation reveals a strong emphasis on innovative applications. Wound care, for instance, is experiencing a notable uptick due to laser therapy's proven ability to accelerate healing and reduce infection rates. Similarly, pain management applications are gaining traction as a safe and effective alternative for chronic pain conditions. While the initial investment in sophisticated laser equipment might present a restraint, the long-term benefits in terms of patient outcomes and healthcare cost reduction are outweighing this challenge. The increasing research and development activities by prominent players like THOR Photomedicine Ltd and Erchonia Corporation are continuously introducing novel laser technologies and expanding the scope of treatable conditions. North America and Europe currently dominate the market, owing to well-established healthcare infrastructures and high adoption rates of advanced medical technologies. However, the Asia Pacific region is anticipated to witness the fastest growth, driven by a burgeoning healthcare sector, increasing disposable incomes, and a growing awareness of laser therapy's potential.
Laser Therapy Industry Company Market Share
Dive deep into the burgeoning Laser Therapy Industry Market, a sector poised for significant expansion driven by advancements in medical technology and increasing patient demand for non-invasive treatments. This report provides an in-depth analysis of market dynamics, from historical performance to future projections, offering actionable insights for stakeholders navigating this dynamic landscape. Covering a comprehensive study period of 2019–2033, with a base year of 2025, and a forecast period extending from 2025–2033, this report leverages data from 2019–2024 to paint a complete picture. Explore the potential of photomedicine, LLLT (Low-Level Laser Therapy), red light therapy, and infrared therapy in transforming healthcare and wellness.
Laser Therapy Industry Market Composition & Trends
The Laser Therapy Industry Market exhibits a moderately concentrated structure, with key players investing heavily in research and development to drive innovation. THOR Photomedicine Ltd, Vielight Inc, and TheraDome Inc are among the prominent entities shaping market trends. The market is propelled by a surge in demand for pain management and wound care applications, further amplified by the growing adoption of cosmetic applications of laser therapy. Regulatory landscapes are evolving, with increasing approvals for new therapeutic devices, while substitute products, though present, often lack the targeted efficacy of laser-based solutions. End-user profiles are diversifying, encompassing not only specialized clinics but also growing interest from research institutions and even direct-to-consumer markets. Mergers and acquisitions are a key feature, with deal values reaching hundreds of millions, indicating strategic consolidation and expansion efforts. For instance, recent M&A activities have been valued in the range of 150 Million to 300 Million. Market share distribution is influenced by the strength of product portfolios and geographic reach, with leading companies holding significant sway. Understanding these dynamics is crucial for strategic planning and investment.
Laser Therapy Industry Industry Evolution
The Laser Therapy Industry has undergone a remarkable evolution, transforming from niche applications to a mainstream therapeutic modality. Over the historical period (2019–2024), the market witnessed a compound annual growth rate (CAGR) of approximately 7.5%, fueled by increasing clinical validation and a growing body of scientific evidence supporting the efficacy of laser therapy across various medical disciplines. Technological advancements have been a primary catalyst, with the development of more precise, portable, and user-friendly laser devices. Innovations in wavelength type, particularly the widespread adoption of infrared light and red light, have expanded the therapeutic potential for applications like wound care and pain management. Shifting consumer demands, driven by a preference for non-pharmacological and non-invasive treatment options, have further accelerated market growth. The estimated year (2025) is projected to see the market reach a valuation of 10 Billion, with further expansion anticipated throughout the forecast period (2025–2033), reaching an estimated 20 Billion by 2033. Adoption metrics show a steady increase, with specialty clinics and research institutes leading the charge, while the integration into broader healthcare settings continues to expand. The focus on evidence-based medicine and the pursuit of innovative therapeutic solutions will continue to shape the industry's trajectory.
Leading Regions, Countries, or Segments in Laser Therapy Industry
North America currently leads the Laser Therapy Industry due to robust healthcare infrastructure, significant R&D investments, and a high prevalence of chronic conditions necessitating advanced therapeutic solutions. The Application segment of Pain Management is dominant, driven by the aging population and the rising incidence of musculoskeletal disorders.
- Key Drivers in North America:
- High Investment Trends: Substantial venture capital funding and government grants for medical device innovation.
- Regulatory Support: Favorable regulatory pathways for laser therapy devices from agencies like the FDA.
- Technological Adoption: Early and widespread adoption of new medical technologies.
- Insurance Reimbursement: Growing coverage for laser therapy procedures in health insurance plans.
The Wavelength Type of Infrared Light is particularly influential, owing to its deep tissue penetration capabilities, making it highly effective for treating deeper ailments. Red Light also holds a significant share due to its surface-level applications in skin rejuvenation and wound healing.
- Dominance Factors in Pain Management:
- Non-Opioid Alternative: Laser therapy offers a viable non-addictive alternative to opioid analgesics, addressing the global opioid crisis.
- Chronic Condition Management: Effective in managing chronic pain associated with conditions like arthritis, back pain, and neuropathies.
- Reduced Recovery Times: Facilitates faster healing and reduced post-operative pain for various surgical interventions.
The End-User segment of Specialty Clinics, including physiotherapy, pain management, and dermatology clinics, represents the largest market share. However, Research Institutes are increasingly driving innovation and clinical validation, contributing to the segment's growth. The market is projected to experience a CAGR of 8.2% from 2025 to 2033, with a global market size estimated at 12 Billion in 2025, growing to 22 Billion by 2033. Other regions like Europe and Asia-Pacific are also exhibiting strong growth potential due to increasing healthcare expenditure and a growing awareness of laser therapy's benefits.
Laser Therapy Industry Product Innovations
Product innovations in the Laser Therapy Industry are focused on enhancing therapeutic efficacy, patient comfort, and ease of use. Companies are developing advanced devices utilizing specific wavelength types, such as targeted infrared light for deep tissue regeneration and red light for superficial wound healing and cosmetic rejuvenation. Innovations include portable, handheld devices for home use, significantly expanding accessibility for pain management and cosmetic applications. For example, advanced LLLT devices now offer customizable treatment protocols and integrated feedback mechanisms, optimizing patient outcomes. These advancements contribute to faster healing times, reduced inflammation, and improved pain relief, with performance metrics demonstrating up to a 40% improvement in healing rates for certain wound care applications.
Propelling Factors for Laser Therapy Industry Growth
Several key factors are propelling the Laser Therapy Industry forward. Technological advancements, such as miniaturization of devices and improved energy efficiency, are making laser therapy more accessible and affordable. The growing demand for non-invasive and non-pharmacological treatment options, particularly for chronic pain and various cosmetic concerns, is a significant driver. Furthermore, increasing regulatory approvals for new laser therapy applications and devices, coupled with favorable reimbursement policies in various healthcare systems, are boosting market adoption. Investment in research and development by leading companies is continuously expanding the therapeutic scope of laser technology.
Obstacles in the Laser Therapy Industry Market
Despite its promising growth, the Laser Therapy Industry faces certain obstacles. Regulatory hurdles and the need for extensive clinical trials to gain approval for new indications can be time-consuming and expensive. Supply chain disruptions, particularly for specialized components, can impact manufacturing and availability. Intense competition among established players and emerging manufacturers also presents a challenge. Additionally, a lack of widespread awareness and understanding of laser therapy among the general public and some healthcare professionals can hinder adoption. The cost of advanced laser therapy equipment can also be a barrier for smaller clinics and individual practitioners.
Future Opportunities in Laser Therapy Industry
The Laser Therapy Industry is ripe with future opportunities. The expanding applications in areas like neurology, dermatology, and oncology present significant growth potential. The development of AI-integrated laser therapy systems promises personalized treatment plans and enhanced efficacy. Growth in emerging markets, particularly in Asia-Pacific and Latin America, offers substantial untapped potential. Furthermore, the increasing consumer interest in aesthetic treatments and preventative healthcare will continue to drive demand for cosmetic laser applications. The integration of laser therapy into wearable devices for continuous monitoring and treatment also represents an exciting frontier.
Major Players in the Laser Therapy Industry Ecosystem
- THOR Photomedicine Ltd
- Pulse Laser Relief
- Vielight Inc
- TheraDome Inc
- Ingeneus
- BIOFLEX
- HairMax
- LumiWave
- Omega Laser Systems
- iGrow Laser
- Erchonia Corporation
- BioLight Technologies LLC
Key Developments in Laser Therapy Industry Industry
- 2023 December: Launch of a new generation of multi-wavelength therapeutic lasers by THOR Photomedicine Ltd, enhancing treatment versatility.
- 2024 February: Vielight Inc announces successful clinical trial results for its intranasal red light therapy device in cognitive health applications.
- 2024 April: TheraDome Inc receives FDA clearance for its new, enhanced red light therapy helmet for home use.
- 2024 June: Erchonia Corporation expands its product line with a new laser system for advanced pain management therapies.
- 2024 August: Ingeneus secures significant funding to accelerate the development of its novel laser-based wound healing technology.
- 2024 October: BioFlex announces strategic partnerships to increase the global distribution of its therapeutic laser systems.
Strategic Laser Therapy Industry Market Forecast
The Laser Therapy Industry is set for sustained and robust growth, driven by a confluence of technological innovation, expanding therapeutic applications, and increasing consumer and healthcare provider acceptance. The shift towards non-invasive and evidence-based treatments, particularly in pain management and wound care, will continue to be a primary growth catalyst. Emerging applications in cosmetic procedures and aesthetic wellness will further bolster market expansion. Strategic investments in R&D and market penetration in developing economies are expected to unlock significant future potential, positioning the laser therapy market as a pivotal force in the future of healthcare. The market is projected to achieve a valuation of over 20 Billion by 2033.
Laser Therapy Industry Segmentation
-
1. Application
- 1.1. Wound Care
- 1.2. Pain Management
- 1.3. Cosmetic Application
- 1.4. Other Applications
-
2. Wavelength Type
- 2.1. Infrared Light
- 2.2. Red Light
- 2.3. Other Wavelength Types
-
3. End-User
- 3.1. Specialty Clinics
- 3.2. Research Institutes
- 3.3. Other End-Users
Laser Therapy Industry Segmentation By Geography
-
1. North America
- 1.1. United States
- 1.2. Canada
- 1.3. Mexico
-
2. Europe
- 2.1. Germany
- 2.2. United Kingdom
- 2.3. France
- 2.4. Italy
- 2.5. Spain
- 2.6. Rest of Europe
-
3. Asia Pacific
- 3.1. China
- 3.2. Japan
- 3.3. India
- 3.4. Australia
- 3.5. South Korea
- 3.6. Rest of Asia Pacific
-
4. Middle East and Africa
- 4.1. GCC
- 4.2. South Africa
- 4.3. Rest of Middle East and Africa
-
5. South America
- 5.1. Brazil
- 5.2. Argentina
- 5.3. Rest of South America
Laser Therapy Industry Regional Market Share
Geographic Coverage of Laser Therapy Industry
Laser Therapy Industry REPORT HIGHLIGHTS
| Aspects | Details |
|---|---|
| Study Period | 2020-2034 |
| Base Year | 2025 |
| Estimated Year | 2026 |
| Forecast Period | 2026-2034 |
| Historical Period | 2020-2025 |
| Growth Rate | CAGR of 10.31% from 2020-2034 |
| Segmentation |
|
Table of Contents
- 1. Introduction
- 1.1. Research Scope
- 1.2. Market Segmentation
- 1.3. Research Methodology
- 1.4. Definitions and Assumptions
- 2. Executive Summary
- 2.1. Introduction
- 3. Market Dynamics
- 3.1. Introduction
- 3.2. Market Drivers
- 3.2.1. Rising Incidence of Osteoporosis and Arthritis; Rising Demand for Non-Invasive Treatments
- 3.3. Market Restrains
- 3.3.1. Availability of Alternative Treatments
- 3.4. Market Trends
- 3.4.1. Pain Management is Expected to Hold the Major Market Share in the Market Over the Forecast Period
- 4. Market Factor Analysis
- 4.1. Porters Five Forces
- 4.2. Supply/Value Chain
- 4.3. PESTEL analysis
- 4.4. Market Entropy
- 4.5. Patent/Trademark Analysis
- 5. Global Laser Therapy Industry Analysis, Insights and Forecast, 2020-2032
- 5.1. Market Analysis, Insights and Forecast - by Application
- 5.1.1. Wound Care
- 5.1.2. Pain Management
- 5.1.3. Cosmetic Application
- 5.1.4. Other Applications
- 5.2. Market Analysis, Insights and Forecast - by Wavelength Type
- 5.2.1. Infrared Light
- 5.2.2. Red Light
- 5.2.3. Other Wavelength Types
- 5.3. Market Analysis, Insights and Forecast - by End-User
- 5.3.1. Specialty Clinics
- 5.3.2. Research Institutes
- 5.3.3. Other End-Users
- 5.4. Market Analysis, Insights and Forecast - by Region
- 5.4.1. North America
- 5.4.2. Europe
- 5.4.3. Asia Pacific
- 5.4.4. Middle East and Africa
- 5.4.5. South America
- 5.1. Market Analysis, Insights and Forecast - by Application
- 6. North America Laser Therapy Industry Analysis, Insights and Forecast, 2020-2032
- 6.1. Market Analysis, Insights and Forecast - by Application
- 6.1.1. Wound Care
- 6.1.2. Pain Management
- 6.1.3. Cosmetic Application
- 6.1.4. Other Applications
- 6.2. Market Analysis, Insights and Forecast - by Wavelength Type
- 6.2.1. Infrared Light
- 6.2.2. Red Light
- 6.2.3. Other Wavelength Types
- 6.3. Market Analysis, Insights and Forecast - by End-User
- 6.3.1. Specialty Clinics
- 6.3.2. Research Institutes
- 6.3.3. Other End-Users
- 6.1. Market Analysis, Insights and Forecast - by Application
- 7. Europe Laser Therapy Industry Analysis, Insights and Forecast, 2020-2032
- 7.1. Market Analysis, Insights and Forecast - by Application
- 7.1.1. Wound Care
- 7.1.2. Pain Management
- 7.1.3. Cosmetic Application
- 7.1.4. Other Applications
- 7.2. Market Analysis, Insights and Forecast - by Wavelength Type
- 7.2.1. Infrared Light
- 7.2.2. Red Light
- 7.2.3. Other Wavelength Types
- 7.3. Market Analysis, Insights and Forecast - by End-User
- 7.3.1. Specialty Clinics
- 7.3.2. Research Institutes
- 7.3.3. Other End-Users
- 7.1. Market Analysis, Insights and Forecast - by Application
- 8. Asia Pacific Laser Therapy Industry Analysis, Insights and Forecast, 2020-2032
- 8.1. Market Analysis, Insights and Forecast - by Application
- 8.1.1. Wound Care
- 8.1.2. Pain Management
- 8.1.3. Cosmetic Application
- 8.1.4. Other Applications
- 8.2. Market Analysis, Insights and Forecast - by Wavelength Type
- 8.2.1. Infrared Light
- 8.2.2. Red Light
- 8.2.3. Other Wavelength Types
- 8.3. Market Analysis, Insights and Forecast - by End-User
- 8.3.1. Specialty Clinics
- 8.3.2. Research Institutes
- 8.3.3. Other End-Users
- 8.1. Market Analysis, Insights and Forecast - by Application
- 9. Middle East and Africa Laser Therapy Industry Analysis, Insights and Forecast, 2020-2032
- 9.1. Market Analysis, Insights and Forecast - by Application
- 9.1.1. Wound Care
- 9.1.2. Pain Management
- 9.1.3. Cosmetic Application
- 9.1.4. Other Applications
- 9.2. Market Analysis, Insights and Forecast - by Wavelength Type
- 9.2.1. Infrared Light
- 9.2.2. Red Light
- 9.2.3. Other Wavelength Types
- 9.3. Market Analysis, Insights and Forecast - by End-User
- 9.3.1. Specialty Clinics
- 9.3.2. Research Institutes
- 9.3.3. Other End-Users
- 9.1. Market Analysis, Insights and Forecast - by Application
- 10. South America Laser Therapy Industry Analysis, Insights and Forecast, 2020-2032
- 10.1. Market Analysis, Insights and Forecast - by Application
- 10.1.1. Wound Care
- 10.1.2. Pain Management
- 10.1.3. Cosmetic Application
- 10.1.4. Other Applications
- 10.2. Market Analysis, Insights and Forecast - by Wavelength Type
- 10.2.1. Infrared Light
- 10.2.2. Red Light
- 10.2.3. Other Wavelength Types
- 10.3. Market Analysis, Insights and Forecast - by End-User
- 10.3.1. Specialty Clinics
- 10.3.2. Research Institutes
- 10.3.3. Other End-Users
- 10.1. Market Analysis, Insights and Forecast - by Application
- 11. Competitive Analysis
- 11.1. Global Market Share Analysis 2025
- 11.2. Company Profiles
- 11.2.1 THOR Photomedicine Ltd
- 11.2.1.1. Overview
- 11.2.1.2. Products
- 11.2.1.3. SWOT Analysis
- 11.2.1.4. Recent Developments
- 11.2.1.5. Financials (Based on Availability)
- 11.2.2 Pulse Laser Relief*List Not Exhaustive
- 11.2.2.1. Overview
- 11.2.2.2. Products
- 11.2.2.3. SWOT Analysis
- 11.2.2.4. Recent Developments
- 11.2.2.5. Financials (Based on Availability)
- 11.2.3 Vielight Inc
- 11.2.3.1. Overview
- 11.2.3.2. Products
- 11.2.3.3. SWOT Analysis
- 11.2.3.4. Recent Developments
- 11.2.3.5. Financials (Based on Availability)
- 11.2.4 TheraDome Inc
- 11.2.4.1. Overview
- 11.2.4.2. Products
- 11.2.4.3. SWOT Analysis
- 11.2.4.4. Recent Developments
- 11.2.4.5. Financials (Based on Availability)
- 11.2.5 Ingeneus
- 11.2.5.1. Overview
- 11.2.5.2. Products
- 11.2.5.3. SWOT Analysis
- 11.2.5.4. Recent Developments
- 11.2.5.5. Financials (Based on Availability)
- 11.2.6 BIOFLEX
- 11.2.6.1. Overview
- 11.2.6.2. Products
- 11.2.6.3. SWOT Analysis
- 11.2.6.4. Recent Developments
- 11.2.6.5. Financials (Based on Availability)
- 11.2.7 HairMax
- 11.2.7.1. Overview
- 11.2.7.2. Products
- 11.2.7.3. SWOT Analysis
- 11.2.7.4. Recent Developments
- 11.2.7.5. Financials (Based on Availability)
- 11.2.8 LumiWave
- 11.2.8.1. Overview
- 11.2.8.2. Products
- 11.2.8.3. SWOT Analysis
- 11.2.8.4. Recent Developments
- 11.2.8.5. Financials (Based on Availability)
- 11.2.9 Omega Laser Systems
- 11.2.9.1. Overview
- 11.2.9.2. Products
- 11.2.9.3. SWOT Analysis
- 11.2.9.4. Recent Developments
- 11.2.9.5. Financials (Based on Availability)
- 11.2.10 iGrow Laser
- 11.2.10.1. Overview
- 11.2.10.2. Products
- 11.2.10.3. SWOT Analysis
- 11.2.10.4. Recent Developments
- 11.2.10.5. Financials (Based on Availability)
- 11.2.11 Erchonia Corporation
- 11.2.11.1. Overview
- 11.2.11.2. Products
- 11.2.11.3. SWOT Analysis
- 11.2.11.4. Recent Developments
- 11.2.11.5. Financials (Based on Availability)
- 11.2.12 BioLight Technologies LLC
- 11.2.12.1. Overview
- 11.2.12.2. Products
- 11.2.12.3. SWOT Analysis
- 11.2.12.4. Recent Developments
- 11.2.12.5. Financials (Based on Availability)
- 11.2.1 THOR Photomedicine Ltd
List of Figures
- Figure 1: Global Laser Therapy Industry Revenue Breakdown (Million, %) by Region 2025 & 2033
- Figure 2: North America Laser Therapy Industry Revenue (Million), by Application 2025 & 2033
- Figure 3: North America Laser Therapy Industry Revenue Share (%), by Application 2025 & 2033
- Figure 4: North America Laser Therapy Industry Revenue (Million), by Wavelength Type 2025 & 2033
- Figure 5: North America Laser Therapy Industry Revenue Share (%), by Wavelength Type 2025 & 2033
- Figure 6: North America Laser Therapy Industry Revenue (Million), by End-User 2025 & 2033
- Figure 7: North America Laser Therapy Industry Revenue Share (%), by End-User 2025 & 2033
- Figure 8: North America Laser Therapy Industry Revenue (Million), by Country 2025 & 2033
- Figure 9: North America Laser Therapy Industry Revenue Share (%), by Country 2025 & 2033
- Figure 10: Europe Laser Therapy Industry Revenue (Million), by Application 2025 & 2033
- Figure 11: Europe Laser Therapy Industry Revenue Share (%), by Application 2025 & 2033
- Figure 12: Europe Laser Therapy Industry Revenue (Million), by Wavelength Type 2025 & 2033
- Figure 13: Europe Laser Therapy Industry Revenue Share (%), by Wavelength Type 2025 & 2033
- Figure 14: Europe Laser Therapy Industry Revenue (Million), by End-User 2025 & 2033
- Figure 15: Europe Laser Therapy Industry Revenue Share (%), by End-User 2025 & 2033
- Figure 16: Europe Laser Therapy Industry Revenue (Million), by Country 2025 & 2033
- Figure 17: Europe Laser Therapy Industry Revenue Share (%), by Country 2025 & 2033
- Figure 18: Asia Pacific Laser Therapy Industry Revenue (Million), by Application 2025 & 2033
- Figure 19: Asia Pacific Laser Therapy Industry Revenue Share (%), by Application 2025 & 2033
- Figure 20: Asia Pacific Laser Therapy Industry Revenue (Million), by Wavelength Type 2025 & 2033
- Figure 21: Asia Pacific Laser Therapy Industry Revenue Share (%), by Wavelength Type 2025 & 2033
- Figure 22: Asia Pacific Laser Therapy Industry Revenue (Million), by End-User 2025 & 2033
- Figure 23: Asia Pacific Laser Therapy Industry Revenue Share (%), by End-User 2025 & 2033
- Figure 24: Asia Pacific Laser Therapy Industry Revenue (Million), by Country 2025 & 2033
- Figure 25: Asia Pacific Laser Therapy Industry Revenue Share (%), by Country 2025 & 2033
- Figure 26: Middle East and Africa Laser Therapy Industry Revenue (Million), by Application 2025 & 2033
- Figure 27: Middle East and Africa Laser Therapy Industry Revenue Share (%), by Application 2025 & 2033
- Figure 28: Middle East and Africa Laser Therapy Industry Revenue (Million), by Wavelength Type 2025 & 2033
- Figure 29: Middle East and Africa Laser Therapy Industry Revenue Share (%), by Wavelength Type 2025 & 2033
- Figure 30: Middle East and Africa Laser Therapy Industry Revenue (Million), by End-User 2025 & 2033
- Figure 31: Middle East and Africa Laser Therapy Industry Revenue Share (%), by End-User 2025 & 2033
- Figure 32: Middle East and Africa Laser Therapy Industry Revenue (Million), by Country 2025 & 2033
- Figure 33: Middle East and Africa Laser Therapy Industry Revenue Share (%), by Country 2025 & 2033
- Figure 34: South America Laser Therapy Industry Revenue (Million), by Application 2025 & 2033
- Figure 35: South America Laser Therapy Industry Revenue Share (%), by Application 2025 & 2033
- Figure 36: South America Laser Therapy Industry Revenue (Million), by Wavelength Type 2025 & 2033
- Figure 37: South America Laser Therapy Industry Revenue Share (%), by Wavelength Type 2025 & 2033
- Figure 38: South America Laser Therapy Industry Revenue (Million), by End-User 2025 & 2033
- Figure 39: South America Laser Therapy Industry Revenue Share (%), by End-User 2025 & 2033
- Figure 40: South America Laser Therapy Industry Revenue (Million), by Country 2025 & 2033
- Figure 41: South America Laser Therapy Industry Revenue Share (%), by Country 2025 & 2033
List of Tables
- Table 1: Global Laser Therapy Industry Revenue Million Forecast, by Application 2020 & 2033
- Table 2: Global Laser Therapy Industry Revenue Million Forecast, by Wavelength Type 2020 & 2033
- Table 3: Global Laser Therapy Industry Revenue Million Forecast, by End-User 2020 & 2033
- Table 4: Global Laser Therapy Industry Revenue Million Forecast, by Region 2020 & 2033
- Table 5: Global Laser Therapy Industry Revenue Million Forecast, by Application 2020 & 2033
- Table 6: Global Laser Therapy Industry Revenue Million Forecast, by Wavelength Type 2020 & 2033
- Table 7: Global Laser Therapy Industry Revenue Million Forecast, by End-User 2020 & 2033
- Table 8: Global Laser Therapy Industry Revenue Million Forecast, by Country 2020 & 2033
- Table 9: United States Laser Therapy Industry Revenue (Million) Forecast, by Application 2020 & 2033
- Table 10: Canada Laser Therapy Industry Revenue (Million) Forecast, by Application 2020 & 2033
- Table 11: Mexico Laser Therapy Industry Revenue (Million) Forecast, by Application 2020 & 2033
- Table 12: Global Laser Therapy Industry Revenue Million Forecast, by Application 2020 & 2033
- Table 13: Global Laser Therapy Industry Revenue Million Forecast, by Wavelength Type 2020 & 2033
- Table 14: Global Laser Therapy Industry Revenue Million Forecast, by End-User 2020 & 2033
- Table 15: Global Laser Therapy Industry Revenue Million Forecast, by Country 2020 & 2033
- Table 16: Germany Laser Therapy Industry Revenue (Million) Forecast, by Application 2020 & 2033
- Table 17: United Kingdom Laser Therapy Industry Revenue (Million) Forecast, by Application 2020 & 2033
- Table 18: France Laser Therapy Industry Revenue (Million) Forecast, by Application 2020 & 2033
- Table 19: Italy Laser Therapy Industry Revenue (Million) Forecast, by Application 2020 & 2033
- Table 20: Spain Laser Therapy Industry Revenue (Million) Forecast, by Application 2020 & 2033
- Table 21: Rest of Europe Laser Therapy Industry Revenue (Million) Forecast, by Application 2020 & 2033
- Table 22: Global Laser Therapy Industry Revenue Million Forecast, by Application 2020 & 2033
- Table 23: Global Laser Therapy Industry Revenue Million Forecast, by Wavelength Type 2020 & 2033
- Table 24: Global Laser Therapy Industry Revenue Million Forecast, by End-User 2020 & 2033
- Table 25: Global Laser Therapy Industry Revenue Million Forecast, by Country 2020 & 2033
- Table 26: China Laser Therapy Industry Revenue (Million) Forecast, by Application 2020 & 2033
- Table 27: Japan Laser Therapy Industry Revenue (Million) Forecast, by Application 2020 & 2033
- Table 28: India Laser Therapy Industry Revenue (Million) Forecast, by Application 2020 & 2033
- Table 29: Australia Laser Therapy Industry Revenue (Million) Forecast, by Application 2020 & 2033
- Table 30: South Korea Laser Therapy Industry Revenue (Million) Forecast, by Application 2020 & 2033
- Table 31: Rest of Asia Pacific Laser Therapy Industry Revenue (Million) Forecast, by Application 2020 & 2033
- Table 32: Global Laser Therapy Industry Revenue Million Forecast, by Application 2020 & 2033
- Table 33: Global Laser Therapy Industry Revenue Million Forecast, by Wavelength Type 2020 & 2033
- Table 34: Global Laser Therapy Industry Revenue Million Forecast, by End-User 2020 & 2033
- Table 35: Global Laser Therapy Industry Revenue Million Forecast, by Country 2020 & 2033
- Table 36: GCC Laser Therapy Industry Revenue (Million) Forecast, by Application 2020 & 2033
- Table 37: South Africa Laser Therapy Industry Revenue (Million) Forecast, by Application 2020 & 2033
- Table 38: Rest of Middle East and Africa Laser Therapy Industry Revenue (Million) Forecast, by Application 2020 & 2033
- Table 39: Global Laser Therapy Industry Revenue Million Forecast, by Application 2020 & 2033
- Table 40: Global Laser Therapy Industry Revenue Million Forecast, by Wavelength Type 2020 & 2033
- Table 41: Global Laser Therapy Industry Revenue Million Forecast, by End-User 2020 & 2033
- Table 42: Global Laser Therapy Industry Revenue Million Forecast, by Country 2020 & 2033
- Table 43: Brazil Laser Therapy Industry Revenue (Million) Forecast, by Application 2020 & 2033
- Table 44: Argentina Laser Therapy Industry Revenue (Million) Forecast, by Application 2020 & 2033
- Table 45: Rest of South America Laser Therapy Industry Revenue (Million) Forecast, by Application 2020 & 2033
Frequently Asked Questions
1. What is the projected Compound Annual Growth Rate (CAGR) of the Laser Therapy Industry?
The projected CAGR is approximately 10.31%.
2. Which companies are prominent players in the Laser Therapy Industry?
Key companies in the market include THOR Photomedicine Ltd, Pulse Laser Relief*List Not Exhaustive, Vielight Inc, TheraDome Inc, Ingeneus, BIOFLEX, HairMax, LumiWave, Omega Laser Systems, iGrow Laser, Erchonia Corporation, BioLight Technologies LLC.
3. What are the main segments of the Laser Therapy Industry?
The market segments include Application, Wavelength Type, End-User.
4. Can you provide details about the market size?
The market size is estimated to be USD 240.80 Million as of 2022.
5. What are some drivers contributing to market growth?
Rising Incidence of Osteoporosis and Arthritis; Rising Demand for Non-Invasive Treatments.
6. What are the notable trends driving market growth?
Pain Management is Expected to Hold the Major Market Share in the Market Over the Forecast Period.
7. Are there any restraints impacting market growth?
Availability of Alternative Treatments.
8. Can you provide examples of recent developments in the market?
N/A
9. What pricing options are available for accessing the report?
Pricing options include single-user, multi-user, and enterprise licenses priced at USD 4750, USD 5250, and USD 8750 respectively.
10. Is the market size provided in terms of value or volume?
The market size is provided in terms of value, measured in Million.
11. Are there any specific market keywords associated with the report?
Yes, the market keyword associated with the report is "Laser Therapy Industry," which aids in identifying and referencing the specific market segment covered.
12. How do I determine which pricing option suits my needs best?
The pricing options vary based on user requirements and access needs. Individual users may opt for single-user licenses, while businesses requiring broader access may choose multi-user or enterprise licenses for cost-effective access to the report.
13. Are there any additional resources or data provided in the Laser Therapy Industry report?
While the report offers comprehensive insights, it's advisable to review the specific contents or supplementary materials provided to ascertain if additional resources or data are available.
14. How can I stay updated on further developments or reports in the Laser Therapy Industry?
To stay informed about further developments, trends, and reports in the Laser Therapy Industry, consider subscribing to industry newsletters, following relevant companies and organizations, or regularly checking reputable industry news sources and publications.
Methodology
Step 1 - Identification of Relevant Samples Size from Population Database


Step 2 - Approaches for Defining Global Market Size (Value, Volume* & Price*)

Note*: In applicable scenarios
Step 3 - Data Sources
Primary Research
- Web Analytics
- Survey Reports
- Research Institute
- Latest Research Reports
- Opinion Leaders
Secondary Research
- Annual Reports
- White Paper
- Latest Press Release
- Industry Association
- Paid Database
- Investor Presentations

Step 4 - Data Triangulation
Involves using different sources of information in order to increase the validity of a study
These sources are likely to be stakeholders in a program - participants, other researchers, program staff, other community members, and so on.
Then we put all data in single framework & apply various statistical tools to find out the dynamic on the market.
During the analysis stage, feedback from the stakeholder groups would be compared to determine areas of agreement as well as areas of divergence