

Key Insights
The Optic Neuritis Treatment market is projected for significant expansion, driven by the rising incidence of optic neuritis, often linked to autoimmune disorders and infections. Increased awareness and demand for advanced therapeutic interventions, coupled with substantial R&D investments by leading pharmaceutical and biotechnology firms, are fostering the introduction of novel treatments like targeted immunotherapies and advanced steroidal formulations. The market is anticipated to grow at a Compound Annual Growth Rate (CAGR) of 7.34%, supported by enhanced diagnostic capabilities, early intervention strategies, and escalating global healthcare expenditure in neurological treatments.
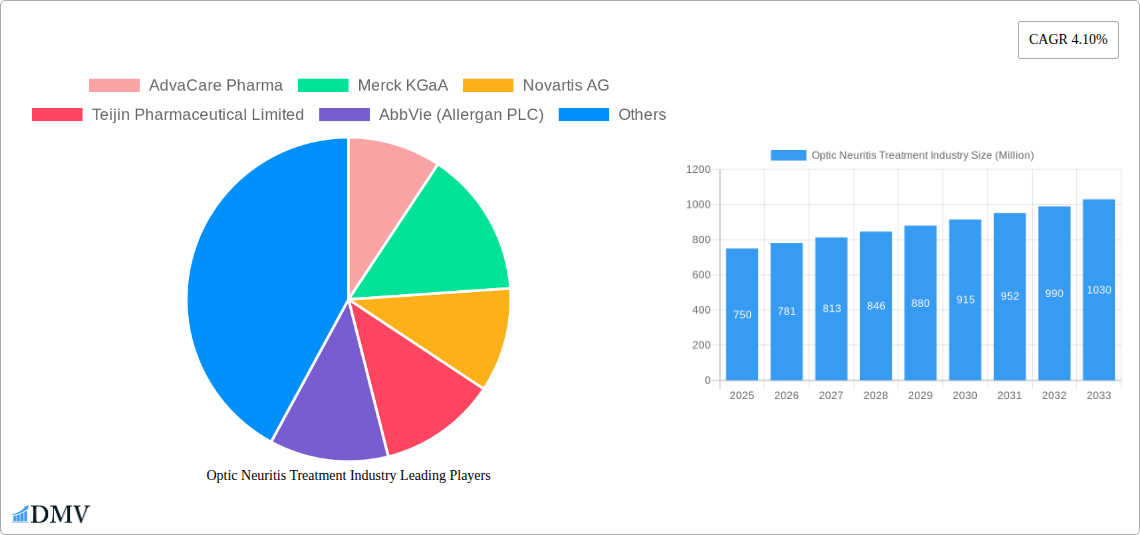
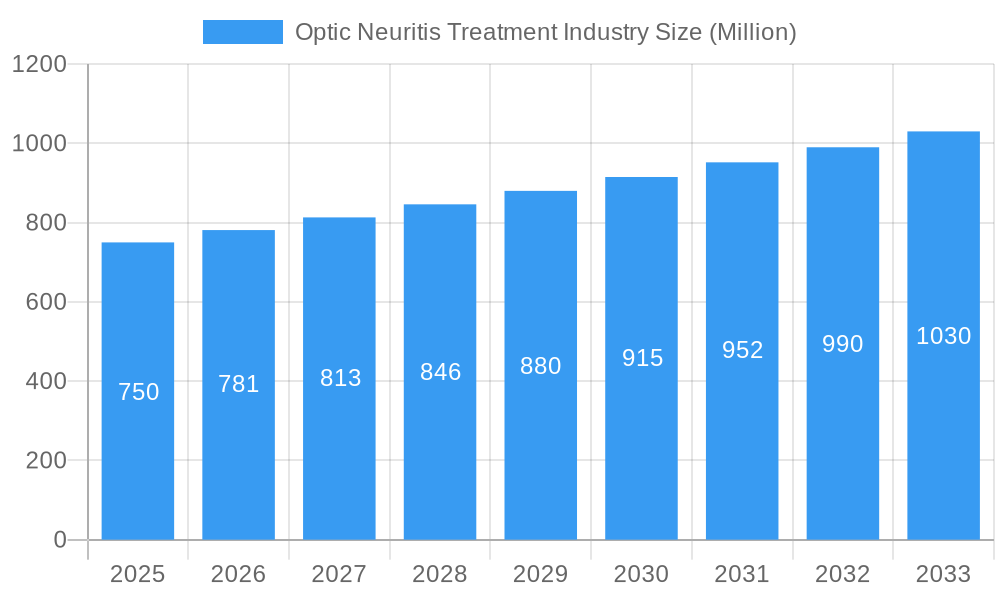
Optic Neuritis Treatment Industry Market Size (In Billion)
The therapeutic landscape is segmented into Steroidal Therapy, Immunomodulators, and Other Treatment Types. Steroidal therapy remains a primary treatment due to its anti-inflammatory effects, while immunomodulators are increasingly adopted for chronic and relapsing forms. Emerging treatments such as biologics and plasma exchange are diversifying the market. Geographically, North America and Europe are expected to lead, owing to robust healthcare infrastructure and high patient awareness. However, the Asia Pacific region offers substantial growth potential due to a growing patient base and improving healthcare affordability. Challenges include the high cost of advanced treatments and the need for specialized medical expertise in underserved areas.
Optic Neuritis Treatment Industry Company Market Share
Optic Neuritis Treatment Market Analysis: Projections, Innovations, and Key Stakeholders (2025-2033)
This comprehensive optic neuritis treatment market report examines therapies for optic neuritis, an optic nerve inflammation often associated with multiple sclerosis (MS). Covering the period up to 2033, with a base year of 2025, this analysis offers critical insights into market dynamics, competitive strategies, technological advancements, and future growth for optic neuritis treatment. The market is estimated to reach a size of 13.42 billion by the end of the forecast period.
Optic Neuritis Treatment Industry Market Composition & Trends
The optic neuritis treatment market exhibits a moderate to high concentration, driven by a select group of global pharmaceutical giants and emerging biotech innovators. Innovation catalysts are primarily fueled by ongoing research into the underlying mechanisms of optic neuritis and the development of novel therapeutic agents. The regulatory landscape is dynamic, with agencies like the FDA granting orphan drug designations to promising new treatments, thereby accelerating their development and market entry. Substitute products, while limited in directly addressing the inflammatory cascade, can indirectly impact the market through the management of underlying conditions like MS. End-user profiles range from neurologists and ophthalmologists prescribing treatments to patients actively seeking effective optic neuritis solutions. M&A activities, though not extensively documented with specific deal values at present, are anticipated to increase as companies seek to bolster their portfolios in the neurological disorder treatment space. Key market share distribution within optic neuritis treatment types is currently dominated by established modalities, but this is expected to shift with the introduction of innovative therapies. The global optic neuritis market size is projected to witness significant expansion.
Optic Neuritis Treatment Industry Industry Evolution
The optic neuritis treatment industry has undergone a significant evolution, marked by consistent market growth trajectories fueled by increasing disease awareness and advancements in diagnostic capabilities. Historically, treatment predominantly relied on high-dose corticosteroids to manage acute inflammation, providing rapid symptom relief but often accompanied by side effects. The historical period of 2019–2024 saw a steady demand for these established therapies. However, technological advancements have been pivotal in shaping the industry’s trajectory. The growing understanding of the immune-mediated nature of optic neuritis has led to the development and wider adoption of immunomodulatory therapies. These treatments aim to regulate the immune system’s response, offering a more targeted and potentially disease-modifying approach. This shift reflects a broader trend in the treatment of neurological diseases, moving towards personalized medicine and therapies that address the root causes rather than just symptoms.
Shifting consumer demands, influenced by patient advocacy groups and greater access to medical information, are also playing a crucial role. Patients are increasingly seeking treatments with improved safety profiles, fewer side effects, and the potential for long-term remission. This has spurred research into non-steroidal and oral immunomodulatory agents, promising greater convenience and adherence. The global optic neuritis market growth is further propelled by the increasing incidence of multiple sclerosis, a primary driver for optic neuritis. As the prevalence of MS continues to rise, so does the demand for effective optic neuritis treatments. Adoption metrics for new therapies are closely monitored, with clinical trial data and real-world evidence playing a critical role in their market penetration. The future of optic neuritis treatment appears promising, with ongoing innovation and a deeper understanding of the disease paving the way for more effective and patient-centric solutions.
Leading Regions, Countries, or Segments in Optic Neuritis Treatment Industry
The dominance within the optic neuritis treatment industry is currently contested between Steroidal Therapy and Immunomodulators therapy, with significant regional variations influencing their respective market shares.
Steroidal Therapy: Historically, steroidal therapies have held a commanding presence due to their established efficacy in rapidly reducing inflammation and alleviating symptoms of optic neuritis. Regions with well-developed healthcare infrastructure and readily accessible healthcare services tend to see higher prescription rates for these treatments. Investment trends in basic healthcare and emergency treatments in regions like North America and Europe have traditionally favored the accessibility and affordability of steroids. Regulatory support for these well-researched therapies has been consistent, ensuring their continued availability.
Immunomodulators therapy: The segment of immunomodulators is rapidly gaining traction and is poised to become a dominant force in the optic neuritis market. This growth is driven by a deeper understanding of the immunological underpinnings of optic neuritis, particularly its frequent association with multiple sclerosis. Countries investing heavily in advanced research and development for autoimmune disease treatments are leading the charge in the adoption of immunomodulators. Regulatory bodies in these regions are actively encouraging the development of novel immunotherapies through expedited review processes and incentives for neurology drug development. Key drivers for the growth of immunomodulators include their potential for disease modification, longer-lasting effects, and a more favorable side-effect profile compared to long-term steroid use. The increasing prevalence of multiple sclerosis globally further amplifies the demand for immunomodulatory treatments.
The other treatment types segment, encompassing supportive care and emerging therapies, currently holds a smaller market share but is characterized by high innovation potential. The United States and major European countries are at the forefront of both research and adoption of advanced treatments, contributing significantly to the overall market dynamics. Emerging economies are also showing increasing interest as healthcare access improves and awareness of optic neuritis and its management grows, indicating a promising expansion for all treatment segments in the coming years.
Optic Neuritis Treatment Industry Product Innovations
Product innovation in the optic neuritis treatment industry is centered on developing more targeted, safer, and convenient therapeutic options. A notable advancement is the development of experimental oral therapies, such as Trethera Corporation's TRE-515, which has received orphan drug designation from the U.S. FDA for demyelinating optic neuritis. This oral formulation represents a significant leap from traditional intravenous or high-dose oral steroid treatments, offering enhanced patient compliance and potentially reducing systemic side effects. The focus is on therapies that not only manage acute inflammation but also address the underlying autoimmune or demyelinating processes, thereby impacting disease progression. These innovations aim to improve patient outcomes by reducing recurrence rates and preserving visual function long-term, distinguishing them through improved efficacy and a better safety profile.
Propelling Factors for Optic Neuritis Treatment Industry Growth
Several key factors are propelling the growth of the optic neuritis treatment industry. The increasing prevalence of multiple sclerosis, a primary condition linked to optic neuritis, directly expands the patient pool requiring treatment. Technological advancements in understanding neuroinflammation and immune response are fostering the development of novel and more effective therapeutic agents, moving beyond traditional corticosteroids to immunomodulatory and potentially regenerative therapies. Growing awareness among healthcare professionals and the general public regarding optic neuritis symptoms and the availability of treatments is also a significant driver. Furthermore, favorable regulatory pathways, such as orphan drug designations, accelerate the approval and market entry of innovative drugs, encouraging investment in R&D for rare and niche neurological disorders. The global optic neuritis treatment market is therefore experiencing robust expansion.
Obstacles in the Optic Neuritis Treatment Industry Market
Despite the promising outlook, the optic neuritis treatment market faces several obstacles. Stringent regulatory hurdles and the lengthy drug development process can delay the introduction of new therapies, particularly for novel mechanisms of action. The high cost associated with developing and manufacturing advanced biological and immunomodulatory treatments can lead to significant pricing, posing access challenges for some patient populations and healthcare systems, impacting the cost of optic neuritis treatment. Supply chain disruptions for specialized raw materials or finished products can also impact market availability. Moreover, the competitive pressure from established steroidal therapies, which are often more affordable and widely understood, presents a barrier for newer, more expensive treatments, despite their potentially superior long-term benefits in optic neuritis management.
Future Opportunities in Optic Neuritis Treatment Industry
Emerging opportunities in the optic neuritis treatment industry are manifold, driven by ongoing research and evolving patient needs. The development of oral immunomodulators for optic neuritis presents a significant opportunity for improved patient convenience and adherence. Advancements in personalized medicine, focusing on identifying specific biomarkers to predict treatment response, can lead to more targeted and effective therapies. Expansion into emerging markets, where the diagnosis and treatment of neurological disorders are gaining momentum, offers substantial growth potential. Furthermore, the exploration of neuroprotective and regenerative strategies to repair optic nerve damage beyond just managing inflammation represents a long-term, high-impact opportunity in the treatment of optic neuritis.
Major Players in the Optic Neuritis Treatment Industry Ecosystem
- AdvaCare Pharma
- Merck KGaA
- Novartis AG
- Teijin Pharmaceutical Limited
- AbbVie (Allergan PLC)
- Mallinckrodt Pharmaceuticals
Key Developments in Optic Neuritis Treatment Industry Industry
- October 2022: Trethera has been awarded a USD 1.6 million grant to further develop TRE-515 as a potential treatment for optic neuritis, a common symptom of multiple sclerosis (MS).
- August 2022: The U.S. FDA granted orphan drug designation to Trethera Corporation's experimental oral therapy TRE-515 for demyelinating optic neuritis, an eye condition that may progress to multiple sclerosis (MS) or occur during the disease course.
Strategic Optic Neuritis Treatment Industry Market Forecast
The optic neuritis treatment market is poised for significant strategic growth, driven by a confluence of factors including increasing diagnosis rates, advancements in understanding neurological inflammation, and the development of novel therapeutic modalities. The continued rise in multiple sclerosis prevalence will serve as a primary catalyst, directly augmenting the demand for effective optic neuritis management. Innovations in immunomodulatory therapies and the promising emergence of oral treatment options like TRE-515 are set to redefine the treatment landscape, offering improved efficacy, safety profiles, and patient convenience. The strategic forecast anticipates a shift towards disease-modifying treatments, with a growing emphasis on long-term visual preservation and reduction of recurrence. This evolution, coupled with supportive regulatory environments for innovative eye care treatments, signals a robust and expanding market with considerable potential for both established players and emerging biotech firms in the global optic neuritis market.
Optic Neuritis Treatment Industry Segmentation
-
1. Treatment Type
- 1.1. Steroidal Therapy
- 1.2. Immunomodulators therapy
- 1.3. Other Treatment Types
Optic Neuritis Treatment Industry Segmentation By Geography
-
1. North America
- 1.1. United States
- 1.2. Canada
- 1.3. Mexico
-
2. Europe
- 2.1. Germany
- 2.2. United Kingdom
- 2.3. France
- 2.4. Italy
- 2.5. Spain
- 2.6. Rest of Europe
-
3. Asia Pacific
- 3.1. China
- 3.2. Japan
- 3.3. India
- 3.4. Australia
- 3.5. South Korea
- 3.6. Rest of Asia Pacific
-
4. Middle East and Africa
- 4.1. GCC
- 4.2. South Africa
- 4.3. Rest of Middle East and Africa
-
5. South America
- 5.1. Brazil
- 5.2. Argentina
- 5.3. Rest of South America
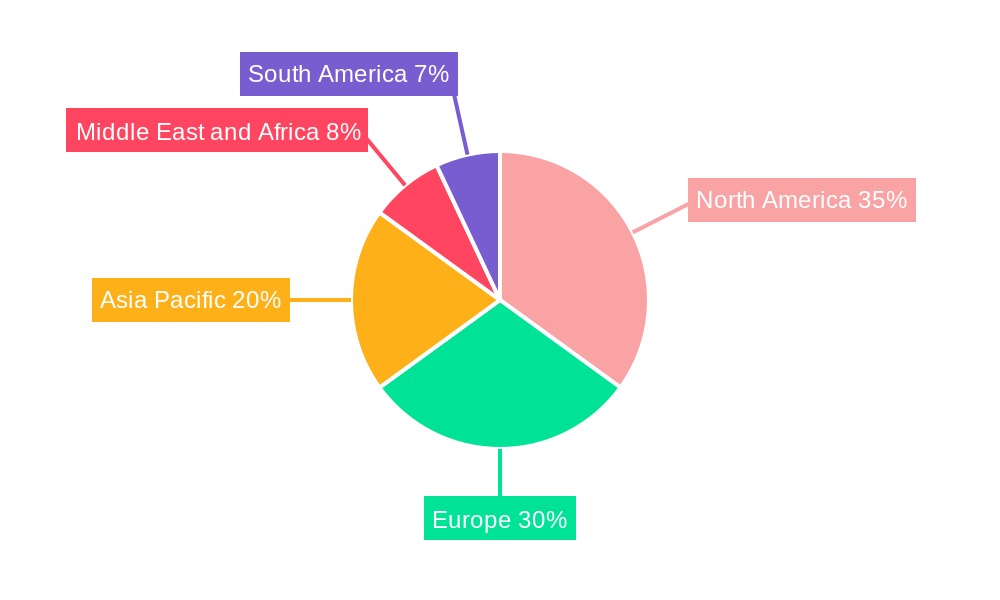
Optic Neuritis Treatment Industry Regional Market Share
Geographic Coverage of Optic Neuritis Treatment Industry
Optic Neuritis Treatment Industry REPORT HIGHLIGHTS
| Aspects | Details |
|---|---|
| Study Period | 2020-2034 |
| Base Year | 2025 |
| Estimated Year | 2026 |
| Forecast Period | 2026-2034 |
| Historical Period | 2020-2025 |
| Growth Rate | CAGR of 7.34% from 2020-2034 |
| Segmentation |
|
Table of Contents
- 1. Introduction
- 1.1. Research Scope
- 1.2. Market Segmentation
- 1.3. Research Objective
- 1.4. Definitions and Assumptions
- 2. Executive Summary
- 2.1. Market Snapshot
- 3. Market Dynamics
- 3.1. Market Drivers
- 3.2. Market Restrains
- 3.3. Market Trends
- 3.4. Market Opportunities
- 4. Market Factor Analysis
- 4.1. Porters Five Forces
- 4.1.1. Bargaining Power of Suppliers
- 4.1.2. Bargaining Power of Buyers
- 4.1.3. Threat of New Entrants
- 4.1.4. Threat of Substitutes
- 4.1.5. Competitive Rivalry
- 4.2. PESTEL analysis
- 4.3. BCG Analysis
- 4.3.1. Stars (High Growth, High Market Share)
- 4.3.2. Cash Cows (Low Growth, High Market Share)
- 4.3.3. Question Mark (High Growth, Low Market Share)
- 4.3.4. Dogs (Low Growth, Low Market Share)
- 4.4. Ansoff Matrix Analysis
- 4.5. Supply Chain Analysis
- 4.6. Regulatory Landscape
- 4.7. Current Market Potential and Opportunity Assessment (TAM–SAM–SOM Framework)
- 4.8. DMV Analyst Note
- 4.1. Porters Five Forces
- 5. Market Analysis, Insights and Forecast 2021-2033
- 5.1. Market Analysis, Insights and Forecast - by Treatment Type
- 5.1.1. Steroidal Therapy
- 5.1.2. Immunomodulators therapy
- 5.1.3. Other Treatment Types
- 5.2. Market Analysis, Insights and Forecast - by Region
- 5.2.1. North America
- 5.2.2. Europe
- 5.2.3. Asia Pacific
- 5.2.4. Middle East and Africa
- 5.2.5. South America
- 5.1. Market Analysis, Insights and Forecast - by Treatment Type
- 6. Global Optic Neuritis Treatment Industry Analysis, Insights and Forecast, 2021-2033
- 6.1. Market Analysis, Insights and Forecast - by Treatment Type
- 6.1.1. Steroidal Therapy
- 6.1.2. Immunomodulators therapy
- 6.1.3. Other Treatment Types
- 6.1. Market Analysis, Insights and Forecast - by Treatment Type
- 7. North America Optic Neuritis Treatment Industry Analysis, Insights and Forecast, 2020-2032
- 7.1. Market Analysis, Insights and Forecast - by Treatment Type
- 7.1.1. Steroidal Therapy
- 7.1.2. Immunomodulators therapy
- 7.1.3. Other Treatment Types
- 7.1. Market Analysis, Insights and Forecast - by Treatment Type
- 8. Europe Optic Neuritis Treatment Industry Analysis, Insights and Forecast, 2020-2032
- 8.1. Market Analysis, Insights and Forecast - by Treatment Type
- 8.1.1. Steroidal Therapy
- 8.1.2. Immunomodulators therapy
- 8.1.3. Other Treatment Types
- 8.1. Market Analysis, Insights and Forecast - by Treatment Type
- 9. Asia Pacific Optic Neuritis Treatment Industry Analysis, Insights and Forecast, 2020-2032
- 9.1. Market Analysis, Insights and Forecast - by Treatment Type
- 9.1.1. Steroidal Therapy
- 9.1.2. Immunomodulators therapy
- 9.1.3. Other Treatment Types
- 9.1. Market Analysis, Insights and Forecast - by Treatment Type
- 10. Middle East and Africa Optic Neuritis Treatment Industry Analysis, Insights and Forecast, 2020-2032
- 10.1. Market Analysis, Insights and Forecast - by Treatment Type
- 10.1.1. Steroidal Therapy
- 10.1.2. Immunomodulators therapy
- 10.1.3. Other Treatment Types
- 10.1. Market Analysis, Insights and Forecast - by Treatment Type
- 11. South America Optic Neuritis Treatment Industry Analysis, Insights and Forecast, 2020-2032
- 11.1. Market Analysis, Insights and Forecast - by Treatment Type
- 11.1.1. Steroidal Therapy
- 11.1.2. Immunomodulators therapy
- 11.1.3. Other Treatment Types
- 11.1. Market Analysis, Insights and Forecast - by Treatment Type
- 12. Competitive Analysis
- 12.1. Company Profiles
- 12.1.1 AdvaCare Pharma
- 12.1.1.1. Company Overview
- 12.1.1.2. Products
- 12.1.1.3. Company Financials
- 12.1.1.4. SWOT Analysis
- 12.1.2 Merck KGaA
- 12.1.2.1. Company Overview
- 12.1.2.2. Products
- 12.1.2.3. Company Financials
- 12.1.2.4. SWOT Analysis
- 12.1.3 Novartis AG
- 12.1.3.1. Company Overview
- 12.1.3.2. Products
- 12.1.3.3. Company Financials
- 12.1.3.4. SWOT Analysis
- 12.1.4 Teijin Pharmaceutical Limited
- 12.1.4.1. Company Overview
- 12.1.4.2. Products
- 12.1.4.3. Company Financials
- 12.1.4.4. SWOT Analysis
- 12.1.5 AbbVie (Allergan PLC)
- 12.1.5.1. Company Overview
- 12.1.5.2. Products
- 12.1.5.3. Company Financials
- 12.1.5.4. SWOT Analysis
- 12.1.6 Mallinckrodt Pharmaceuticals
- 12.1.6.1. Company Overview
- 12.1.6.2. Products
- 12.1.6.3. Company Financials
- 12.1.6.4. SWOT Analysis
- 12.1.1 AdvaCare Pharma
- 12.2. Market Entropy
- 12.2.1 Company's Key Areas Served
- 12.2.2 Recent Developments
- 12.3. Company Market Share Analysis 2025
- 12.3.1 Top 5 Companies Market Share Analysis
- 12.3.2 Top 3 Companies Market Share Analysis
- 12.4. List of Potential Customers
- 13. Research Methodology
List of Figures
- Figure 1: Global Optic Neuritis Treatment Industry Revenue Breakdown (billion, %) by Region 2025 & 2033
- Figure 2: Global Optic Neuritis Treatment Industry Volume Breakdown (K Unit, %) by Region 2025 & 2033
- Figure 3: North America Optic Neuritis Treatment Industry Revenue (billion), by Treatment Type 2025 & 2033
- Figure 4: North America Optic Neuritis Treatment Industry Volume (K Unit), by Treatment Type 2025 & 2033
- Figure 5: North America Optic Neuritis Treatment Industry Revenue Share (%), by Treatment Type 2025 & 2033
- Figure 6: North America Optic Neuritis Treatment Industry Volume Share (%), by Treatment Type 2025 & 2033
- Figure 7: North America Optic Neuritis Treatment Industry Revenue (billion), by Country 2025 & 2033
- Figure 8: North America Optic Neuritis Treatment Industry Volume (K Unit), by Country 2025 & 2033
- Figure 9: North America Optic Neuritis Treatment Industry Revenue Share (%), by Country 2025 & 2033
- Figure 10: North America Optic Neuritis Treatment Industry Volume Share (%), by Country 2025 & 2033
- Figure 11: Europe Optic Neuritis Treatment Industry Revenue (billion), by Treatment Type 2025 & 2033
- Figure 12: Europe Optic Neuritis Treatment Industry Volume (K Unit), by Treatment Type 2025 & 2033
- Figure 13: Europe Optic Neuritis Treatment Industry Revenue Share (%), by Treatment Type 2025 & 2033
- Figure 14: Europe Optic Neuritis Treatment Industry Volume Share (%), by Treatment Type 2025 & 2033
- Figure 15: Europe Optic Neuritis Treatment Industry Revenue (billion), by Country 2025 & 2033
- Figure 16: Europe Optic Neuritis Treatment Industry Volume (K Unit), by Country 2025 & 2033
- Figure 17: Europe Optic Neuritis Treatment Industry Revenue Share (%), by Country 2025 & 2033
- Figure 18: Europe Optic Neuritis Treatment Industry Volume Share (%), by Country 2025 & 2033
- Figure 19: Asia Pacific Optic Neuritis Treatment Industry Revenue (billion), by Treatment Type 2025 & 2033
- Figure 20: Asia Pacific Optic Neuritis Treatment Industry Volume (K Unit), by Treatment Type 2025 & 2033
- Figure 21: Asia Pacific Optic Neuritis Treatment Industry Revenue Share (%), by Treatment Type 2025 & 2033
- Figure 22: Asia Pacific Optic Neuritis Treatment Industry Volume Share (%), by Treatment Type 2025 & 2033
- Figure 23: Asia Pacific Optic Neuritis Treatment Industry Revenue (billion), by Country 2025 & 2033
- Figure 24: Asia Pacific Optic Neuritis Treatment Industry Volume (K Unit), by Country 2025 & 2033
- Figure 25: Asia Pacific Optic Neuritis Treatment Industry Revenue Share (%), by Country 2025 & 2033
- Figure 26: Asia Pacific Optic Neuritis Treatment Industry Volume Share (%), by Country 2025 & 2033
- Figure 27: Middle East and Africa Optic Neuritis Treatment Industry Revenue (billion), by Treatment Type 2025 & 2033
- Figure 28: Middle East and Africa Optic Neuritis Treatment Industry Volume (K Unit), by Treatment Type 2025 & 2033
- Figure 29: Middle East and Africa Optic Neuritis Treatment Industry Revenue Share (%), by Treatment Type 2025 & 2033
- Figure 30: Middle East and Africa Optic Neuritis Treatment Industry Volume Share (%), by Treatment Type 2025 & 2033
- Figure 31: Middle East and Africa Optic Neuritis Treatment Industry Revenue (billion), by Country 2025 & 2033
- Figure 32: Middle East and Africa Optic Neuritis Treatment Industry Volume (K Unit), by Country 2025 & 2033
- Figure 33: Middle East and Africa Optic Neuritis Treatment Industry Revenue Share (%), by Country 2025 & 2033
- Figure 34: Middle East and Africa Optic Neuritis Treatment Industry Volume Share (%), by Country 2025 & 2033
- Figure 35: South America Optic Neuritis Treatment Industry Revenue (billion), by Treatment Type 2025 & 2033
- Figure 36: South America Optic Neuritis Treatment Industry Volume (K Unit), by Treatment Type 2025 & 2033
- Figure 37: South America Optic Neuritis Treatment Industry Revenue Share (%), by Treatment Type 2025 & 2033
- Figure 38: South America Optic Neuritis Treatment Industry Volume Share (%), by Treatment Type 2025 & 2033
- Figure 39: South America Optic Neuritis Treatment Industry Revenue (billion), by Country 2025 & 2033
- Figure 40: South America Optic Neuritis Treatment Industry Volume (K Unit), by Country 2025 & 2033
- Figure 41: South America Optic Neuritis Treatment Industry Revenue Share (%), by Country 2025 & 2033
- Figure 42: South America Optic Neuritis Treatment Industry Volume Share (%), by Country 2025 & 2033
List of Tables
- Table 1: Global Optic Neuritis Treatment Industry Revenue billion Forecast, by Treatment Type 2020 & 2033
- Table 2: Global Optic Neuritis Treatment Industry Volume K Unit Forecast, by Treatment Type 2020 & 2033
- Table 3: Global Optic Neuritis Treatment Industry Revenue billion Forecast, by Region 2020 & 2033
- Table 4: Global Optic Neuritis Treatment Industry Volume K Unit Forecast, by Region 2020 & 2033
- Table 5: Global Optic Neuritis Treatment Industry Revenue billion Forecast, by Treatment Type 2020 & 2033
- Table 6: Global Optic Neuritis Treatment Industry Volume K Unit Forecast, by Treatment Type 2020 & 2033
- Table 7: Global Optic Neuritis Treatment Industry Revenue billion Forecast, by Country 2020 & 2033
- Table 8: Global Optic Neuritis Treatment Industry Volume K Unit Forecast, by Country 2020 & 2033
- Table 9: United States Optic Neuritis Treatment Industry Revenue (billion) Forecast, by Application 2020 & 2033
- Table 10: United States Optic Neuritis Treatment Industry Volume (K Unit) Forecast, by Application 2020 & 2033
- Table 11: Canada Optic Neuritis Treatment Industry Revenue (billion) Forecast, by Application 2020 & 2033
- Table 12: Canada Optic Neuritis Treatment Industry Volume (K Unit) Forecast, by Application 2020 & 2033
- Table 13: Mexico Optic Neuritis Treatment Industry Revenue (billion) Forecast, by Application 2020 & 2033
- Table 14: Mexico Optic Neuritis Treatment Industry Volume (K Unit) Forecast, by Application 2020 & 2033
- Table 15: Global Optic Neuritis Treatment Industry Revenue billion Forecast, by Treatment Type 2020 & 2033
- Table 16: Global Optic Neuritis Treatment Industry Volume K Unit Forecast, by Treatment Type 2020 & 2033
- Table 17: Global Optic Neuritis Treatment Industry Revenue billion Forecast, by Country 2020 & 2033
- Table 18: Global Optic Neuritis Treatment Industry Volume K Unit Forecast, by Country 2020 & 2033
- Table 19: Germany Optic Neuritis Treatment Industry Revenue (billion) Forecast, by Application 2020 & 2033
- Table 20: Germany Optic Neuritis Treatment Industry Volume (K Unit) Forecast, by Application 2020 & 2033
- Table 21: United Kingdom Optic Neuritis Treatment Industry Revenue (billion) Forecast, by Application 2020 & 2033
- Table 22: United Kingdom Optic Neuritis Treatment Industry Volume (K Unit) Forecast, by Application 2020 & 2033
- Table 23: France Optic Neuritis Treatment Industry Revenue (billion) Forecast, by Application 2020 & 2033
- Table 24: France Optic Neuritis Treatment Industry Volume (K Unit) Forecast, by Application 2020 & 2033
- Table 25: Italy Optic Neuritis Treatment Industry Revenue (billion) Forecast, by Application 2020 & 2033
- Table 26: Italy Optic Neuritis Treatment Industry Volume (K Unit) Forecast, by Application 2020 & 2033
- Table 27: Spain Optic Neuritis Treatment Industry Revenue (billion) Forecast, by Application 2020 & 2033
- Table 28: Spain Optic Neuritis Treatment Industry Volume (K Unit) Forecast, by Application 2020 & 2033
- Table 29: Rest of Europe Optic Neuritis Treatment Industry Revenue (billion) Forecast, by Application 2020 & 2033
- Table 30: Rest of Europe Optic Neuritis Treatment Industry Volume (K Unit) Forecast, by Application 2020 & 2033
- Table 31: Global Optic Neuritis Treatment Industry Revenue billion Forecast, by Treatment Type 2020 & 2033
- Table 32: Global Optic Neuritis Treatment Industry Volume K Unit Forecast, by Treatment Type 2020 & 2033
- Table 33: Global Optic Neuritis Treatment Industry Revenue billion Forecast, by Country 2020 & 2033
- Table 34: Global Optic Neuritis Treatment Industry Volume K Unit Forecast, by Country 2020 & 2033
- Table 35: China Optic Neuritis Treatment Industry Revenue (billion) Forecast, by Application 2020 & 2033
- Table 36: China Optic Neuritis Treatment Industry Volume (K Unit) Forecast, by Application 2020 & 2033
- Table 37: Japan Optic Neuritis Treatment Industry Revenue (billion) Forecast, by Application 2020 & 2033
- Table 38: Japan Optic Neuritis Treatment Industry Volume (K Unit) Forecast, by Application 2020 & 2033
- Table 39: India Optic Neuritis Treatment Industry Revenue (billion) Forecast, by Application 2020 & 2033
- Table 40: India Optic Neuritis Treatment Industry Volume (K Unit) Forecast, by Application 2020 & 2033
- Table 41: Australia Optic Neuritis Treatment Industry Revenue (billion) Forecast, by Application 2020 & 2033
- Table 42: Australia Optic Neuritis Treatment Industry Volume (K Unit) Forecast, by Application 2020 & 2033
- Table 43: South Korea Optic Neuritis Treatment Industry Revenue (billion) Forecast, by Application 2020 & 2033
- Table 44: South Korea Optic Neuritis Treatment Industry Volume (K Unit) Forecast, by Application 2020 & 2033
- Table 45: Rest of Asia Pacific Optic Neuritis Treatment Industry Revenue (billion) Forecast, by Application 2020 & 2033
- Table 46: Rest of Asia Pacific Optic Neuritis Treatment Industry Volume (K Unit) Forecast, by Application 2020 & 2033
- Table 47: Global Optic Neuritis Treatment Industry Revenue billion Forecast, by Treatment Type 2020 & 2033
- Table 48: Global Optic Neuritis Treatment Industry Volume K Unit Forecast, by Treatment Type 2020 & 2033
- Table 49: Global Optic Neuritis Treatment Industry Revenue billion Forecast, by Country 2020 & 2033
- Table 50: Global Optic Neuritis Treatment Industry Volume K Unit Forecast, by Country 2020 & 2033
- Table 51: GCC Optic Neuritis Treatment Industry Revenue (billion) Forecast, by Application 2020 & 2033
- Table 52: GCC Optic Neuritis Treatment Industry Volume (K Unit) Forecast, by Application 2020 & 2033
- Table 53: South Africa Optic Neuritis Treatment Industry Revenue (billion) Forecast, by Application 2020 & 2033
- Table 54: South Africa Optic Neuritis Treatment Industry Volume (K Unit) Forecast, by Application 2020 & 2033
- Table 55: Rest of Middle East and Africa Optic Neuritis Treatment Industry Revenue (billion) Forecast, by Application 2020 & 2033
- Table 56: Rest of Middle East and Africa Optic Neuritis Treatment Industry Volume (K Unit) Forecast, by Application 2020 & 2033
- Table 57: Global Optic Neuritis Treatment Industry Revenue billion Forecast, by Treatment Type 2020 & 2033
- Table 58: Global Optic Neuritis Treatment Industry Volume K Unit Forecast, by Treatment Type 2020 & 2033
- Table 59: Global Optic Neuritis Treatment Industry Revenue billion Forecast, by Country 2020 & 2033
- Table 60: Global Optic Neuritis Treatment Industry Volume K Unit Forecast, by Country 2020 & 2033
- Table 61: Brazil Optic Neuritis Treatment Industry Revenue (billion) Forecast, by Application 2020 & 2033
- Table 62: Brazil Optic Neuritis Treatment Industry Volume (K Unit) Forecast, by Application 2020 & 2033
- Table 63: Argentina Optic Neuritis Treatment Industry Revenue (billion) Forecast, by Application 2020 & 2033
- Table 64: Argentina Optic Neuritis Treatment Industry Volume (K Unit) Forecast, by Application 2020 & 2033
- Table 65: Rest of South America Optic Neuritis Treatment Industry Revenue (billion) Forecast, by Application 2020 & 2033
- Table 66: Rest of South America Optic Neuritis Treatment Industry Volume (K Unit) Forecast, by Application 2020 & 2033
Frequently Asked Questions
1. What is the projected Compound Annual Growth Rate (CAGR) of the Optic Neuritis Treatment Industry?
The projected CAGR is approximately 7.34%.
2. Which companies are prominent players in the Optic Neuritis Treatment Industry?
Key companies in the market include AdvaCare Pharma, Merck KGaA, Novartis AG, Teijin Pharmaceutical Limited, AbbVie (Allergan PLC), Mallinckrodt Pharmaceuticals.
3. What are the main segments of the Optic Neuritis Treatment Industry?
The market segments include Treatment Type.
4. Can you provide details about the market size?
The market size is estimated to be USD 13.42 billion as of 2022.
5. What are some drivers contributing to market growth?
Increasing Prevalence of Optic Neuritis; Increasing Research Work Related to Optic Neuritis Treatment.
6. What are the notable trends driving market growth?
Steroidal Therapy Segment is Expected to Witness Considerable Growth Over the Forecast Period.
7. Are there any restraints impacting market growth?
Side Effects Associated with the Treatment.
8. Can you provide examples of recent developments in the market?
October 2022: Trethera has been awarded a USD 1.6 million grant to further develop TRE-515 as a potential treatment for optic neuritis which also is a common symptom of multiple sclerosis (MS).
9. What pricing options are available for accessing the report?
Pricing options include single-user, multi-user, and enterprise licenses priced at USD 4750, USD 5250, and USD 8750 respectively.
10. Is the market size provided in terms of value or volume?
The market size is provided in terms of value, measured in billion and volume, measured in K Unit.
11. Are there any specific market keywords associated with the report?
Yes, the market keyword associated with the report is "Optic Neuritis Treatment Industry," which aids in identifying and referencing the specific market segment covered.
12. How do I determine which pricing option suits my needs best?
The pricing options vary based on user requirements and access needs. Individual users may opt for single-user licenses, while businesses requiring broader access may choose multi-user or enterprise licenses for cost-effective access to the report.
13. Are there any additional resources or data provided in the Optic Neuritis Treatment Industry report?
While the report offers comprehensive insights, it's advisable to review the specific contents or supplementary materials provided to ascertain if additional resources or data are available.
14. How can I stay updated on further developments or reports in the Optic Neuritis Treatment Industry?
To stay informed about further developments, trends, and reports in the Optic Neuritis Treatment Industry, consider subscribing to industry newsletters, following relevant companies and organizations, or regularly checking reputable industry news sources and publications.
Methodology
Step 1 - Identification of Relevant Samples Size from Population Database


Step 2 - Approaches for Defining Global Market Size (Value, Volume* & Price*)

Note*: In applicable scenarios
Step 3 - Data Sources
Primary Research
- Web Analytics
- Survey Reports
- Research Institute
- Latest Research Reports
- Opinion Leaders
Secondary Research
- Annual Reports
- White Paper
- Latest Press Release
- Industry Association
- Paid Database
- Investor Presentations

Step 4 - Data Triangulation
Involves using different sources of information in order to increase the validity of a study
These sources are likely to be stakeholders in a program - participants, other researchers, program staff, other community members, and so on.
Then we put all data in single framework & apply various statistical tools to find out the dynamic on the market.
During the analysis stage, feedback from the stakeholder groups would be compared to determine areas of agreement as well as areas of divergence