

Key Insights
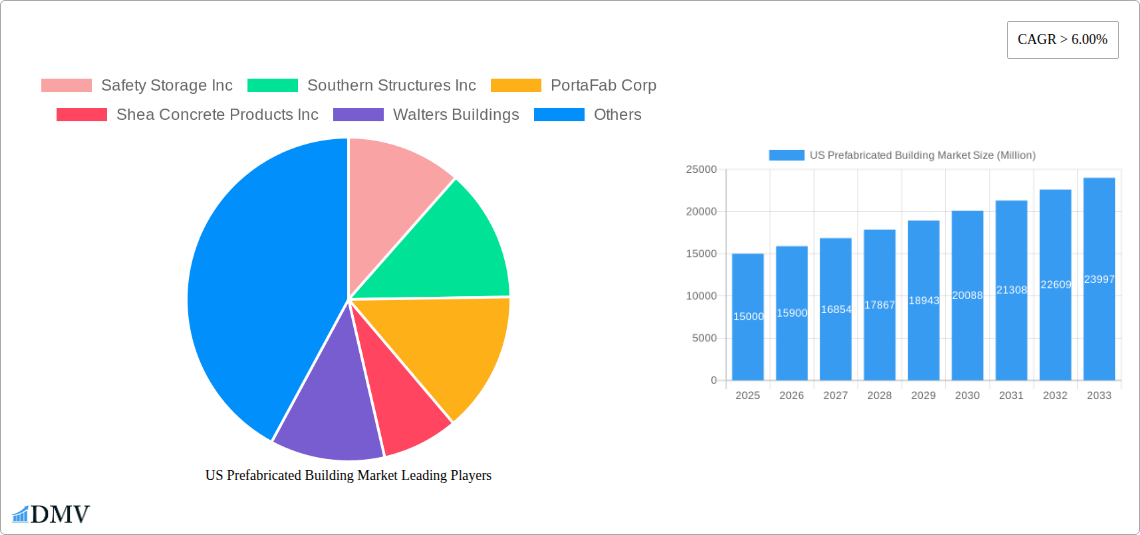
The US prefabricated building market is experiencing robust growth, projected to maintain a Compound Annual Growth Rate (CAGR) exceeding 6% from 2025 to 2033. This expansion is fueled by several key drivers. Increasing demand for faster construction timelines, particularly in residential and commercial sectors, is a significant factor. Prefabrication offers substantial time savings compared to traditional construction methods, making it an attractive option for developers facing project deadlines and rising labor costs. Furthermore, the growing emphasis on sustainable construction practices is bolstering the market. Prefabricated buildings often utilize eco-friendly materials and energy-efficient designs, aligning with broader environmental concerns. The market segmentation reveals a diverse landscape, with concrete, glass, metal, and timber being dominant material types, catering to various application needs. Residential and commercial sectors currently represent the largest application segments, but the infrastructure and industrial sectors are anticipated to witness significant growth due to large-scale projects requiring efficient and cost-effective construction solutions. Leading players such as Safety Storage Inc, Southern Structures Inc, and Panel Built Inc are driving innovation and competition within the market, further contributing to its expansion. The regional distribution across the United States, encompassing the Northeast, Southeast, Midwest, Southwest, and West, reflects a geographically widespread adoption of prefabricated building solutions.
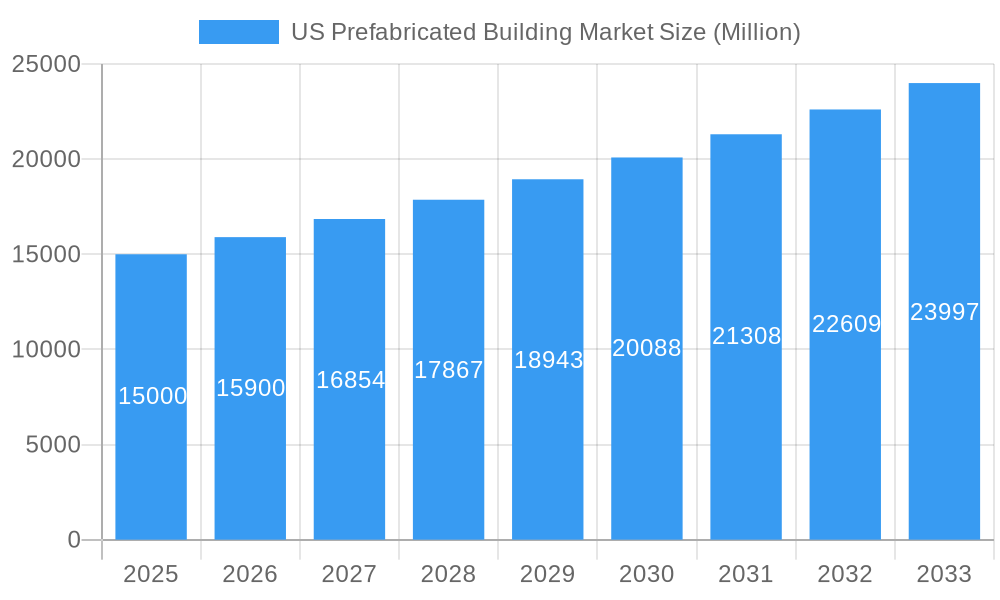
US Prefabricated Building Market Market Size (In Billion)
The market's steady growth trajectory is expected to continue, driven by ongoing technological advancements in prefabrication techniques and the increasing availability of skilled labor specialized in modular construction. However, potential restraints include the need for stricter regulatory frameworks and building codes to accommodate the unique characteristics of prefabricated structures. Overcoming challenges related to transportation and logistics, particularly for larger and more complex prefabricated building components, will be crucial for market expansion. The evolving preferences of consumers regarding aesthetics and customization in prefab construction will also shape future market dynamics. Despite these challenges, the overall outlook for the US prefabricated building market remains positive, with significant opportunities for growth and innovation in the coming years. The market's size in 2025 is estimated at $15 Billion based on the provided CAGR and industry trends. This estimate is a reasonable approximation considering the market’s ongoing growth and the values of similar construction sectors.
US Prefabricated Building Market Company Market Share
US Prefabricated Building Market: A Comprehensive Report (2019-2033)
This insightful report provides a detailed analysis of the US Prefabricated Building Market, offering a comprehensive overview of market dynamics, key players, and future growth prospects. With a study period spanning 2019-2033, a base year of 2025, and a forecast period of 2025-2033, this report is an invaluable resource for stakeholders seeking to understand and capitalize on the opportunities within this rapidly evolving sector. The market is projected to reach xx Million by 2033, driven by factors such as increasing construction activity and the growing adoption of sustainable building practices.
US Prefabricated Building Market Composition & Trends
This section delves into the competitive landscape of the US prefabricated building market, examining market concentration, innovation drivers, regulatory frameworks, substitute products, end-user profiles, and merger & acquisition (M&A) activities. We analyze the market share distribution among key players, including Safety Storage Inc, Southern Structures Inc, PortaFab Corp, Shea Concrete Products Inc, Walters Buildings, Commercial Structures Corp, Rubb Building Systems, Modular Connections LLC, Deluxe Building Solutions, and Panel Built Inc (list not exhaustive).
- Market Concentration: The market exhibits a moderately concentrated structure, with the top five players holding an estimated xx% market share in 2024. This concentration is likely to evolve with continued M&A activity.
- Innovation Catalysts: Advancements in materials science, automation, and design software are driving innovation, leading to more efficient and sustainable prefabricated building solutions.
- Regulatory Landscape: Building codes and regulations influence material choices and construction methods, impacting market growth and the adoption of specific technologies.
- Substitute Products: Traditional construction methods remain a significant substitute, but the advantages of prefabrication in terms of speed, cost, and quality are gradually increasing market share.
- End-User Profiles: The market caters to diverse end-users, including residential developers, commercial contractors, and infrastructure projects, each with unique needs and preferences.
- M&A Activity: The past five years have seen significant M&A activity, with deal values totaling an estimated xx Million. These acquisitions are reshaping the competitive landscape and driving consolidation.
US Prefabricated Building Market Industry Evolution
This section analyzes the historical and projected growth trajectories of the US prefabricated building market. We explore technological advancements, shifting consumer preferences, and their combined impact on market dynamics. Data points include CAGR, adoption rates of various building materials and technologies, and market segmentation trends. The market has witnessed robust growth from 2019-2024, with a CAGR of xx%, and is expected to maintain this momentum, although at a slightly reduced pace, during the forecast period. The increasing demand for sustainable and energy-efficient buildings significantly drives this growth. This is also supported by the growing adoption of modular construction methods and the rise of innovative material technologies.
Leading Regions, Countries, or Segments in US Prefabricated Building Market
This section identifies the leading segments within the US prefabricated building market, categorized by type and application. We analyze the key factors contributing to their dominance, including investment trends and regulatory support.
By Type:
- Metal: The metal segment holds the largest market share, driven by its durability, cost-effectiveness, and versatility. Strong demand from the commercial sector, particularly for warehouses and industrial buildings, fuels this dominance.
- Concrete: The concrete segment demonstrates steady growth, driven by its inherent strength and fire resistance, particularly popular in residential and infrastructure applications.
- Timber: The timber segment is experiencing a growth surge thanks to renewed interest in sustainable construction practices. Innovations such as Knauf's integrated wall system are accelerating this trend.
By Application:
- Commercial: This segment accounts for the largest share due to the increased adoption of prefabricated solutions for large-scale commercial projects. This is fueled by cost-efficiency and reduced construction timelines.
- Residential: The residential segment shows steady growth, driven by the rising demand for affordable and quickly constructed homes. Prefabricated designs offer flexibility and customization for this market.
- Other Applications (Infrastructure & Industrial): This segment is growing rapidly driven by the need for efficient and durable infrastructure solutions. Large-scale projects, like the electric arc steelmaking facility built by Walters Inc. for Algoma Steel, showcase this trend.
US Prefabricated Building Market Product Innovations
Recent innovations include advancements in materials, such as lighter and stronger composites, and improved design software that allows for greater customization and precision. The integration of smart building technologies, such as sensors and IoT devices, enhances building performance and energy efficiency. These innovations offer unique selling propositions, such as faster construction times, lower costs, and improved sustainability compared to traditional construction methods.
Propelling Factors for US Prefabricated Building Market Growth
Several factors drive the growth of the US prefabricated building market. Technological advancements, such as improved manufacturing techniques and the use of advanced materials, lead to faster construction times and cost reductions. The growing demand for sustainable building practices further fuels market expansion. Favorable government policies and incentives supporting green building initiatives add momentum. Finally, the increasing urbanization and demand for affordable housing create a high demand for efficient construction solutions.
Obstacles in the US Prefabricated Building Market
Despite significant growth potential, several challenges hinder market expansion. Stringent building codes and regulations can complicate the adoption of prefabricated solutions. Supply chain disruptions and fluctuations in raw material prices pose additional challenges. Intense competition from traditional construction methods and the establishment of well-established players also pose a significant hurdle.
Future Opportunities in US Prefabricated Building Market
The future of the US prefabricated building market is bright. Emerging opportunities include the expansion into new applications such as modular healthcare facilities and data centers. Advances in 3D printing and the development of innovative, sustainable building materials promise further market expansion. Growing consumer awareness of sustainability and energy efficiency creates significant demand for eco-friendly building options.
Major Players in the US Prefabricated Building Market Ecosystem
- Safety Storage Inc
- Southern Structures Inc
- PortaFab Corp
- Shea Concrete Products Inc
- Walters Buildings
- Commercial Structures Corp
- Rubb Building Systems
- Modular Connections LLC
- Deluxe Building Solutions
- Panel Built Inc
Key Developments in US Prefabricated Building Market Industry
- October 2022: Knauf Group's partnership between Knauf Gips and Knauf Insulation introduces a new wall system for timber frame construction, accelerating the adoption of prefabricated and modular building systems.
- April 2022: Walters Inc. secures a contract for a significant steelmaking facility, highlighting the growing demand for prefabricated solutions in the industrial sector.
Strategic US Prefabricated Building Market Forecast
The US prefabricated building market is poised for continued growth driven by technological advancements, sustainability concerns, and rising construction activity. Expanding into new market segments and leveraging innovative technologies will unlock significant opportunities. The market's potential is substantial, with a projected value of xx Million by 2033, reflecting a strong demand for efficient, cost-effective, and sustainable building solutions.
US Prefabricated Building Market Segmentation
-
1. Type
- 1.1. Concrete
- 1.2. Glass
- 1.3. Metal
- 1.4. Timber
- 1.5. Other Material Types
-
2. Application
- 2.1. Residential
- 2.2. Commercial
- 2.3. Other Applications (Infrastructure and Industrial)
US Prefabricated Building Market Segmentation By Geography
-
1. North America
- 1.1. United States
- 1.2. Canada
- 1.3. Mexico
-
2. South America
- 2.1. Brazil
- 2.2. Argentina
- 2.3. Rest of South America
-
3. Europe
- 3.1. United Kingdom
- 3.2. Germany
- 3.3. France
- 3.4. Italy
- 3.5. Spain
- 3.6. Russia
- 3.7. Benelux
- 3.8. Nordics
- 3.9. Rest of Europe
-
4. Middle East & Africa
- 4.1. Turkey
- 4.2. Israel
- 4.3. GCC
- 4.4. North Africa
- 4.5. South Africa
- 4.6. Rest of Middle East & Africa
-
5. Asia Pacific
- 5.1. China
- 5.2. India
- 5.3. Japan
- 5.4. South Korea
- 5.5. ASEAN
- 5.6. Oceania
- 5.7. Rest of Asia Pacific
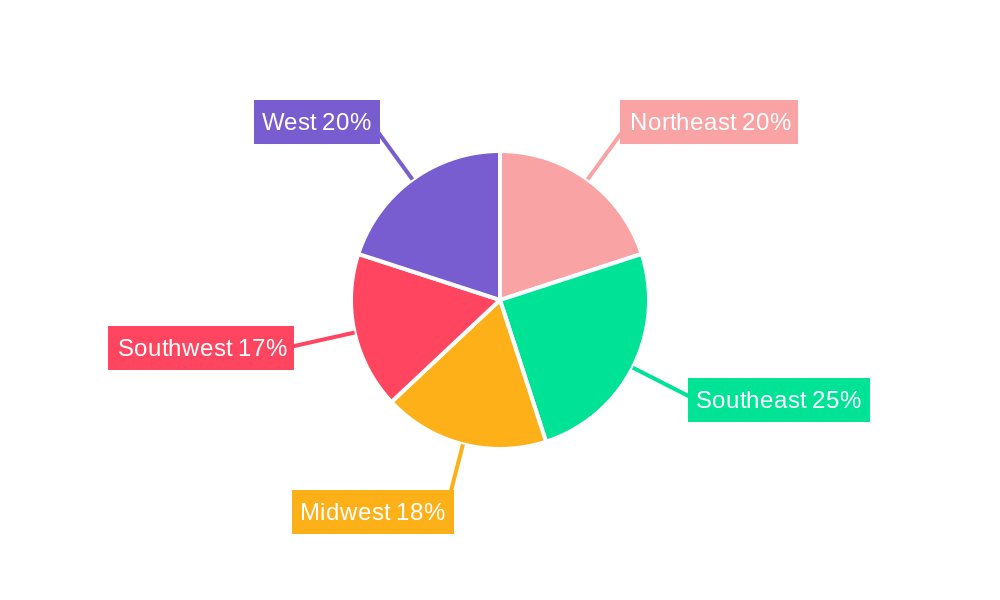
US Prefabricated Building Market Regional Market Share
Geographic Coverage of US Prefabricated Building Market
US Prefabricated Building Market REPORT HIGHLIGHTS
| Aspects | Details |
|---|---|
| Study Period | 2020-2034 |
| Base Year | 2025 |
| Estimated Year | 2026 |
| Forecast Period | 2026-2034 |
| Historical Period | 2020-2025 |
| Growth Rate | CAGR of > 6.00% from 2020-2034 |
| Segmentation |
|
Table of Contents
- 1. Introduction
- 1.1. Research Scope
- 1.2. Market Segmentation
- 1.3. Research Objective
- 1.4. Definitions and Assumptions
- 2. Executive Summary
- 2.1. Market Snapshot
- 3. Market Dynamics
- 3.1. Market Drivers
- 3.2. Market Restrains
- 3.3. Market Trends
- 3.4. Market Opportunities
- 4. Market Factor Analysis
- 4.1. Porters Five Forces
- 4.1.1. Bargaining Power of Suppliers
- 4.1.2. Bargaining Power of Buyers
- 4.1.3. Threat of New Entrants
- 4.1.4. Threat of Substitutes
- 4.1.5. Competitive Rivalry
- 4.2. PESTEL analysis
- 4.3. BCG Analysis
- 4.3.1. Stars (High Growth, High Market Share)
- 4.3.2. Cash Cows (Low Growth, High Market Share)
- 4.3.3. Question Mark (High Growth, Low Market Share)
- 4.3.4. Dogs (Low Growth, Low Market Share)
- 4.4. Ansoff Matrix Analysis
- 4.5. Supply Chain Analysis
- 4.6. Regulatory Landscape
- 4.7. Current Market Potential and Opportunity Assessment (TAM–SAM–SOM Framework)
- 4.8. DMV Analyst Note
- 4.1. Porters Five Forces
- 5. Market Analysis, Insights and Forecast 2021-2033
- 5.1. Market Analysis, Insights and Forecast - by Type
- 5.1.1. Concrete
- 5.1.2. Glass
- 5.1.3. Metal
- 5.1.4. Timber
- 5.1.5. Other Material Types
- 5.2. Market Analysis, Insights and Forecast - by Application
- 5.2.1. Residential
- 5.2.2. Commercial
- 5.2.3. Other Applications (Infrastructure and Industrial)
- 5.3. Market Analysis, Insights and Forecast - by Region
- 5.3.1. North America
- 5.3.2. South America
- 5.3.3. Europe
- 5.3.4. Middle East & Africa
- 5.3.5. Asia Pacific
- 5.1. Market Analysis, Insights and Forecast - by Type
- 6. Global US Prefabricated Building Market Analysis, Insights and Forecast, 2021-2033
- 6.1. Market Analysis, Insights and Forecast - by Type
- 6.1.1. Concrete
- 6.1.2. Glass
- 6.1.3. Metal
- 6.1.4. Timber
- 6.1.5. Other Material Types
- 6.2. Market Analysis, Insights and Forecast - by Application
- 6.2.1. Residential
- 6.2.2. Commercial
- 6.2.3. Other Applications (Infrastructure and Industrial)
- 6.1. Market Analysis, Insights and Forecast - by Type
- 7. North America US Prefabricated Building Market Analysis, Insights and Forecast, 2020-2032
- 7.1. Market Analysis, Insights and Forecast - by Type
- 7.1.1. Concrete
- 7.1.2. Glass
- 7.1.3. Metal
- 7.1.4. Timber
- 7.1.5. Other Material Types
- 7.2. Market Analysis, Insights and Forecast - by Application
- 7.2.1. Residential
- 7.2.2. Commercial
- 7.2.3. Other Applications (Infrastructure and Industrial)
- 7.1. Market Analysis, Insights and Forecast - by Type
- 8. South America US Prefabricated Building Market Analysis, Insights and Forecast, 2020-2032
- 8.1. Market Analysis, Insights and Forecast - by Type
- 8.1.1. Concrete
- 8.1.2. Glass
- 8.1.3. Metal
- 8.1.4. Timber
- 8.1.5. Other Material Types
- 8.2. Market Analysis, Insights and Forecast - by Application
- 8.2.1. Residential
- 8.2.2. Commercial
- 8.2.3. Other Applications (Infrastructure and Industrial)
- 8.1. Market Analysis, Insights and Forecast - by Type
- 9. Europe US Prefabricated Building Market Analysis, Insights and Forecast, 2020-2032
- 9.1. Market Analysis, Insights and Forecast - by Type
- 9.1.1. Concrete
- 9.1.2. Glass
- 9.1.3. Metal
- 9.1.4. Timber
- 9.1.5. Other Material Types
- 9.2. Market Analysis, Insights and Forecast - by Application
- 9.2.1. Residential
- 9.2.2. Commercial
- 9.2.3. Other Applications (Infrastructure and Industrial)
- 9.1. Market Analysis, Insights and Forecast - by Type
- 10. Middle East & Africa US Prefabricated Building Market Analysis, Insights and Forecast, 2020-2032
- 10.1. Market Analysis, Insights and Forecast - by Type
- 10.1.1. Concrete
- 10.1.2. Glass
- 10.1.3. Metal
- 10.1.4. Timber
- 10.1.5. Other Material Types
- 10.2. Market Analysis, Insights and Forecast - by Application
- 10.2.1. Residential
- 10.2.2. Commercial
- 10.2.3. Other Applications (Infrastructure and Industrial)
- 10.1. Market Analysis, Insights and Forecast - by Type
- 11. Asia Pacific US Prefabricated Building Market Analysis, Insights and Forecast, 2020-2032
- 11.1. Market Analysis, Insights and Forecast - by Type
- 11.1.1. Concrete
- 11.1.2. Glass
- 11.1.3. Metal
- 11.1.4. Timber
- 11.1.5. Other Material Types
- 11.2. Market Analysis, Insights and Forecast - by Application
- 11.2.1. Residential
- 11.2.2. Commercial
- 11.2.3. Other Applications (Infrastructure and Industrial)
- 11.1. Market Analysis, Insights and Forecast - by Type
- 12. Competitive Analysis
- 12.1. Company Profiles
- 12.1.1 Safety Storage Inc
- 12.1.1.1. Company Overview
- 12.1.1.2. Products
- 12.1.1.3. Company Financials
- 12.1.1.4. SWOT Analysis
- 12.1.2 Southern Structures Inc
- 12.1.2.1. Company Overview
- 12.1.2.2. Products
- 12.1.2.3. Company Financials
- 12.1.2.4. SWOT Analysis
- 12.1.3 PortaFab Corp
- 12.1.3.1. Company Overview
- 12.1.3.2. Products
- 12.1.3.3. Company Financials
- 12.1.3.4. SWOT Analysis
- 12.1.4 Shea Concrete Products Inc
- 12.1.4.1. Company Overview
- 12.1.4.2. Products
- 12.1.4.3. Company Financials
- 12.1.4.4. SWOT Analysis
- 12.1.5 Walters Buildings
- 12.1.5.1. Company Overview
- 12.1.5.2. Products
- 12.1.5.3. Company Financials
- 12.1.5.4. SWOT Analysis
- 12.1.6 Commercial Structures Corp
- 12.1.6.1. Company Overview
- 12.1.6.2. Products
- 12.1.6.3. Company Financials
- 12.1.6.4. SWOT Analysis
- 12.1.7 Rubb Building Systems
- 12.1.7.1. Company Overview
- 12.1.7.2. Products
- 12.1.7.3. Company Financials
- 12.1.7.4. SWOT Analysis
- 12.1.8 Modular Connections LLC**List Not Exhaustive
- 12.1.8.1. Company Overview
- 12.1.8.2. Products
- 12.1.8.3. Company Financials
- 12.1.8.4. SWOT Analysis
- 12.1.9 Deluxe Building Solutions
- 12.1.9.1. Company Overview
- 12.1.9.2. Products
- 12.1.9.3. Company Financials
- 12.1.9.4. SWOT Analysis
- 12.1.10 Panel Built Inc
- 12.1.10.1. Company Overview
- 12.1.10.2. Products
- 12.1.10.3. Company Financials
- 12.1.10.4. SWOT Analysis
- 12.1.1 Safety Storage Inc
- 12.2. Market Entropy
- 12.2.1 Company's Key Areas Served
- 12.2.2 Recent Developments
- 12.3. Company Market Share Analysis 2025
- 12.3.1 Top 5 Companies Market Share Analysis
- 12.3.2 Top 3 Companies Market Share Analysis
- 12.4. List of Potential Customers
- 13. Research Methodology
List of Figures
- Figure 1: Global US Prefabricated Building Market Revenue Breakdown (Million, %) by Region 2025 & 2033
- Figure 2: North America US Prefabricated Building Market Revenue (Million), by Type 2025 & 2033
- Figure 3: North America US Prefabricated Building Market Revenue Share (%), by Type 2025 & 2033
- Figure 4: North America US Prefabricated Building Market Revenue (Million), by Application 2025 & 2033
- Figure 5: North America US Prefabricated Building Market Revenue Share (%), by Application 2025 & 2033
- Figure 6: North America US Prefabricated Building Market Revenue (Million), by Country 2025 & 2033
- Figure 7: North America US Prefabricated Building Market Revenue Share (%), by Country 2025 & 2033
- Figure 8: South America US Prefabricated Building Market Revenue (Million), by Type 2025 & 2033
- Figure 9: South America US Prefabricated Building Market Revenue Share (%), by Type 2025 & 2033
- Figure 10: South America US Prefabricated Building Market Revenue (Million), by Application 2025 & 2033
- Figure 11: South America US Prefabricated Building Market Revenue Share (%), by Application 2025 & 2033
- Figure 12: South America US Prefabricated Building Market Revenue (Million), by Country 2025 & 2033
- Figure 13: South America US Prefabricated Building Market Revenue Share (%), by Country 2025 & 2033
- Figure 14: Europe US Prefabricated Building Market Revenue (Million), by Type 2025 & 2033
- Figure 15: Europe US Prefabricated Building Market Revenue Share (%), by Type 2025 & 2033
- Figure 16: Europe US Prefabricated Building Market Revenue (Million), by Application 2025 & 2033
- Figure 17: Europe US Prefabricated Building Market Revenue Share (%), by Application 2025 & 2033
- Figure 18: Europe US Prefabricated Building Market Revenue (Million), by Country 2025 & 2033
- Figure 19: Europe US Prefabricated Building Market Revenue Share (%), by Country 2025 & 2033
- Figure 20: Middle East & Africa US Prefabricated Building Market Revenue (Million), by Type 2025 & 2033
- Figure 21: Middle East & Africa US Prefabricated Building Market Revenue Share (%), by Type 2025 & 2033
- Figure 22: Middle East & Africa US Prefabricated Building Market Revenue (Million), by Application 2025 & 2033
- Figure 23: Middle East & Africa US Prefabricated Building Market Revenue Share (%), by Application 2025 & 2033
- Figure 24: Middle East & Africa US Prefabricated Building Market Revenue (Million), by Country 2025 & 2033
- Figure 25: Middle East & Africa US Prefabricated Building Market Revenue Share (%), by Country 2025 & 2033
- Figure 26: Asia Pacific US Prefabricated Building Market Revenue (Million), by Type 2025 & 2033
- Figure 27: Asia Pacific US Prefabricated Building Market Revenue Share (%), by Type 2025 & 2033
- Figure 28: Asia Pacific US Prefabricated Building Market Revenue (Million), by Application 2025 & 2033
- Figure 29: Asia Pacific US Prefabricated Building Market Revenue Share (%), by Application 2025 & 2033
- Figure 30: Asia Pacific US Prefabricated Building Market Revenue (Million), by Country 2025 & 2033
- Figure 31: Asia Pacific US Prefabricated Building Market Revenue Share (%), by Country 2025 & 2033
List of Tables
- Table 1: Global US Prefabricated Building Market Revenue Million Forecast, by Type 2020 & 2033
- Table 2: Global US Prefabricated Building Market Revenue Million Forecast, by Application 2020 & 2033
- Table 3: Global US Prefabricated Building Market Revenue Million Forecast, by Region 2020 & 2033
- Table 4: Global US Prefabricated Building Market Revenue Million Forecast, by Type 2020 & 2033
- Table 5: Global US Prefabricated Building Market Revenue Million Forecast, by Application 2020 & 2033
- Table 6: Global US Prefabricated Building Market Revenue Million Forecast, by Country 2020 & 2033
- Table 7: United States US Prefabricated Building Market Revenue (Million) Forecast, by Application 2020 & 2033
- Table 8: Canada US Prefabricated Building Market Revenue (Million) Forecast, by Application 2020 & 2033
- Table 9: Mexico US Prefabricated Building Market Revenue (Million) Forecast, by Application 2020 & 2033
- Table 10: Global US Prefabricated Building Market Revenue Million Forecast, by Type 2020 & 2033
- Table 11: Global US Prefabricated Building Market Revenue Million Forecast, by Application 2020 & 2033
- Table 12: Global US Prefabricated Building Market Revenue Million Forecast, by Country 2020 & 2033
- Table 13: Brazil US Prefabricated Building Market Revenue (Million) Forecast, by Application 2020 & 2033
- Table 14: Argentina US Prefabricated Building Market Revenue (Million) Forecast, by Application 2020 & 2033
- Table 15: Rest of South America US Prefabricated Building Market Revenue (Million) Forecast, by Application 2020 & 2033
- Table 16: Global US Prefabricated Building Market Revenue Million Forecast, by Type 2020 & 2033
- Table 17: Global US Prefabricated Building Market Revenue Million Forecast, by Application 2020 & 2033
- Table 18: Global US Prefabricated Building Market Revenue Million Forecast, by Country 2020 & 2033
- Table 19: United Kingdom US Prefabricated Building Market Revenue (Million) Forecast, by Application 2020 & 2033
- Table 20: Germany US Prefabricated Building Market Revenue (Million) Forecast, by Application 2020 & 2033
- Table 21: France US Prefabricated Building Market Revenue (Million) Forecast, by Application 2020 & 2033
- Table 22: Italy US Prefabricated Building Market Revenue (Million) Forecast, by Application 2020 & 2033
- Table 23: Spain US Prefabricated Building Market Revenue (Million) Forecast, by Application 2020 & 2033
- Table 24: Russia US Prefabricated Building Market Revenue (Million) Forecast, by Application 2020 & 2033
- Table 25: Benelux US Prefabricated Building Market Revenue (Million) Forecast, by Application 2020 & 2033
- Table 26: Nordics US Prefabricated Building Market Revenue (Million) Forecast, by Application 2020 & 2033
- Table 27: Rest of Europe US Prefabricated Building Market Revenue (Million) Forecast, by Application 2020 & 2033
- Table 28: Global US Prefabricated Building Market Revenue Million Forecast, by Type 2020 & 2033
- Table 29: Global US Prefabricated Building Market Revenue Million Forecast, by Application 2020 & 2033
- Table 30: Global US Prefabricated Building Market Revenue Million Forecast, by Country 2020 & 2033
- Table 31: Turkey US Prefabricated Building Market Revenue (Million) Forecast, by Application 2020 & 2033
- Table 32: Israel US Prefabricated Building Market Revenue (Million) Forecast, by Application 2020 & 2033
- Table 33: GCC US Prefabricated Building Market Revenue (Million) Forecast, by Application 2020 & 2033
- Table 34: North Africa US Prefabricated Building Market Revenue (Million) Forecast, by Application 2020 & 2033
- Table 35: South Africa US Prefabricated Building Market Revenue (Million) Forecast, by Application 2020 & 2033
- Table 36: Rest of Middle East & Africa US Prefabricated Building Market Revenue (Million) Forecast, by Application 2020 & 2033
- Table 37: Global US Prefabricated Building Market Revenue Million Forecast, by Type 2020 & 2033
- Table 38: Global US Prefabricated Building Market Revenue Million Forecast, by Application 2020 & 2033
- Table 39: Global US Prefabricated Building Market Revenue Million Forecast, by Country 2020 & 2033
- Table 40: China US Prefabricated Building Market Revenue (Million) Forecast, by Application 2020 & 2033
- Table 41: India US Prefabricated Building Market Revenue (Million) Forecast, by Application 2020 & 2033
- Table 42: Japan US Prefabricated Building Market Revenue (Million) Forecast, by Application 2020 & 2033
- Table 43: South Korea US Prefabricated Building Market Revenue (Million) Forecast, by Application 2020 & 2033
- Table 44: ASEAN US Prefabricated Building Market Revenue (Million) Forecast, by Application 2020 & 2033
- Table 45: Oceania US Prefabricated Building Market Revenue (Million) Forecast, by Application 2020 & 2033
- Table 46: Rest of Asia Pacific US Prefabricated Building Market Revenue (Million) Forecast, by Application 2020 & 2033
Frequently Asked Questions
1. What is the projected Compound Annual Growth Rate (CAGR) of the US Prefabricated Building Market?
The projected CAGR is approximately > 6.00%.
2. Which companies are prominent players in the US Prefabricated Building Market?
Key companies in the market include Safety Storage Inc, Southern Structures Inc, PortaFab Corp, Shea Concrete Products Inc, Walters Buildings, Commercial Structures Corp, Rubb Building Systems, Modular Connections LLC**List Not Exhaustive, Deluxe Building Solutions, Panel Built Inc.
3. What are the main segments of the US Prefabricated Building Market?
The market segments include Type, Application.
4. Can you provide details about the market size?
The market size is estimated to be USD XX Million as of 2022.
5. What are some drivers contributing to market growth?
4.; Expansion of Mass Township Projects4.; Growing adoption of modular construction in the hospitality sector.
6. What are the notable trends driving market growth?
Increased Demand for Residential Houses Driving the Market.
7. Are there any restraints impacting market growth?
4.; Logitsics and transport issue4.; Volatility in raw material prices.
8. Can you provide examples of recent developments in the market?
October 2022: Knauf is at the forefront of the change in timber frame construction. This development toward prefabricated and modular building systems is being driven by a unique partnership between Knauf Gips and Knauf Insulation within the Knauf Group, creating a wall system that is prepared for the future of timber frame construction and prefabrication. The approach provides a single point of contact for specialized builders, developers, and architects to get high-quality timber frame walls from a reliable partner.
9. What pricing options are available for accessing the report?
Pricing options include single-user, multi-user, and enterprise licenses priced at USD 3800, USD 4500, and USD 5800 respectively.
10. Is the market size provided in terms of value or volume?
The market size is provided in terms of value, measured in Million.
11. Are there any specific market keywords associated with the report?
Yes, the market keyword associated with the report is "US Prefabricated Building Market," which aids in identifying and referencing the specific market segment covered.
12. How do I determine which pricing option suits my needs best?
The pricing options vary based on user requirements and access needs. Individual users may opt for single-user licenses, while businesses requiring broader access may choose multi-user or enterprise licenses for cost-effective access to the report.
13. Are there any additional resources or data provided in the US Prefabricated Building Market report?
While the report offers comprehensive insights, it's advisable to review the specific contents or supplementary materials provided to ascertain if additional resources or data are available.
14. How can I stay updated on further developments or reports in the US Prefabricated Building Market?
To stay informed about further developments, trends, and reports in the US Prefabricated Building Market, consider subscribing to industry newsletters, following relevant companies and organizations, or regularly checking reputable industry news sources and publications.
Methodology
Step 1 - Identification of Relevant Samples Size from Population Database


Step 2 - Approaches for Defining Global Market Size (Value, Volume* & Price*)

Note*: In applicable scenarios
Step 3 - Data Sources
Primary Research
- Web Analytics
- Survey Reports
- Research Institute
- Latest Research Reports
- Opinion Leaders
Secondary Research
- Annual Reports
- White Paper
- Latest Press Release
- Industry Association
- Paid Database
- Investor Presentations

Step 4 - Data Triangulation
Involves using different sources of information in order to increase the validity of a study
These sources are likely to be stakeholders in a program - participants, other researchers, program staff, other community members, and so on.
Then we put all data in single framework & apply various statistical tools to find out the dynamic on the market.
During the analysis stage, feedback from the stakeholder groups would be compared to determine areas of agreement as well as areas of divergence