

Key Insights
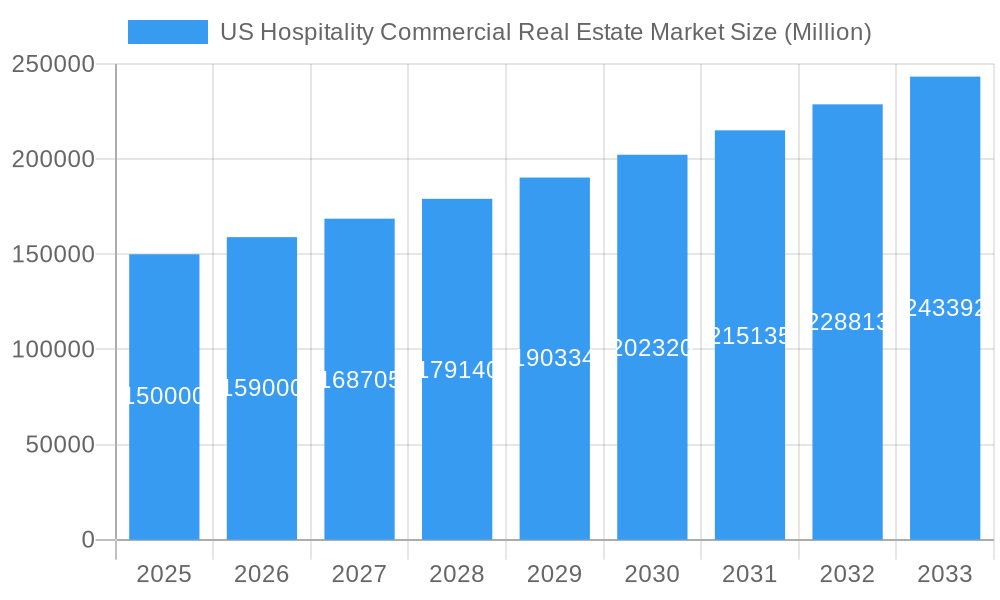
The US Hospitality Commercial Real Estate market is experiencing robust growth, projected to maintain a Compound Annual Growth Rate (CAGR) exceeding 5.5% from 2025 to 2033. This expansion is fueled by several key drivers, including a resurgence in domestic and international travel post-pandemic, increasing demand for unique and experiential hospitality offerings (such as wellness retreats and boutique hotels), and continued investment in property renovations and expansions. The market is segmented by property type, with Hotels and Accommodation holding the largest share, followed by Spas and Resorts and Other Property Types. Significant players like Wyndham, IHG, Hilton, and Marriott International are shaping the competitive landscape, although the market shows moderate concentration, allowing for growth opportunities for smaller, specialized firms. Regional variations exist, with the Northeast and Southeast likely exhibiting stronger growth due to established tourism infrastructure and population density. However, the Midwest and Southwest are also expected to witness significant development, driven by rising disposable incomes and increased investment in leisure and tourism infrastructure. While challenges remain, such as rising interest rates and potential economic fluctuations, the overall market outlook for the US Hospitality Commercial Real Estate sector remains positive, driven by a consistent demand for diverse hospitality experiences.
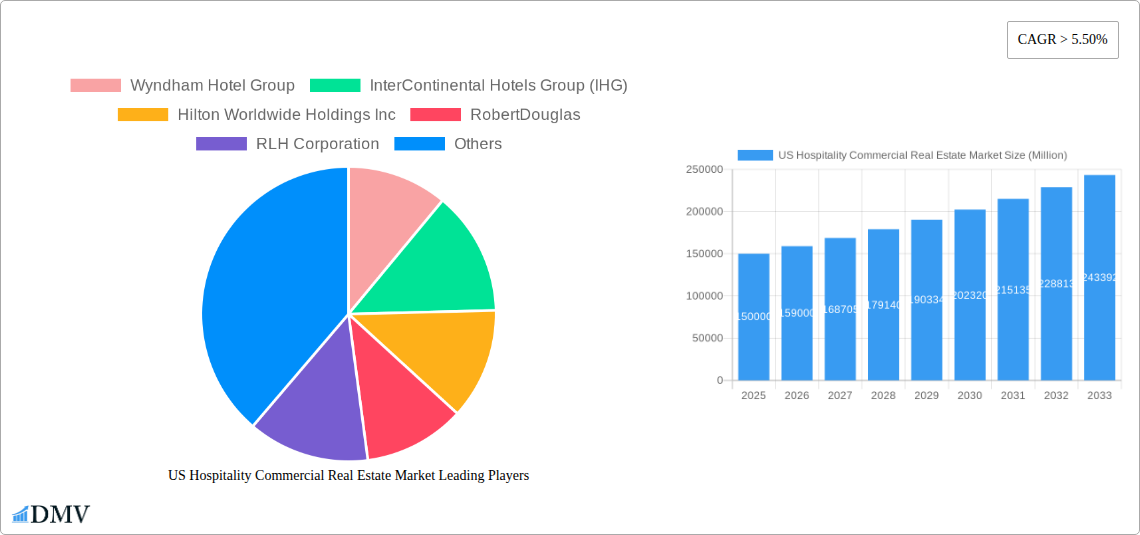
US Hospitality Commercial Real Estate Market Market Size (In Billion)
The forecast period, 2025-2033, anticipates continued market expansion, albeit at a potentially moderating pace towards the later years as the initial post-pandemic boom stabilizes. Factors influencing growth trajectory include the ongoing evolution of consumer preferences, the impact of sustainable tourism practices, and technological advancements in hospitality management. The competitive landscape will continue to see strategic mergers and acquisitions, as well as the emergence of innovative business models designed to cater to evolving traveler expectations. Careful monitoring of economic indicators and adaptation to shifts in consumer demand will be crucial for sustained success within this dynamic sector. Further segmentation analysis is needed to fully understand the specific performance of each property type across various geographic locations.
US Hospitality Commercial Real Estate Market Company Market Share
US Hospitality Commercial Real Estate Market: A Comprehensive Market Report (2019-2033)
This insightful report provides a detailed analysis of the US Hospitality Commercial Real Estate Market, offering a comprehensive overview of its current state, future trajectory, and key players. Covering the period from 2019 to 2033, with a base year of 2025 and a forecast period spanning 2025-2033, this report is an indispensable resource for investors, stakeholders, and industry professionals seeking to navigate this dynamic sector. The market is valued at xx Million in 2025 and is projected to reach xx Million by 2033, exhibiting a robust CAGR of xx%.
US Hospitality Commercial Real Estate Market Composition & Trends
This section dives deep into the market's intricate structure, examining market concentration, innovation drivers, regulatory hurdles, substitute offerings, and the evolving landscape of M&A activity. We analyze the market share distribution among key players like Marriott International, Hilton Worldwide Holdings Inc, and Wyndham Hotel Group, revealing a moderately concentrated market with significant opportunities for growth and consolidation. M&A deal values are assessed, revealing trends in investment strategies and market valuations. The impact of regulatory changes, such as zoning laws and environmental regulations, on market dynamics is thoroughly explored.
- Market Concentration: The US hospitality CRE market exhibits a moderately concentrated structure, with the top five players holding approximately xx% of the market share in 2025.
- Innovation Catalysts: Technological advancements in hotel management systems, online booking platforms, and personalized guest experiences are driving market innovation.
- Regulatory Landscape: Stringent building codes, environmental regulations, and zoning laws significantly impact development costs and project timelines.
- Substitute Products: The rise of alternative accommodation options, such as Airbnb, presents a competitive challenge to traditional hotels.
- End-User Profiles: The report segments end-users based on demographics, travel preferences, and spending patterns, providing valuable insights into market demand.
- M&A Activity: Analysis of recent M&A deals, including their values (xx Million in total deal value in 2024) and strategic implications, reveals shifting market dynamics and investment priorities.
US Hospitality Commercial Real Estate Market Industry Evolution
This section meticulously charts the evolution of the US hospitality CRE market, tracing its growth trajectory from 2019 to 2033. We delve into the impact of technological advancements, such as the proliferation of smart hotel technologies and the increasing adoption of data analytics, on market growth. The analysis considers shifting consumer preferences, such as the growing demand for sustainable and experiential travel, and their influence on investment strategies and hotel development. Growth rates and adoption metrics for key technologies are presented, offering quantitative insights into the market’s dynamic evolution. The market experienced a xx% growth rate from 2019 to 2024 and is projected to grow at xx% from 2025 to 2033.
Leading Regions, Countries, or Segments in US Hospitality Commercial Real Estate Market
This section identifies the dominant regions and segments within the US hospitality CRE market. While the entire US contributes, certain areas experience disproportionately high growth and investment. The analysis focuses on By Property Type: Hotels and Accommodation, Spas and Resorts, and Other Property Types, highlighting the factors that contribute to their success.
- Hotels and Accommodation: This segment dominates the market, driven by robust tourism growth and increasing business travel.
- Key Drivers: Strong domestic and international tourism, increasing demand for budget-friendly and luxury accommodations, government incentives for tourism infrastructure development.
- Spas and Resorts: This segment shows steady growth, propelled by the rising demand for wellness tourism and luxury experiences.
- Key Drivers: Growing disposable incomes, increasing health consciousness, and the development of unique resort experiences focusing on relaxation and rejuvenation.
- Other Property Types: This includes unique hospitality properties with significant growth potential (e.g., boutique hotels, glamping sites).
- Key Drivers: Growing demand for unique travel experiences, increasing popularity of eco-tourism, and innovative approaches to hospitality.
US Hospitality Commercial Real Estate Market Product Innovations
This section explores recent product innovations in the US hospitality CRE market. The focus is on cutting-edge technologies, such as AI-powered guest services, personalized room controls, and advanced booking systems that enhance guest experiences and optimize operational efficiency. Unique selling propositions and advancements in sustainable practices are highlighted, showcasing the sector's commitment to innovation and sustainability. For example, the adoption of smart room technology has seen a xx% increase since 2020.
Propelling Factors for US Hospitality Commercial Real Estate Market Growth
Several factors are driving the expansion of the US hospitality CRE market. Technological advancements, economic growth, and favorable regulatory environments are key contributors. Examples include the rise of online travel agencies (OTAs), increasing disposable income, and government support for tourism infrastructure.
Obstacles in the US Hospitality Commercial Real Estate Market Market
The US hospitality CRE market faces challenges, including regulatory hurdles, supply chain disruptions, and intense competition. These obstacles impact construction costs, project timelines, and profitability. For instance, supply chain bottlenecks have led to a xx% increase in construction costs in 2024.
Future Opportunities in US Hospitality Commercial Real Estate Market
Future opportunities abound in the US hospitality CRE market. These include untapped markets, emerging technologies, and shifting consumer trends, like the growing interest in sustainable and wellness tourism. The sector's adaptability and innovation will be key to exploiting these opportunities.
Major Players in the US Hospitality Commercial Real Estate Market Ecosystem
- Wyndham Hotel Group
- InterContinental Hotels Group (IHG)
- Hilton Worldwide Holdings Inc
- RobertDouglas
- RLH Corporation
- Best Western Hotels & Resorts
- Marriott International
- Noble Investment Group
- G6 Hospitality
- Choice Hotels International
- Host Hotels & Resorts
- Coast Hotels
- HEI Hotels & Resorts
- Canyon Equity LLC
- DiamondRock Hospitality Company
Key Developments in US Hospitality Commercial Real Estate Market Industry
- January 2024: Marriott International announces a strategic partnership to expand its presence in underserved markets.
- March 2024: Hilton Worldwide Holdings Inc launches a new sustainable hotel initiative.
- June 2024: A significant M&A deal involving two major players reshapes the market landscape. (Further details available in the full report.)
Strategic US Hospitality Commercial Real Estate Market Market Forecast
The US hospitality CRE market is poised for continued growth, driven by sustained economic expansion, technological innovation, and evolving consumer preferences. Opportunities lie in adapting to shifting travel patterns and adopting sustainable practices. The market's long-term outlook remains optimistic, with significant potential for expansion and innovation.
US Hospitality Commercial Real Estate Market Segmentation
-
1. Property Type
- 1.1. Hotels and Accommodation
- 1.2. Spas and Resorts
- 1.3. Other Property Types
US Hospitality Commercial Real Estate Market Segmentation By Geography
-
1. North America
- 1.1. United States
- 1.2. Canada
- 1.3. Mexico
-
2. South America
- 2.1. Brazil
- 2.2. Argentina
- 2.3. Rest of South America
-
3. Europe
- 3.1. United Kingdom
- 3.2. Germany
- 3.3. France
- 3.4. Italy
- 3.5. Spain
- 3.6. Russia
- 3.7. Benelux
- 3.8. Nordics
- 3.9. Rest of Europe
-
4. Middle East & Africa
- 4.1. Turkey
- 4.2. Israel
- 4.3. GCC
- 4.4. North Africa
- 4.5. South Africa
- 4.6. Rest of Middle East & Africa
-
5. Asia Pacific
- 5.1. China
- 5.2. India
- 5.3. Japan
- 5.4. South Korea
- 5.5. ASEAN
- 5.6. Oceania
- 5.7. Rest of Asia Pacific
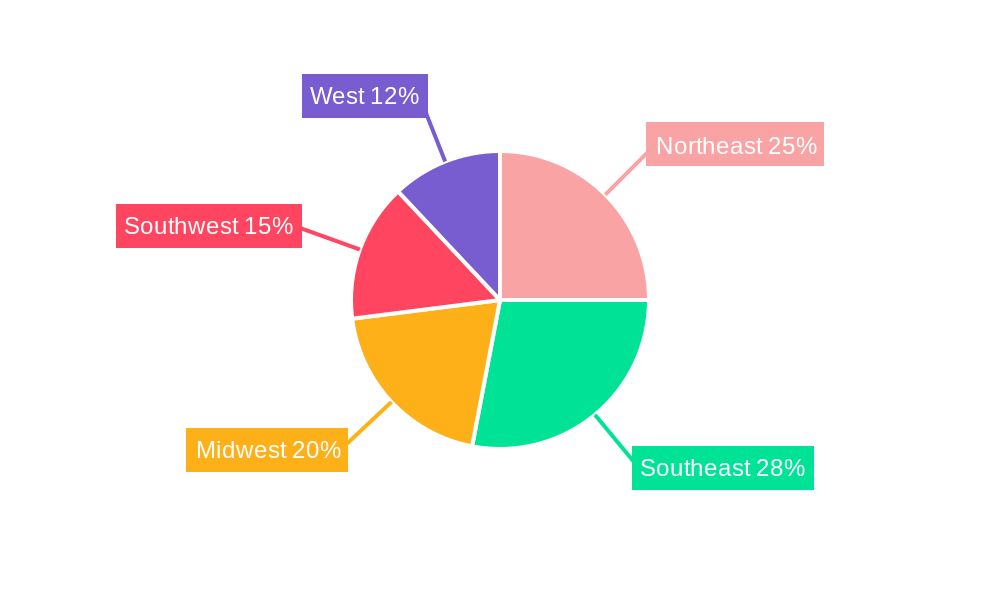
US Hospitality Commercial Real Estate Market Regional Market Share
Geographic Coverage of US Hospitality Commercial Real Estate Market
US Hospitality Commercial Real Estate Market REPORT HIGHLIGHTS
| Aspects | Details |
|---|---|
| Study Period | 2020-2034 |
| Base Year | 2025 |
| Estimated Year | 2026 |
| Forecast Period | 2026-2034 |
| Historical Period | 2020-2025 |
| Growth Rate | CAGR of > 5.50% from 2020-2034 |
| Segmentation |
|
Table of Contents
- 1. Introduction
- 1.1. Research Scope
- 1.2. Market Segmentation
- 1.3. Research Methodology
- 1.4. Definitions and Assumptions
- 2. Executive Summary
- 2.1. Introduction
- 3. Market Dynamics
- 3.1. Introduction
- 3.2. Market Drivers
- 3.3. Market Restrains
- 3.4. Market Trends
- 3.4.1. Increase in Number of Hotels
- 4. Market Factor Analysis
- 4.1. Porters Five Forces
- 4.2. Supply/Value Chain
- 4.3. PESTEL analysis
- 4.4. Market Entropy
- 4.5. Patent/Trademark Analysis
- 5. Global US Hospitality Commercial Real Estate Market Analysis, Insights and Forecast, 2020-2032
- 5.1. Market Analysis, Insights and Forecast - by Property Type
- 5.1.1. Hotels and Accommodation
- 5.1.2. Spas and Resorts
- 5.1.3. Other Property Types
- 5.2. Market Analysis, Insights and Forecast - by Region
- 5.2.1. North America
- 5.2.2. South America
- 5.2.3. Europe
- 5.2.4. Middle East & Africa
- 5.2.5. Asia Pacific
- 5.1. Market Analysis, Insights and Forecast - by Property Type
- 6. North America US Hospitality Commercial Real Estate Market Analysis, Insights and Forecast, 2020-2032
- 6.1. Market Analysis, Insights and Forecast - by Property Type
- 6.1.1. Hotels and Accommodation
- 6.1.2. Spas and Resorts
- 6.1.3. Other Property Types
- 6.1. Market Analysis, Insights and Forecast - by Property Type
- 7. South America US Hospitality Commercial Real Estate Market Analysis, Insights and Forecast, 2020-2032
- 7.1. Market Analysis, Insights and Forecast - by Property Type
- 7.1.1. Hotels and Accommodation
- 7.1.2. Spas and Resorts
- 7.1.3. Other Property Types
- 7.1. Market Analysis, Insights and Forecast - by Property Type
- 8. Europe US Hospitality Commercial Real Estate Market Analysis, Insights and Forecast, 2020-2032
- 8.1. Market Analysis, Insights and Forecast - by Property Type
- 8.1.1. Hotels and Accommodation
- 8.1.2. Spas and Resorts
- 8.1.3. Other Property Types
- 8.1. Market Analysis, Insights and Forecast - by Property Type
- 9. Middle East & Africa US Hospitality Commercial Real Estate Market Analysis, Insights and Forecast, 2020-2032
- 9.1. Market Analysis, Insights and Forecast - by Property Type
- 9.1.1. Hotels and Accommodation
- 9.1.2. Spas and Resorts
- 9.1.3. Other Property Types
- 9.1. Market Analysis, Insights and Forecast - by Property Type
- 10. Asia Pacific US Hospitality Commercial Real Estate Market Analysis, Insights and Forecast, 2020-2032
- 10.1. Market Analysis, Insights and Forecast - by Property Type
- 10.1.1. Hotels and Accommodation
- 10.1.2. Spas and Resorts
- 10.1.3. Other Property Types
- 10.1. Market Analysis, Insights and Forecast - by Property Type
- 11. Competitive Analysis
- 11.1. Global Market Share Analysis 2025
- 11.2. Company Profiles
- 11.2.1 Wyndham Hotel Group
- 11.2.1.1. Overview
- 11.2.1.2. Products
- 11.2.1.3. SWOT Analysis
- 11.2.1.4. Recent Developments
- 11.2.1.5. Financials (Based on Availability)
- 11.2.2 InterContinental Hotels Group (IHG)
- 11.2.2.1. Overview
- 11.2.2.2. Products
- 11.2.2.3. SWOT Analysis
- 11.2.2.4. Recent Developments
- 11.2.2.5. Financials (Based on Availability)
- 11.2.3 Hilton Worldwide Holdings Inc
- 11.2.3.1. Overview
- 11.2.3.2. Products
- 11.2.3.3. SWOT Analysis
- 11.2.3.4. Recent Developments
- 11.2.3.5. Financials (Based on Availability)
- 11.2.4 RobertDouglas
- 11.2.4.1. Overview
- 11.2.4.2. Products
- 11.2.4.3. SWOT Analysis
- 11.2.4.4. Recent Developments
- 11.2.4.5. Financials (Based on Availability)
- 11.2.5 RLH Corporation
- 11.2.5.1. Overview
- 11.2.5.2. Products
- 11.2.5.3. SWOT Analysis
- 11.2.5.4. Recent Developments
- 11.2.5.5. Financials (Based on Availability)
- 11.2.6 Best Western Hotels & Resorts
- 11.2.6.1. Overview
- 11.2.6.2. Products
- 11.2.6.3. SWOT Analysis
- 11.2.6.4. Recent Developments
- 11.2.6.5. Financials (Based on Availability)
- 11.2.7 6 COMPETITVE INTELLIGENCE6 1 Market Concentration6 2 Company profiles
- 11.2.7.1. Overview
- 11.2.7.2. Products
- 11.2.7.3. SWOT Analysis
- 11.2.7.4. Recent Developments
- 11.2.7.5. Financials (Based on Availability)
- 11.2.8 Marriott International
- 11.2.8.1. Overview
- 11.2.8.2. Products
- 11.2.8.3. SWOT Analysis
- 11.2.8.4. Recent Developments
- 11.2.8.5. Financials (Based on Availability)
- 11.2.9 Noble Investment Group
- 11.2.9.1. Overview
- 11.2.9.2. Products
- 11.2.9.3. SWOT Analysis
- 11.2.9.4. Recent Developments
- 11.2.9.5. Financials (Based on Availability)
- 11.2.10 G6 Hospitality
- 11.2.10.1. Overview
- 11.2.10.2. Products
- 11.2.10.3. SWOT Analysis
- 11.2.10.4. Recent Developments
- 11.2.10.5. Financials (Based on Availability)
- 11.2.11 Choice Hotels International
- 11.2.11.1. Overview
- 11.2.11.2. Products
- 11.2.11.3. SWOT Analysis
- 11.2.11.4. Recent Developments
- 11.2.11.5. Financials (Based on Availability)
- 11.2.12 Host Hotels & Resorts
- 11.2.12.1. Overview
- 11.2.12.2. Products
- 11.2.12.3. SWOT Analysis
- 11.2.12.4. Recent Developments
- 11.2.12.5. Financials (Based on Availability)
- 11.2.13 Coast Hotels**List Not Exhaustive
- 11.2.13.1. Overview
- 11.2.13.2. Products
- 11.2.13.3. SWOT Analysis
- 11.2.13.4. Recent Developments
- 11.2.13.5. Financials (Based on Availability)
- 11.2.14 HEI Hotels & Resorts
- 11.2.14.1. Overview
- 11.2.14.2. Products
- 11.2.14.3. SWOT Analysis
- 11.2.14.4. Recent Developments
- 11.2.14.5. Financials (Based on Availability)
- 11.2.15 Canyon Equity LLC
- 11.2.15.1. Overview
- 11.2.15.2. Products
- 11.2.15.3. SWOT Analysis
- 11.2.15.4. Recent Developments
- 11.2.15.5. Financials (Based on Availability)
- 11.2.16 DiamondRock Hospitality Company
- 11.2.16.1. Overview
- 11.2.16.2. Products
- 11.2.16.3. SWOT Analysis
- 11.2.16.4. Recent Developments
- 11.2.16.5. Financials (Based on Availability)
- 11.2.1 Wyndham Hotel Group
List of Figures
- Figure 1: Global US Hospitality Commercial Real Estate Market Revenue Breakdown (Million, %) by Region 2025 & 2033
- Figure 2: North America US Hospitality Commercial Real Estate Market Revenue (Million), by Property Type 2025 & 2033
- Figure 3: North America US Hospitality Commercial Real Estate Market Revenue Share (%), by Property Type 2025 & 2033
- Figure 4: North America US Hospitality Commercial Real Estate Market Revenue (Million), by Country 2025 & 2033
- Figure 5: North America US Hospitality Commercial Real Estate Market Revenue Share (%), by Country 2025 & 2033
- Figure 6: South America US Hospitality Commercial Real Estate Market Revenue (Million), by Property Type 2025 & 2033
- Figure 7: South America US Hospitality Commercial Real Estate Market Revenue Share (%), by Property Type 2025 & 2033
- Figure 8: South America US Hospitality Commercial Real Estate Market Revenue (Million), by Country 2025 & 2033
- Figure 9: South America US Hospitality Commercial Real Estate Market Revenue Share (%), by Country 2025 & 2033
- Figure 10: Europe US Hospitality Commercial Real Estate Market Revenue (Million), by Property Type 2025 & 2033
- Figure 11: Europe US Hospitality Commercial Real Estate Market Revenue Share (%), by Property Type 2025 & 2033
- Figure 12: Europe US Hospitality Commercial Real Estate Market Revenue (Million), by Country 2025 & 2033
- Figure 13: Europe US Hospitality Commercial Real Estate Market Revenue Share (%), by Country 2025 & 2033
- Figure 14: Middle East & Africa US Hospitality Commercial Real Estate Market Revenue (Million), by Property Type 2025 & 2033
- Figure 15: Middle East & Africa US Hospitality Commercial Real Estate Market Revenue Share (%), by Property Type 2025 & 2033
- Figure 16: Middle East & Africa US Hospitality Commercial Real Estate Market Revenue (Million), by Country 2025 & 2033
- Figure 17: Middle East & Africa US Hospitality Commercial Real Estate Market Revenue Share (%), by Country 2025 & 2033
- Figure 18: Asia Pacific US Hospitality Commercial Real Estate Market Revenue (Million), by Property Type 2025 & 2033
- Figure 19: Asia Pacific US Hospitality Commercial Real Estate Market Revenue Share (%), by Property Type 2025 & 2033
- Figure 20: Asia Pacific US Hospitality Commercial Real Estate Market Revenue (Million), by Country 2025 & 2033
- Figure 21: Asia Pacific US Hospitality Commercial Real Estate Market Revenue Share (%), by Country 2025 & 2033
List of Tables
- Table 1: Global US Hospitality Commercial Real Estate Market Revenue Million Forecast, by Property Type 2020 & 2033
- Table 2: Global US Hospitality Commercial Real Estate Market Revenue Million Forecast, by Region 2020 & 2033
- Table 3: Global US Hospitality Commercial Real Estate Market Revenue Million Forecast, by Property Type 2020 & 2033
- Table 4: Global US Hospitality Commercial Real Estate Market Revenue Million Forecast, by Country 2020 & 2033
- Table 5: United States US Hospitality Commercial Real Estate Market Revenue (Million) Forecast, by Application 2020 & 2033
- Table 6: Canada US Hospitality Commercial Real Estate Market Revenue (Million) Forecast, by Application 2020 & 2033
- Table 7: Mexico US Hospitality Commercial Real Estate Market Revenue (Million) Forecast, by Application 2020 & 2033
- Table 8: Global US Hospitality Commercial Real Estate Market Revenue Million Forecast, by Property Type 2020 & 2033
- Table 9: Global US Hospitality Commercial Real Estate Market Revenue Million Forecast, by Country 2020 & 2033
- Table 10: Brazil US Hospitality Commercial Real Estate Market Revenue (Million) Forecast, by Application 2020 & 2033
- Table 11: Argentina US Hospitality Commercial Real Estate Market Revenue (Million) Forecast, by Application 2020 & 2033
- Table 12: Rest of South America US Hospitality Commercial Real Estate Market Revenue (Million) Forecast, by Application 2020 & 2033
- Table 13: Global US Hospitality Commercial Real Estate Market Revenue Million Forecast, by Property Type 2020 & 2033
- Table 14: Global US Hospitality Commercial Real Estate Market Revenue Million Forecast, by Country 2020 & 2033
- Table 15: United Kingdom US Hospitality Commercial Real Estate Market Revenue (Million) Forecast, by Application 2020 & 2033
- Table 16: Germany US Hospitality Commercial Real Estate Market Revenue (Million) Forecast, by Application 2020 & 2033
- Table 17: France US Hospitality Commercial Real Estate Market Revenue (Million) Forecast, by Application 2020 & 2033
- Table 18: Italy US Hospitality Commercial Real Estate Market Revenue (Million) Forecast, by Application 2020 & 2033
- Table 19: Spain US Hospitality Commercial Real Estate Market Revenue (Million) Forecast, by Application 2020 & 2033
- Table 20: Russia US Hospitality Commercial Real Estate Market Revenue (Million) Forecast, by Application 2020 & 2033
- Table 21: Benelux US Hospitality Commercial Real Estate Market Revenue (Million) Forecast, by Application 2020 & 2033
- Table 22: Nordics US Hospitality Commercial Real Estate Market Revenue (Million) Forecast, by Application 2020 & 2033
- Table 23: Rest of Europe US Hospitality Commercial Real Estate Market Revenue (Million) Forecast, by Application 2020 & 2033
- Table 24: Global US Hospitality Commercial Real Estate Market Revenue Million Forecast, by Property Type 2020 & 2033
- Table 25: Global US Hospitality Commercial Real Estate Market Revenue Million Forecast, by Country 2020 & 2033
- Table 26: Turkey US Hospitality Commercial Real Estate Market Revenue (Million) Forecast, by Application 2020 & 2033
- Table 27: Israel US Hospitality Commercial Real Estate Market Revenue (Million) Forecast, by Application 2020 & 2033
- Table 28: GCC US Hospitality Commercial Real Estate Market Revenue (Million) Forecast, by Application 2020 & 2033
- Table 29: North Africa US Hospitality Commercial Real Estate Market Revenue (Million) Forecast, by Application 2020 & 2033
- Table 30: South Africa US Hospitality Commercial Real Estate Market Revenue (Million) Forecast, by Application 2020 & 2033
- Table 31: Rest of Middle East & Africa US Hospitality Commercial Real Estate Market Revenue (Million) Forecast, by Application 2020 & 2033
- Table 32: Global US Hospitality Commercial Real Estate Market Revenue Million Forecast, by Property Type 2020 & 2033
- Table 33: Global US Hospitality Commercial Real Estate Market Revenue Million Forecast, by Country 2020 & 2033
- Table 34: China US Hospitality Commercial Real Estate Market Revenue (Million) Forecast, by Application 2020 & 2033
- Table 35: India US Hospitality Commercial Real Estate Market Revenue (Million) Forecast, by Application 2020 & 2033
- Table 36: Japan US Hospitality Commercial Real Estate Market Revenue (Million) Forecast, by Application 2020 & 2033
- Table 37: South Korea US Hospitality Commercial Real Estate Market Revenue (Million) Forecast, by Application 2020 & 2033
- Table 38: ASEAN US Hospitality Commercial Real Estate Market Revenue (Million) Forecast, by Application 2020 & 2033
- Table 39: Oceania US Hospitality Commercial Real Estate Market Revenue (Million) Forecast, by Application 2020 & 2033
- Table 40: Rest of Asia Pacific US Hospitality Commercial Real Estate Market Revenue (Million) Forecast, by Application 2020 & 2033
Frequently Asked Questions
1. What is the projected Compound Annual Growth Rate (CAGR) of the US Hospitality Commercial Real Estate Market?
The projected CAGR is approximately > 5.50%.
2. Which companies are prominent players in the US Hospitality Commercial Real Estate Market?
Key companies in the market include Wyndham Hotel Group, InterContinental Hotels Group (IHG), Hilton Worldwide Holdings Inc, RobertDouglas, RLH Corporation, Best Western Hotels & Resorts, 6 COMPETITVE INTELLIGENCE6 1 Market Concentration6 2 Company profiles, Marriott International, Noble Investment Group, G6 Hospitality, Choice Hotels International, Host Hotels & Resorts, Coast Hotels**List Not Exhaustive, HEI Hotels & Resorts, Canyon Equity LLC, DiamondRock Hospitality Company.
3. What are the main segments of the US Hospitality Commercial Real Estate Market?
The market segments include Property Type.
4. Can you provide details about the market size?
The market size is estimated to be USD XX Million as of 2022.
5. What are some drivers contributing to market growth?
N/A
6. What are the notable trends driving market growth?
Increase in Number of Hotels.
7. Are there any restraints impacting market growth?
N/A
8. Can you provide examples of recent developments in the market?
N/A
9. What pricing options are available for accessing the report?
Pricing options include single-user, multi-user, and enterprise licenses priced at USD 3800, USD 4500, and USD 5800 respectively.
10. Is the market size provided in terms of value or volume?
The market size is provided in terms of value, measured in Million.
11. Are there any specific market keywords associated with the report?
Yes, the market keyword associated with the report is "US Hospitality Commercial Real Estate Market," which aids in identifying and referencing the specific market segment covered.
12. How do I determine which pricing option suits my needs best?
The pricing options vary based on user requirements and access needs. Individual users may opt for single-user licenses, while businesses requiring broader access may choose multi-user or enterprise licenses for cost-effective access to the report.
13. Are there any additional resources or data provided in the US Hospitality Commercial Real Estate Market report?
While the report offers comprehensive insights, it's advisable to review the specific contents or supplementary materials provided to ascertain if additional resources or data are available.
14. How can I stay updated on further developments or reports in the US Hospitality Commercial Real Estate Market?
To stay informed about further developments, trends, and reports in the US Hospitality Commercial Real Estate Market, consider subscribing to industry newsletters, following relevant companies and organizations, or regularly checking reputable industry news sources and publications.
Methodology
Step 1 - Identification of Relevant Samples Size from Population Database


Step 2 - Approaches for Defining Global Market Size (Value, Volume* & Price*)

Note*: In applicable scenarios
Step 3 - Data Sources
Primary Research
- Web Analytics
- Survey Reports
- Research Institute
- Latest Research Reports
- Opinion Leaders
Secondary Research
- Annual Reports
- White Paper
- Latest Press Release
- Industry Association
- Paid Database
- Investor Presentations

Step 4 - Data Triangulation
Involves using different sources of information in order to increase the validity of a study
These sources are likely to be stakeholders in a program - participants, other researchers, program staff, other community members, and so on.
Then we put all data in single framework & apply various statistical tools to find out the dynamic on the market.
During the analysis stage, feedback from the stakeholder groups would be compared to determine areas of agreement as well as areas of divergence