

Key Insights
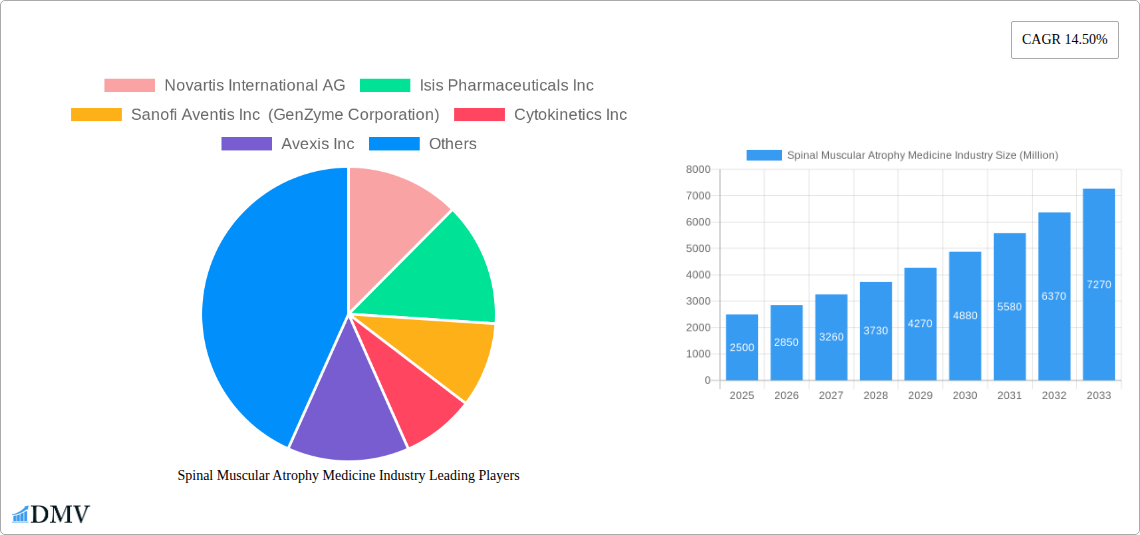
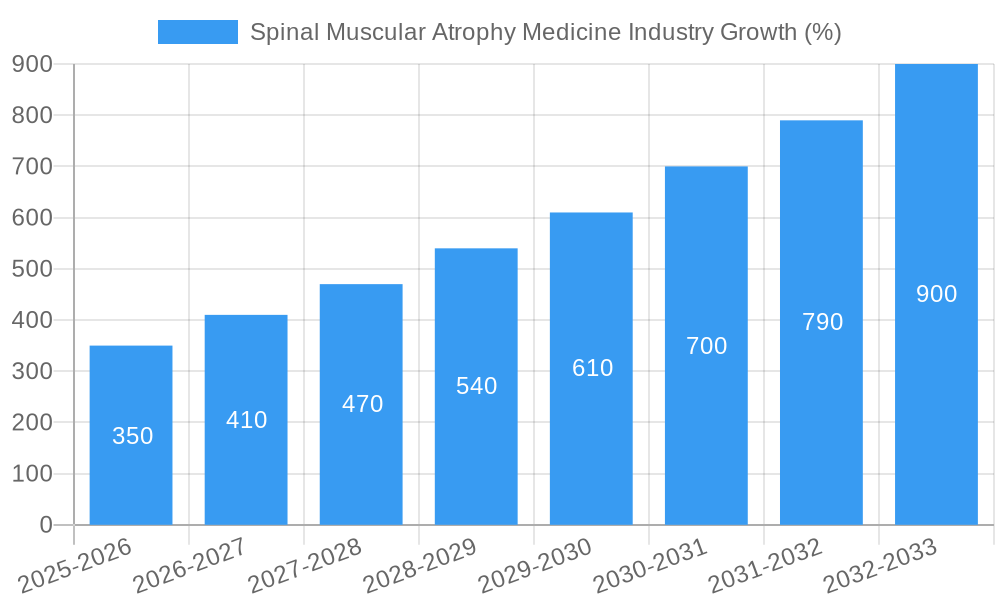
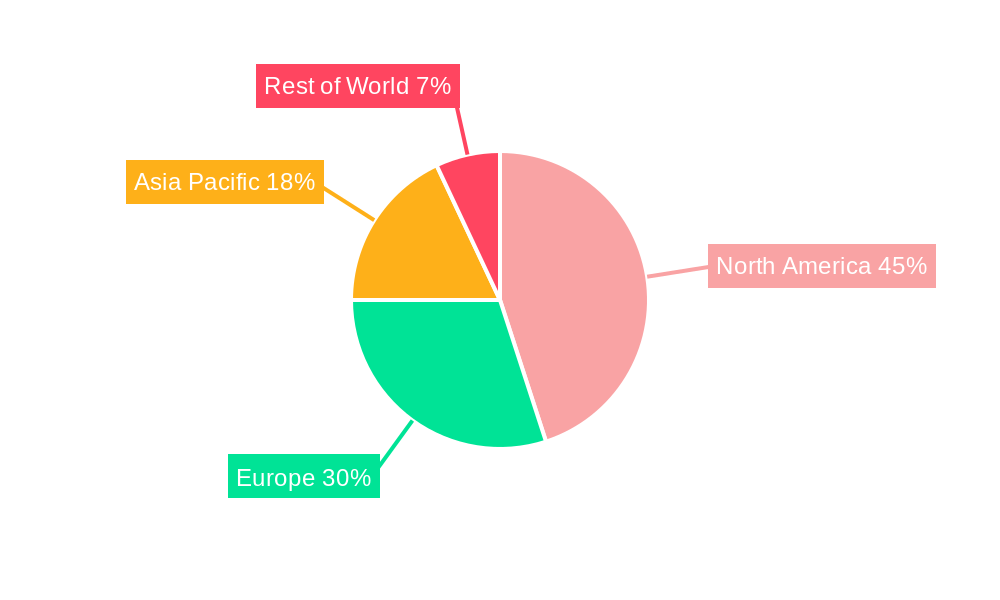
The Spinal Muscular Atrophy (SMA) medicine market is experiencing robust growth, driven by increasing prevalence of SMA, advancements in gene therapy, and the rising awareness among patients and healthcare professionals. The market's Compound Annual Growth Rate (CAGR) of 14.50% from 2019 to 2024 suggests a significant expansion, and this momentum is expected to continue throughout the forecast period (2025-2033). Key factors contributing to this growth include the development and approval of highly effective therapies like nusinersen (Spinraza) and onasemnogene abeparvovec-xioi (Zolgensma), which offer improved survival rates and quality of life for SMA patients. The market is segmented by route of administration (oral, intrathecal), type of therapy (various types reflecting different treatment approaches), and procedure (gene replacement therapy, drug therapy, and other procedures). The substantial investment in research and development, along with supportive regulatory frameworks globally, further fuels market expansion. While the high cost of these advanced therapies presents a restraint, the long-term benefits and improved patient outcomes are likely to outweigh this factor, driving sustained demand. North America, particularly the United States, currently holds a significant market share due to higher healthcare expenditure and the presence of major pharmaceutical companies, but the Asia-Pacific region is poised for significant growth, driven by increasing awareness and rising disposable incomes. The competitive landscape is characterized by the presence of established pharmaceutical giants such as Novartis, Biogen, and Roche, alongside emerging biotech companies specializing in SMA therapies. The increasing focus on personalized medicine and the development of novel therapies targeting specific SMA subtypes will further shape the market's trajectory in the coming years.
The future of the SMA medicine market hinges on continued innovation in therapeutic approaches. Ongoing clinical trials are exploring new treatment modalities and potential improvements to existing therapies, which could lead to even better patient outcomes. Furthermore, the expansion of access to these expensive treatments in emerging markets remains crucial. Initiatives focused on increasing affordability and improving healthcare infrastructure in these regions will play a vital role in broadening the reach of SMA therapies and contributing to further market growth. The successful commercialization of new therapies and the ongoing research into potential cures will be key factors in shaping the market landscape during the forecast period. Increased investment in early diagnosis and newborn screening programs is also crucial in optimizing treatment outcomes and expanding the addressable market.
Spinal Muscular Atrophy (SMA) Medicine Industry Market Report: 2019-2033
This comprehensive report provides a detailed analysis of the Spinal Muscular Atrophy (SMA) medicine market, offering invaluable insights for stakeholders across the pharmaceutical and healthcare sectors. The study period spans from 2019 to 2033, with 2025 serving as the base and estimated year. The forecast period covers 2025-2033, while the historical period encompasses 2019-2024. The report projects a market valuation exceeding xx Million by 2033, driven by significant advancements in treatment modalities and increasing prevalence of SMA.
Spinal Muscular Atrophy Medicine Industry Market Composition & Trends
The SMA medicine market is characterized by a moderately concentrated landscape with key players like Novartis, Roche, Biogen, and Pfizer holding significant market share. Market share distribution in 2025 is estimated as follows: Novartis (xx%), Roche (xx%), Biogen (xx%), Pfizer (xx%), Others (xx%). Innovation is a key driver, fueled by ongoing research into gene therapies and novel drug mechanisms. The regulatory landscape is evolving, with agencies like the FDA and EMA playing a crucial role in approving new treatments. Substitute products are limited, creating a high-value market for effective SMA treatments. The end-user profile primarily consists of specialized hospitals, clinics, and healthcare providers catering to patients with SMA. M&A activity has been significant, with deal values exceeding xx Million in the past five years, reflecting the industry's growth potential.
- Market Concentration: Moderately concentrated with a few dominant players.
- Innovation Catalysts: Gene therapy advancements, novel drug mechanisms.
- Regulatory Landscape: Stringent approval processes by FDA, EMA, and other global regulatory bodies.
- Substitute Products: Limited, driving market value.
- End-User Profile: Specialized hospitals, clinics, and healthcare providers.
- M&A Activity: Significant, with total deal values exceeding xx Million in recent years.
Spinal Muscular Atrophy Medicine Industry Evolution
The SMA medicine market has witnessed exponential growth over the past decade, driven by several key factors. The approval of novel therapies, including gene replacement therapies and disease-modifying drugs, has significantly altered the treatment landscape and improved patient outcomes. Technological advancements in gene editing and drug delivery mechanisms have also contributed to this growth. Furthermore, increasing awareness of SMA and improved diagnostic capabilities have led to earlier diagnosis and treatment initiation, which is positively impacting market growth. The market is also witnessing a shift towards personalized medicine approaches, tailoring treatments to specific patient needs. From 2019 to 2024, the CAGR was approximately xx%, and it's projected to reach xx% from 2025 to 2033, driven by new drug launches and expanded patient access. The adoption rate of newer therapies is steadily increasing, with xx% market penetration projected by 2033.
Leading Regions, Countries, or Segments in Spinal Muscular Atrophy Medicine Industry
The North American region currently holds the largest market share, driven by high healthcare expenditure, advanced healthcare infrastructure, and early adoption of innovative therapies. Within North America, the United States dominates due to the high prevalence of SMA and robust regulatory support. Other significant regions include Europe and Asia-Pacific, witnessing rapid growth fueled by increasing awareness and expanding healthcare access.
By Route of Administration:
- Intrathecal: Dominates due to efficacy in delivering drugs to the central nervous system.
- Oral: Growing segment, driven by improved convenience and patient compliance.
By Type: (Specific types are not provided in the prompt, using placeholders)
- Type 1: Largest segment due to higher prevalence and severity.
- Type 2: Significant segment with a growing patient population.
- Type 3: Growing segment due to increased diagnosis and milder disease progression.
- Type 4: Smaller segment representing adult-onset SMA.
By Procedure:
- Gene Replacement Therapy: High growth potential due to its disease-modifying capabilities.
- Drug Therapy: Significant segment, encompassing various approaches to manage disease symptoms.
- Other Procedures: Smaller segment comprising supportive care and other therapies.
Key Drivers:
- High healthcare expenditure in developed countries: driving adoption of advanced therapies.
- Favorable regulatory environment: facilitating faster approvals of new treatments.
- Increased prevalence and awareness of SMA: leading to earlier diagnosis and treatment initiation.
- Growing research and development investments: fueling innovation in treatment modalities.
Spinal Muscular Atrophy Medicine Industry Product Innovations
Recent advancements have focused on improving efficacy, safety, and convenience of SMA treatments. This includes the development of more effective gene therapies with enhanced delivery mechanisms, as well as the creation of novel oral formulations for better patient compliance. Unique selling propositions often highlight improved efficacy, reduced side effects, or easier administration compared to existing treatments. Technological innovations in gene editing, drug delivery, and biomarker development are pivotal in shaping this landscape.
Propelling Factors for Spinal Muscular Atrophy Medicine Industry Growth
Several factors are driving growth in the SMA medicine market. Technological advancements in gene therapy and drug delivery have led to the development of more effective treatments, improving patient outcomes and increasing market demand. Favorable regulatory environments in many countries are facilitating faster approvals of new drugs, further boosting market expansion. Increasing awareness and early diagnosis of SMA among healthcare professionals and the public are contributing to a larger patient pool. Finally, substantial investment in research and development activities continues to fuel the pipeline of novel therapies.
Obstacles in the Spinal Muscular Atrophy Medicine Industry Market
High costs associated with SMA treatments represent a significant barrier to market penetration, especially in resource-constrained healthcare settings. Regulatory hurdles, including stringent approval processes and post-market surveillance requirements, can delay market entry for new therapies. Supply chain disruptions can also impact treatment availability and affordability. Furthermore, intense competition among established pharmaceutical companies and emerging biotech firms poses a challenge to market expansion.
Future Opportunities in Spinal Muscular Atrophy Medicine Industry
Future opportunities lie in the development of more affordable and accessible treatments, including novel oral formulations and improved gene therapy delivery systems. Expanding access to SMA therapies in underserved regions and improving patient education and support are also promising avenues. Further research into the underlying mechanisms of SMA could also lead to the development of novel therapeutic targets and treatment strategies.
Major Players in the Spinal Muscular Atrophy Medicine Industry Ecosystem
- Novartis International AG
- Isis Pharmaceuticals Inc
- Sanofi Aventis Inc (GenZyme Corporation)
- Cytokinetics Inc
- Avexis Inc
- Biogen Inc
- Catalyst Pharmaceutical
- F Hoffmann - La Roche Ltd
- Chugai Pharmaceutical
- Pfizer Inc
Key Developments in Spinal Muscular Atrophy Medicine Industry Industry
- August 2021: Novartis announced the lift of a partial clinical trial hold and planned to initiate a new, pivotal Phase 3 study of intrathecal OAV-101 in older patients with spinal muscular atrophy. This highlights ongoing efforts to expand treatment options to broader patient populations.
- July 2021: Roche launched Evrysdi in India, expanding access to this medication for adults and children aged two months and older. This demonstrates the commitment to increase global reach and improve accessibility of SMA therapies.
Strategic Spinal Muscular Atrophy Medicine Industry Market Forecast
The SMA medicine market is poised for continued growth, driven by technological advancements, increasing awareness, and favorable regulatory support. The development of new and improved therapies, along with expanding market access, will contribute to significant market expansion over the forecast period. The projected growth trajectory points towards substantial market value and a positive outlook for innovative companies involved in SMA treatment development and commercialization.
Spinal Muscular Atrophy Medicine Industry Segmentation
-
1. Type
- 1.1. Type 1
- 1.2. Type 2
- 1.3. Type 3
- 1.4. Type 4
-
2. Procedure
- 2.1. Gene Replacement Therapy
- 2.2. Drug Therapy
- 2.3. Other Procedures
-
3. Route of Administration
- 3.1. Oral
- 3.2. Intrathecal
Spinal Muscular Atrophy Medicine Industry Segmentation By Geography
-
1. North America
- 1.1. United States
- 1.2. Canada
- 1.3. Mexico
-
2. Europe
- 2.1. Germany
- 2.2. United Kingdom
- 2.3. France
- 2.4. Italy
- 2.5. Spain
- 2.6. Rest of Europe
-
3. Asia Pacific
- 3.1. China
- 3.2. Japan
- 3.3. India
- 3.4. Australia
- 3.5. South Korea
- 3.6. Rest of Asia Pacific
-
4. Middle East and Africa
- 4.1. GCC
- 4.2. South Africa
- 4.3. Rest of Middle East and Africa
-
5. South America
- 5.1. Brazil
- 5.2. Argentina
- 5.3. Rest of South America
Spinal Muscular Atrophy Medicine Industry REPORT HIGHLIGHTS
| Aspects | Details |
|---|---|
| Study Period | 2019-2033 |
| Base Year | 2024 |
| Estimated Year | 2025 |
| Forecast Period | 2025-2033 |
| Historical Period | 2019-2024 |
| Growth Rate | CAGR of 14.50% from 2019-2033 |
| Segmentation |
|
Table of Contents
- 1. Introduction
- 1.1. Research Scope
- 1.2. Market Segmentation
- 1.3. Research Methodology
- 1.4. Definitions and Assumptions
- 2. Executive Summary
- 2.1. Introduction
- 3. Market Dynamics
- 3.1. Introduction
- 3.2. Market Drivers
- 3.2.1 Growing Awareness Regarding Spinal Muscular Atrophy
- 3.2.2 Its Diagnostics
- 3.2.3 and Its Treatment; Rise in the Government Initiatives to Improve Healthcare Infrastructure; Increasing R&D Activities to Develop Novel Treatment Regimens for Rare Diseases
- 3.3. Market Restrains
- 3.3.1. High Cost of Treatment; Lack of Skilled Professionals for Surgical Procedures and Physiotherapy Regimens
- 3.4. Market Trends
- 3.4.1 The Gene Replacement Therapy Segment Dominates the Market
- 3.4.2 and the Same is Expected Over the Forecast Period
- 4. Market Factor Analysis
- 4.1. Porters Five Forces
- 4.2. Supply/Value Chain
- 4.3. PESTEL analysis
- 4.4. Market Entropy
- 4.5. Patent/Trademark Analysis
- 5. Global Spinal Muscular Atrophy Medicine Industry Analysis, Insights and Forecast, 2019-2031
- 5.1. Market Analysis, Insights and Forecast - by Type
- 5.1.1. Type 1
- 5.1.2. Type 2
- 5.1.3. Type 3
- 5.1.4. Type 4
- 5.2. Market Analysis, Insights and Forecast - by Procedure
- 5.2.1. Gene Replacement Therapy
- 5.2.2. Drug Therapy
- 5.2.3. Other Procedures
- 5.3. Market Analysis, Insights and Forecast - by Route of Administration
- 5.3.1. Oral
- 5.3.2. Intrathecal
- 5.4. Market Analysis, Insights and Forecast - by Region
- 5.4.1. North America
- 5.4.2. Europe
- 5.4.3. Asia Pacific
- 5.4.4. Middle East and Africa
- 5.4.5. South America
- 5.1. Market Analysis, Insights and Forecast - by Type
- 6. North America Spinal Muscular Atrophy Medicine Industry Analysis, Insights and Forecast, 2019-2031
- 6.1. Market Analysis, Insights and Forecast - by Type
- 6.1.1. Type 1
- 6.1.2. Type 2
- 6.1.3. Type 3
- 6.1.4. Type 4
- 6.2. Market Analysis, Insights and Forecast - by Procedure
- 6.2.1. Gene Replacement Therapy
- 6.2.2. Drug Therapy
- 6.2.3. Other Procedures
- 6.3. Market Analysis, Insights and Forecast - by Route of Administration
- 6.3.1. Oral
- 6.3.2. Intrathecal
- 6.1. Market Analysis, Insights and Forecast - by Type
- 7. Europe Spinal Muscular Atrophy Medicine Industry Analysis, Insights and Forecast, 2019-2031
- 7.1. Market Analysis, Insights and Forecast - by Type
- 7.1.1. Type 1
- 7.1.2. Type 2
- 7.1.3. Type 3
- 7.1.4. Type 4
- 7.2. Market Analysis, Insights and Forecast - by Procedure
- 7.2.1. Gene Replacement Therapy
- 7.2.2. Drug Therapy
- 7.2.3. Other Procedures
- 7.3. Market Analysis, Insights and Forecast - by Route of Administration
- 7.3.1. Oral
- 7.3.2. Intrathecal
- 7.1. Market Analysis, Insights and Forecast - by Type
- 8. Asia Pacific Spinal Muscular Atrophy Medicine Industry Analysis, Insights and Forecast, 2019-2031
- 8.1. Market Analysis, Insights and Forecast - by Type
- 8.1.1. Type 1
- 8.1.2. Type 2
- 8.1.3. Type 3
- 8.1.4. Type 4
- 8.2. Market Analysis, Insights and Forecast - by Procedure
- 8.2.1. Gene Replacement Therapy
- 8.2.2. Drug Therapy
- 8.2.3. Other Procedures
- 8.3. Market Analysis, Insights and Forecast - by Route of Administration
- 8.3.1. Oral
- 8.3.2. Intrathecal
- 8.1. Market Analysis, Insights and Forecast - by Type
- 9. Middle East and Africa Spinal Muscular Atrophy Medicine Industry Analysis, Insights and Forecast, 2019-2031
- 9.1. Market Analysis, Insights and Forecast - by Type
- 9.1.1. Type 1
- 9.1.2. Type 2
- 9.1.3. Type 3
- 9.1.4. Type 4
- 9.2. Market Analysis, Insights and Forecast - by Procedure
- 9.2.1. Gene Replacement Therapy
- 9.2.2. Drug Therapy
- 9.2.3. Other Procedures
- 9.3. Market Analysis, Insights and Forecast - by Route of Administration
- 9.3.1. Oral
- 9.3.2. Intrathecal
- 9.1. Market Analysis, Insights and Forecast - by Type
- 10. South America Spinal Muscular Atrophy Medicine Industry Analysis, Insights and Forecast, 2019-2031
- 10.1. Market Analysis, Insights and Forecast - by Type
- 10.1.1. Type 1
- 10.1.2. Type 2
- 10.1.3. Type 3
- 10.1.4. Type 4
- 10.2. Market Analysis, Insights and Forecast - by Procedure
- 10.2.1. Gene Replacement Therapy
- 10.2.2. Drug Therapy
- 10.2.3. Other Procedures
- 10.3. Market Analysis, Insights and Forecast - by Route of Administration
- 10.3.1. Oral
- 10.3.2. Intrathecal
- 10.1. Market Analysis, Insights and Forecast - by Type
- 11. North America Spinal Muscular Atrophy Medicine Industry Analysis, Insights and Forecast, 2019-2031
- 11.1. Market Analysis, Insights and Forecast - By Country/Sub-region
- 11.1.1 United States
- 11.1.2 Canada
- 11.1.3 Mexico
- 12. Europe Spinal Muscular Atrophy Medicine Industry Analysis, Insights and Forecast, 2019-2031
- 12.1. Market Analysis, Insights and Forecast - By Country/Sub-region
- 12.1.1 Germany
- 12.1.2 United Kingdom
- 12.1.3 France
- 12.1.4 Italy
- 12.1.5 Spain
- 12.1.6 Rest of Europe
- 13. Asia Pacific Spinal Muscular Atrophy Medicine Industry Analysis, Insights and Forecast, 2019-2031
- 13.1. Market Analysis, Insights and Forecast - By Country/Sub-region
- 13.1.1 China
- 13.1.2 Japan
- 13.1.3 India
- 13.1.4 Australia
- 13.1.5 South Korea
- 13.1.6 Rest of Asia Pacific
- 14. Middle East and Africa Spinal Muscular Atrophy Medicine Industry Analysis, Insights and Forecast, 2019-2031
- 14.1. Market Analysis, Insights and Forecast - By Country/Sub-region
- 14.1.1 GCC
- 14.1.2 South Africa
- 14.1.3 Rest of Middle East and Africa
- 15. South America Spinal Muscular Atrophy Medicine Industry Analysis, Insights and Forecast, 2019-2031
- 15.1. Market Analysis, Insights and Forecast - By Country/Sub-region
- 15.1.1 Brazil
- 15.1.2 Argentina
- 15.1.3 Rest of South America
- 16. Competitive Analysis
- 16.1. Global Market Share Analysis 2024
- 16.2. Company Profiles
- 16.2.1 Novartis International AG
- 16.2.1.1. Overview
- 16.2.1.2. Products
- 16.2.1.3. SWOT Analysis
- 16.2.1.4. Recent Developments
- 16.2.1.5. Financials (Based on Availability)
- 16.2.2 Isis Pharmaceuticals Inc
- 16.2.2.1. Overview
- 16.2.2.2. Products
- 16.2.2.3. SWOT Analysis
- 16.2.2.4. Recent Developments
- 16.2.2.5. Financials (Based on Availability)
- 16.2.3 Sanofi Aventis Inc (GenZyme Corporation)
- 16.2.3.1. Overview
- 16.2.3.2. Products
- 16.2.3.3. SWOT Analysis
- 16.2.3.4. Recent Developments
- 16.2.3.5. Financials (Based on Availability)
- 16.2.4 Cytokinetics Inc
- 16.2.4.1. Overview
- 16.2.4.2. Products
- 16.2.4.3. SWOT Analysis
- 16.2.4.4. Recent Developments
- 16.2.4.5. Financials (Based on Availability)
- 16.2.5 Avexis Inc
- 16.2.5.1. Overview
- 16.2.5.2. Products
- 16.2.5.3. SWOT Analysis
- 16.2.5.4. Recent Developments
- 16.2.5.5. Financials (Based on Availability)
- 16.2.6 Biogen Inc
- 16.2.6.1. Overview
- 16.2.6.2. Products
- 16.2.6.3. SWOT Analysis
- 16.2.6.4. Recent Developments
- 16.2.6.5. Financials (Based on Availability)
- 16.2.7 Catalyst Pharmaceutical
- 16.2.7.1. Overview
- 16.2.7.2. Products
- 16.2.7.3. SWOT Analysis
- 16.2.7.4. Recent Developments
- 16.2.7.5. Financials (Based on Availability)
- 16.2.8 F Hoffmann - La Roche Ltd
- 16.2.8.1. Overview
- 16.2.8.2. Products
- 16.2.8.3. SWOT Analysis
- 16.2.8.4. Recent Developments
- 16.2.8.5. Financials (Based on Availability)
- 16.2.9 Chugai Pharmaceutical
- 16.2.9.1. Overview
- 16.2.9.2. Products
- 16.2.9.3. SWOT Analysis
- 16.2.9.4. Recent Developments
- 16.2.9.5. Financials (Based on Availability)
- 16.2.10 Pfizer Inc
- 16.2.10.1. Overview
- 16.2.10.2. Products
- 16.2.10.3. SWOT Analysis
- 16.2.10.4. Recent Developments
- 16.2.10.5. Financials (Based on Availability)
- 16.2.1 Novartis International AG
List of Figures
- Figure 1: Global Spinal Muscular Atrophy Medicine Industry Revenue Breakdown (Million, %) by Region 2024 & 2032
- Figure 2: Global Spinal Muscular Atrophy Medicine Industry Volume Breakdown (K Unit, %) by Region 2024 & 2032
- Figure 3: North America Spinal Muscular Atrophy Medicine Industry Revenue (Million), by Country 2024 & 2032
- Figure 4: North America Spinal Muscular Atrophy Medicine Industry Volume (K Unit), by Country 2024 & 2032
- Figure 5: North America Spinal Muscular Atrophy Medicine Industry Revenue Share (%), by Country 2024 & 2032
- Figure 6: North America Spinal Muscular Atrophy Medicine Industry Volume Share (%), by Country 2024 & 2032
- Figure 7: Europe Spinal Muscular Atrophy Medicine Industry Revenue (Million), by Country 2024 & 2032
- Figure 8: Europe Spinal Muscular Atrophy Medicine Industry Volume (K Unit), by Country 2024 & 2032
- Figure 9: Europe Spinal Muscular Atrophy Medicine Industry Revenue Share (%), by Country 2024 & 2032
- Figure 10: Europe Spinal Muscular Atrophy Medicine Industry Volume Share (%), by Country 2024 & 2032
- Figure 11: Asia Pacific Spinal Muscular Atrophy Medicine Industry Revenue (Million), by Country 2024 & 2032
- Figure 12: Asia Pacific Spinal Muscular Atrophy Medicine Industry Volume (K Unit), by Country 2024 & 2032
- Figure 13: Asia Pacific Spinal Muscular Atrophy Medicine Industry Revenue Share (%), by Country 2024 & 2032
- Figure 14: Asia Pacific Spinal Muscular Atrophy Medicine Industry Volume Share (%), by Country 2024 & 2032
- Figure 15: Middle East and Africa Spinal Muscular Atrophy Medicine Industry Revenue (Million), by Country 2024 & 2032
- Figure 16: Middle East and Africa Spinal Muscular Atrophy Medicine Industry Volume (K Unit), by Country 2024 & 2032
- Figure 17: Middle East and Africa Spinal Muscular Atrophy Medicine Industry Revenue Share (%), by Country 2024 & 2032
- Figure 18: Middle East and Africa Spinal Muscular Atrophy Medicine Industry Volume Share (%), by Country 2024 & 2032
- Figure 19: South America Spinal Muscular Atrophy Medicine Industry Revenue (Million), by Country 2024 & 2032
- Figure 20: South America Spinal Muscular Atrophy Medicine Industry Volume (K Unit), by Country 2024 & 2032
- Figure 21: South America Spinal Muscular Atrophy Medicine Industry Revenue Share (%), by Country 2024 & 2032
- Figure 22: South America Spinal Muscular Atrophy Medicine Industry Volume Share (%), by Country 2024 & 2032
- Figure 23: North America Spinal Muscular Atrophy Medicine Industry Revenue (Million), by Type 2024 & 2032
- Figure 24: North America Spinal Muscular Atrophy Medicine Industry Volume (K Unit), by Type 2024 & 2032
- Figure 25: North America Spinal Muscular Atrophy Medicine Industry Revenue Share (%), by Type 2024 & 2032
- Figure 26: North America Spinal Muscular Atrophy Medicine Industry Volume Share (%), by Type 2024 & 2032
- Figure 27: North America Spinal Muscular Atrophy Medicine Industry Revenue (Million), by Procedure 2024 & 2032
- Figure 28: North America Spinal Muscular Atrophy Medicine Industry Volume (K Unit), by Procedure 2024 & 2032
- Figure 29: North America Spinal Muscular Atrophy Medicine Industry Revenue Share (%), by Procedure 2024 & 2032
- Figure 30: North America Spinal Muscular Atrophy Medicine Industry Volume Share (%), by Procedure 2024 & 2032
- Figure 31: North America Spinal Muscular Atrophy Medicine Industry Revenue (Million), by Route of Administration 2024 & 2032
- Figure 32: North America Spinal Muscular Atrophy Medicine Industry Volume (K Unit), by Route of Administration 2024 & 2032
- Figure 33: North America Spinal Muscular Atrophy Medicine Industry Revenue Share (%), by Route of Administration 2024 & 2032
- Figure 34: North America Spinal Muscular Atrophy Medicine Industry Volume Share (%), by Route of Administration 2024 & 2032
- Figure 35: North America Spinal Muscular Atrophy Medicine Industry Revenue (Million), by Country 2024 & 2032
- Figure 36: North America Spinal Muscular Atrophy Medicine Industry Volume (K Unit), by Country 2024 & 2032
- Figure 37: North America Spinal Muscular Atrophy Medicine Industry Revenue Share (%), by Country 2024 & 2032
- Figure 38: North America Spinal Muscular Atrophy Medicine Industry Volume Share (%), by Country 2024 & 2032
- Figure 39: Europe Spinal Muscular Atrophy Medicine Industry Revenue (Million), by Type 2024 & 2032
- Figure 40: Europe Spinal Muscular Atrophy Medicine Industry Volume (K Unit), by Type 2024 & 2032
- Figure 41: Europe Spinal Muscular Atrophy Medicine Industry Revenue Share (%), by Type 2024 & 2032
- Figure 42: Europe Spinal Muscular Atrophy Medicine Industry Volume Share (%), by Type 2024 & 2032
- Figure 43: Europe Spinal Muscular Atrophy Medicine Industry Revenue (Million), by Procedure 2024 & 2032
- Figure 44: Europe Spinal Muscular Atrophy Medicine Industry Volume (K Unit), by Procedure 2024 & 2032
- Figure 45: Europe Spinal Muscular Atrophy Medicine Industry Revenue Share (%), by Procedure 2024 & 2032
- Figure 46: Europe Spinal Muscular Atrophy Medicine Industry Volume Share (%), by Procedure 2024 & 2032
- Figure 47: Europe Spinal Muscular Atrophy Medicine Industry Revenue (Million), by Route of Administration 2024 & 2032
- Figure 48: Europe Spinal Muscular Atrophy Medicine Industry Volume (K Unit), by Route of Administration 2024 & 2032
- Figure 49: Europe Spinal Muscular Atrophy Medicine Industry Revenue Share (%), by Route of Administration 2024 & 2032
- Figure 50: Europe Spinal Muscular Atrophy Medicine Industry Volume Share (%), by Route of Administration 2024 & 2032
- Figure 51: Europe Spinal Muscular Atrophy Medicine Industry Revenue (Million), by Country 2024 & 2032
- Figure 52: Europe Spinal Muscular Atrophy Medicine Industry Volume (K Unit), by Country 2024 & 2032
- Figure 53: Europe Spinal Muscular Atrophy Medicine Industry Revenue Share (%), by Country 2024 & 2032
- Figure 54: Europe Spinal Muscular Atrophy Medicine Industry Volume Share (%), by Country 2024 & 2032
- Figure 55: Asia Pacific Spinal Muscular Atrophy Medicine Industry Revenue (Million), by Type 2024 & 2032
- Figure 56: Asia Pacific Spinal Muscular Atrophy Medicine Industry Volume (K Unit), by Type 2024 & 2032
- Figure 57: Asia Pacific Spinal Muscular Atrophy Medicine Industry Revenue Share (%), by Type 2024 & 2032
- Figure 58: Asia Pacific Spinal Muscular Atrophy Medicine Industry Volume Share (%), by Type 2024 & 2032
- Figure 59: Asia Pacific Spinal Muscular Atrophy Medicine Industry Revenue (Million), by Procedure 2024 & 2032
- Figure 60: Asia Pacific Spinal Muscular Atrophy Medicine Industry Volume (K Unit), by Procedure 2024 & 2032
- Figure 61: Asia Pacific Spinal Muscular Atrophy Medicine Industry Revenue Share (%), by Procedure 2024 & 2032
- Figure 62: Asia Pacific Spinal Muscular Atrophy Medicine Industry Volume Share (%), by Procedure 2024 & 2032
- Figure 63: Asia Pacific Spinal Muscular Atrophy Medicine Industry Revenue (Million), by Route of Administration 2024 & 2032
- Figure 64: Asia Pacific Spinal Muscular Atrophy Medicine Industry Volume (K Unit), by Route of Administration 2024 & 2032
- Figure 65: Asia Pacific Spinal Muscular Atrophy Medicine Industry Revenue Share (%), by Route of Administration 2024 & 2032
- Figure 66: Asia Pacific Spinal Muscular Atrophy Medicine Industry Volume Share (%), by Route of Administration 2024 & 2032
- Figure 67: Asia Pacific Spinal Muscular Atrophy Medicine Industry Revenue (Million), by Country 2024 & 2032
- Figure 68: Asia Pacific Spinal Muscular Atrophy Medicine Industry Volume (K Unit), by Country 2024 & 2032
- Figure 69: Asia Pacific Spinal Muscular Atrophy Medicine Industry Revenue Share (%), by Country 2024 & 2032
- Figure 70: Asia Pacific Spinal Muscular Atrophy Medicine Industry Volume Share (%), by Country 2024 & 2032
- Figure 71: Middle East and Africa Spinal Muscular Atrophy Medicine Industry Revenue (Million), by Type 2024 & 2032
- Figure 72: Middle East and Africa Spinal Muscular Atrophy Medicine Industry Volume (K Unit), by Type 2024 & 2032
- Figure 73: Middle East and Africa Spinal Muscular Atrophy Medicine Industry Revenue Share (%), by Type 2024 & 2032
- Figure 74: Middle East and Africa Spinal Muscular Atrophy Medicine Industry Volume Share (%), by Type 2024 & 2032
- Figure 75: Middle East and Africa Spinal Muscular Atrophy Medicine Industry Revenue (Million), by Procedure 2024 & 2032
- Figure 76: Middle East and Africa Spinal Muscular Atrophy Medicine Industry Volume (K Unit), by Procedure 2024 & 2032
- Figure 77: Middle East and Africa Spinal Muscular Atrophy Medicine Industry Revenue Share (%), by Procedure 2024 & 2032
- Figure 78: Middle East and Africa Spinal Muscular Atrophy Medicine Industry Volume Share (%), by Procedure 2024 & 2032
- Figure 79: Middle East and Africa Spinal Muscular Atrophy Medicine Industry Revenue (Million), by Route of Administration 2024 & 2032
- Figure 80: Middle East and Africa Spinal Muscular Atrophy Medicine Industry Volume (K Unit), by Route of Administration 2024 & 2032
- Figure 81: Middle East and Africa Spinal Muscular Atrophy Medicine Industry Revenue Share (%), by Route of Administration 2024 & 2032
- Figure 82: Middle East and Africa Spinal Muscular Atrophy Medicine Industry Volume Share (%), by Route of Administration 2024 & 2032
- Figure 83: Middle East and Africa Spinal Muscular Atrophy Medicine Industry Revenue (Million), by Country 2024 & 2032
- Figure 84: Middle East and Africa Spinal Muscular Atrophy Medicine Industry Volume (K Unit), by Country 2024 & 2032
- Figure 85: Middle East and Africa Spinal Muscular Atrophy Medicine Industry Revenue Share (%), by Country 2024 & 2032
- Figure 86: Middle East and Africa Spinal Muscular Atrophy Medicine Industry Volume Share (%), by Country 2024 & 2032
- Figure 87: South America Spinal Muscular Atrophy Medicine Industry Revenue (Million), by Type 2024 & 2032
- Figure 88: South America Spinal Muscular Atrophy Medicine Industry Volume (K Unit), by Type 2024 & 2032
- Figure 89: South America Spinal Muscular Atrophy Medicine Industry Revenue Share (%), by Type 2024 & 2032
- Figure 90: South America Spinal Muscular Atrophy Medicine Industry Volume Share (%), by Type 2024 & 2032
- Figure 91: South America Spinal Muscular Atrophy Medicine Industry Revenue (Million), by Procedure 2024 & 2032
- Figure 92: South America Spinal Muscular Atrophy Medicine Industry Volume (K Unit), by Procedure 2024 & 2032
- Figure 93: South America Spinal Muscular Atrophy Medicine Industry Revenue Share (%), by Procedure 2024 & 2032
- Figure 94: South America Spinal Muscular Atrophy Medicine Industry Volume Share (%), by Procedure 2024 & 2032
- Figure 95: South America Spinal Muscular Atrophy Medicine Industry Revenue (Million), by Route of Administration 2024 & 2032
- Figure 96: South America Spinal Muscular Atrophy Medicine Industry Volume (K Unit), by Route of Administration 2024 & 2032
- Figure 97: South America Spinal Muscular Atrophy Medicine Industry Revenue Share (%), by Route of Administration 2024 & 2032
- Figure 98: South America Spinal Muscular Atrophy Medicine Industry Volume Share (%), by Route of Administration 2024 & 2032
- Figure 99: South America Spinal Muscular Atrophy Medicine Industry Revenue (Million), by Country 2024 & 2032
- Figure 100: South America Spinal Muscular Atrophy Medicine Industry Volume (K Unit), by Country 2024 & 2032
- Figure 101: South America Spinal Muscular Atrophy Medicine Industry Revenue Share (%), by Country 2024 & 2032
- Figure 102: South America Spinal Muscular Atrophy Medicine Industry Volume Share (%), by Country 2024 & 2032
List of Tables
- Table 1: Global Spinal Muscular Atrophy Medicine Industry Revenue Million Forecast, by Region 2019 & 2032
- Table 2: Global Spinal Muscular Atrophy Medicine Industry Volume K Unit Forecast, by Region 2019 & 2032
- Table 3: Global Spinal Muscular Atrophy Medicine Industry Revenue Million Forecast, by Type 2019 & 2032
- Table 4: Global Spinal Muscular Atrophy Medicine Industry Volume K Unit Forecast, by Type 2019 & 2032
- Table 5: Global Spinal Muscular Atrophy Medicine Industry Revenue Million Forecast, by Procedure 2019 & 2032
- Table 6: Global Spinal Muscular Atrophy Medicine Industry Volume K Unit Forecast, by Procedure 2019 & 2032
- Table 7: Global Spinal Muscular Atrophy Medicine Industry Revenue Million Forecast, by Route of Administration 2019 & 2032
- Table 8: Global Spinal Muscular Atrophy Medicine Industry Volume K Unit Forecast, by Route of Administration 2019 & 2032
- Table 9: Global Spinal Muscular Atrophy Medicine Industry Revenue Million Forecast, by Region 2019 & 2032
- Table 10: Global Spinal Muscular Atrophy Medicine Industry Volume K Unit Forecast, by Region 2019 & 2032
- Table 11: Global Spinal Muscular Atrophy Medicine Industry Revenue Million Forecast, by Country 2019 & 2032
- Table 12: Global Spinal Muscular Atrophy Medicine Industry Volume K Unit Forecast, by Country 2019 & 2032
- Table 13: United States Spinal Muscular Atrophy Medicine Industry Revenue (Million) Forecast, by Application 2019 & 2032
- Table 14: United States Spinal Muscular Atrophy Medicine Industry Volume (K Unit) Forecast, by Application 2019 & 2032
- Table 15: Canada Spinal Muscular Atrophy Medicine Industry Revenue (Million) Forecast, by Application 2019 & 2032
- Table 16: Canada Spinal Muscular Atrophy Medicine Industry Volume (K Unit) Forecast, by Application 2019 & 2032
- Table 17: Mexico Spinal Muscular Atrophy Medicine Industry Revenue (Million) Forecast, by Application 2019 & 2032
- Table 18: Mexico Spinal Muscular Atrophy Medicine Industry Volume (K Unit) Forecast, by Application 2019 & 2032
- Table 19: Global Spinal Muscular Atrophy Medicine Industry Revenue Million Forecast, by Country 2019 & 2032
- Table 20: Global Spinal Muscular Atrophy Medicine Industry Volume K Unit Forecast, by Country 2019 & 2032
- Table 21: Germany Spinal Muscular Atrophy Medicine Industry Revenue (Million) Forecast, by Application 2019 & 2032
- Table 22: Germany Spinal Muscular Atrophy Medicine Industry Volume (K Unit) Forecast, by Application 2019 & 2032
- Table 23: United Kingdom Spinal Muscular Atrophy Medicine Industry Revenue (Million) Forecast, by Application 2019 & 2032
- Table 24: United Kingdom Spinal Muscular Atrophy Medicine Industry Volume (K Unit) Forecast, by Application 2019 & 2032
- Table 25: France Spinal Muscular Atrophy Medicine Industry Revenue (Million) Forecast, by Application 2019 & 2032
- Table 26: France Spinal Muscular Atrophy Medicine Industry Volume (K Unit) Forecast, by Application 2019 & 2032
- Table 27: Italy Spinal Muscular Atrophy Medicine Industry Revenue (Million) Forecast, by Application 2019 & 2032
- Table 28: Italy Spinal Muscular Atrophy Medicine Industry Volume (K Unit) Forecast, by Application 2019 & 2032
- Table 29: Spain Spinal Muscular Atrophy Medicine Industry Revenue (Million) Forecast, by Application 2019 & 2032
- Table 30: Spain Spinal Muscular Atrophy Medicine Industry Volume (K Unit) Forecast, by Application 2019 & 2032
- Table 31: Rest of Europe Spinal Muscular Atrophy Medicine Industry Revenue (Million) Forecast, by Application 2019 & 2032
- Table 32: Rest of Europe Spinal Muscular Atrophy Medicine Industry Volume (K Unit) Forecast, by Application 2019 & 2032
- Table 33: Global Spinal Muscular Atrophy Medicine Industry Revenue Million Forecast, by Country 2019 & 2032
- Table 34: Global Spinal Muscular Atrophy Medicine Industry Volume K Unit Forecast, by Country 2019 & 2032
- Table 35: China Spinal Muscular Atrophy Medicine Industry Revenue (Million) Forecast, by Application 2019 & 2032
- Table 36: China Spinal Muscular Atrophy Medicine Industry Volume (K Unit) Forecast, by Application 2019 & 2032
- Table 37: Japan Spinal Muscular Atrophy Medicine Industry Revenue (Million) Forecast, by Application 2019 & 2032
- Table 38: Japan Spinal Muscular Atrophy Medicine Industry Volume (K Unit) Forecast, by Application 2019 & 2032
- Table 39: India Spinal Muscular Atrophy Medicine Industry Revenue (Million) Forecast, by Application 2019 & 2032
- Table 40: India Spinal Muscular Atrophy Medicine Industry Volume (K Unit) Forecast, by Application 2019 & 2032
- Table 41: Australia Spinal Muscular Atrophy Medicine Industry Revenue (Million) Forecast, by Application 2019 & 2032
- Table 42: Australia Spinal Muscular Atrophy Medicine Industry Volume (K Unit) Forecast, by Application 2019 & 2032
- Table 43: South Korea Spinal Muscular Atrophy Medicine Industry Revenue (Million) Forecast, by Application 2019 & 2032
- Table 44: South Korea Spinal Muscular Atrophy Medicine Industry Volume (K Unit) Forecast, by Application 2019 & 2032
- Table 45: Rest of Asia Pacific Spinal Muscular Atrophy Medicine Industry Revenue (Million) Forecast, by Application 2019 & 2032
- Table 46: Rest of Asia Pacific Spinal Muscular Atrophy Medicine Industry Volume (K Unit) Forecast, by Application 2019 & 2032
- Table 47: Global Spinal Muscular Atrophy Medicine Industry Revenue Million Forecast, by Country 2019 & 2032
- Table 48: Global Spinal Muscular Atrophy Medicine Industry Volume K Unit Forecast, by Country 2019 & 2032
- Table 49: GCC Spinal Muscular Atrophy Medicine Industry Revenue (Million) Forecast, by Application 2019 & 2032
- Table 50: GCC Spinal Muscular Atrophy Medicine Industry Volume (K Unit) Forecast, by Application 2019 & 2032
- Table 51: South Africa Spinal Muscular Atrophy Medicine Industry Revenue (Million) Forecast, by Application 2019 & 2032
- Table 52: South Africa Spinal Muscular Atrophy Medicine Industry Volume (K Unit) Forecast, by Application 2019 & 2032
- Table 53: Rest of Middle East and Africa Spinal Muscular Atrophy Medicine Industry Revenue (Million) Forecast, by Application 2019 & 2032
- Table 54: Rest of Middle East and Africa Spinal Muscular Atrophy Medicine Industry Volume (K Unit) Forecast, by Application 2019 & 2032
- Table 55: Global Spinal Muscular Atrophy Medicine Industry Revenue Million Forecast, by Country 2019 & 2032
- Table 56: Global Spinal Muscular Atrophy Medicine Industry Volume K Unit Forecast, by Country 2019 & 2032
- Table 57: Brazil Spinal Muscular Atrophy Medicine Industry Revenue (Million) Forecast, by Application 2019 & 2032
- Table 58: Brazil Spinal Muscular Atrophy Medicine Industry Volume (K Unit) Forecast, by Application 2019 & 2032
- Table 59: Argentina Spinal Muscular Atrophy Medicine Industry Revenue (Million) Forecast, by Application 2019 & 2032
- Table 60: Argentina Spinal Muscular Atrophy Medicine Industry Volume (K Unit) Forecast, by Application 2019 & 2032
- Table 61: Rest of South America Spinal Muscular Atrophy Medicine Industry Revenue (Million) Forecast, by Application 2019 & 2032
- Table 62: Rest of South America Spinal Muscular Atrophy Medicine Industry Volume (K Unit) Forecast, by Application 2019 & 2032
- Table 63: Global Spinal Muscular Atrophy Medicine Industry Revenue Million Forecast, by Type 2019 & 2032
- Table 64: Global Spinal Muscular Atrophy Medicine Industry Volume K Unit Forecast, by Type 2019 & 2032
- Table 65: Global Spinal Muscular Atrophy Medicine Industry Revenue Million Forecast, by Procedure 2019 & 2032
- Table 66: Global Spinal Muscular Atrophy Medicine Industry Volume K Unit Forecast, by Procedure 2019 & 2032
- Table 67: Global Spinal Muscular Atrophy Medicine Industry Revenue Million Forecast, by Route of Administration 2019 & 2032
- Table 68: Global Spinal Muscular Atrophy Medicine Industry Volume K Unit Forecast, by Route of Administration 2019 & 2032
- Table 69: Global Spinal Muscular Atrophy Medicine Industry Revenue Million Forecast, by Country 2019 & 2032
- Table 70: Global Spinal Muscular Atrophy Medicine Industry Volume K Unit Forecast, by Country 2019 & 2032
- Table 71: United States Spinal Muscular Atrophy Medicine Industry Revenue (Million) Forecast, by Application 2019 & 2032
- Table 72: United States Spinal Muscular Atrophy Medicine Industry Volume (K Unit) Forecast, by Application 2019 & 2032
- Table 73: Canada Spinal Muscular Atrophy Medicine Industry Revenue (Million) Forecast, by Application 2019 & 2032
- Table 74: Canada Spinal Muscular Atrophy Medicine Industry Volume (K Unit) Forecast, by Application 2019 & 2032
- Table 75: Mexico Spinal Muscular Atrophy Medicine Industry Revenue (Million) Forecast, by Application 2019 & 2032
- Table 76: Mexico Spinal Muscular Atrophy Medicine Industry Volume (K Unit) Forecast, by Application 2019 & 2032
- Table 77: Global Spinal Muscular Atrophy Medicine Industry Revenue Million Forecast, by Type 2019 & 2032
- Table 78: Global Spinal Muscular Atrophy Medicine Industry Volume K Unit Forecast, by Type 2019 & 2032
- Table 79: Global Spinal Muscular Atrophy Medicine Industry Revenue Million Forecast, by Procedure 2019 & 2032
- Table 80: Global Spinal Muscular Atrophy Medicine Industry Volume K Unit Forecast, by Procedure 2019 & 2032
- Table 81: Global Spinal Muscular Atrophy Medicine Industry Revenue Million Forecast, by Route of Administration 2019 & 2032
- Table 82: Global Spinal Muscular Atrophy Medicine Industry Volume K Unit Forecast, by Route of Administration 2019 & 2032
- Table 83: Global Spinal Muscular Atrophy Medicine Industry Revenue Million Forecast, by Country 2019 & 2032
- Table 84: Global Spinal Muscular Atrophy Medicine Industry Volume K Unit Forecast, by Country 2019 & 2032
- Table 85: Germany Spinal Muscular Atrophy Medicine Industry Revenue (Million) Forecast, by Application 2019 & 2032
- Table 86: Germany Spinal Muscular Atrophy Medicine Industry Volume (K Unit) Forecast, by Application 2019 & 2032
- Table 87: United Kingdom Spinal Muscular Atrophy Medicine Industry Revenue (Million) Forecast, by Application 2019 & 2032
- Table 88: United Kingdom Spinal Muscular Atrophy Medicine Industry Volume (K Unit) Forecast, by Application 2019 & 2032
- Table 89: France Spinal Muscular Atrophy Medicine Industry Revenue (Million) Forecast, by Application 2019 & 2032
- Table 90: France Spinal Muscular Atrophy Medicine Industry Volume (K Unit) Forecast, by Application 2019 & 2032
- Table 91: Italy Spinal Muscular Atrophy Medicine Industry Revenue (Million) Forecast, by Application 2019 & 2032
- Table 92: Italy Spinal Muscular Atrophy Medicine Industry Volume (K Unit) Forecast, by Application 2019 & 2032
- Table 93: Spain Spinal Muscular Atrophy Medicine Industry Revenue (Million) Forecast, by Application 2019 & 2032
- Table 94: Spain Spinal Muscular Atrophy Medicine Industry Volume (K Unit) Forecast, by Application 2019 & 2032
- Table 95: Rest of Europe Spinal Muscular Atrophy Medicine Industry Revenue (Million) Forecast, by Application 2019 & 2032
- Table 96: Rest of Europe Spinal Muscular Atrophy Medicine Industry Volume (K Unit) Forecast, by Application 2019 & 2032
- Table 97: Global Spinal Muscular Atrophy Medicine Industry Revenue Million Forecast, by Type 2019 & 2032
- Table 98: Global Spinal Muscular Atrophy Medicine Industry Volume K Unit Forecast, by Type 2019 & 2032
- Table 99: Global Spinal Muscular Atrophy Medicine Industry Revenue Million Forecast, by Procedure 2019 & 2032
- Table 100: Global Spinal Muscular Atrophy Medicine Industry Volume K Unit Forecast, by Procedure 2019 & 2032
- Table 101: Global Spinal Muscular Atrophy Medicine Industry Revenue Million Forecast, by Route of Administration 2019 & 2032
- Table 102: Global Spinal Muscular Atrophy Medicine Industry Volume K Unit Forecast, by Route of Administration 2019 & 2032
- Table 103: Global Spinal Muscular Atrophy Medicine Industry Revenue Million Forecast, by Country 2019 & 2032
- Table 104: Global Spinal Muscular Atrophy Medicine Industry Volume K Unit Forecast, by Country 2019 & 2032
- Table 105: China Spinal Muscular Atrophy Medicine Industry Revenue (Million) Forecast, by Application 2019 & 2032
- Table 106: China Spinal Muscular Atrophy Medicine Industry Volume (K Unit) Forecast, by Application 2019 & 2032
- Table 107: Japan Spinal Muscular Atrophy Medicine Industry Revenue (Million) Forecast, by Application 2019 & 2032
- Table 108: Japan Spinal Muscular Atrophy Medicine Industry Volume (K Unit) Forecast, by Application 2019 & 2032
- Table 109: India Spinal Muscular Atrophy Medicine Industry Revenue (Million) Forecast, by Application 2019 & 2032
- Table 110: India Spinal Muscular Atrophy Medicine Industry Volume (K Unit) Forecast, by Application 2019 & 2032
- Table 111: Australia Spinal Muscular Atrophy Medicine Industry Revenue (Million) Forecast, by Application 2019 & 2032
- Table 112: Australia Spinal Muscular Atrophy Medicine Industry Volume (K Unit) Forecast, by Application 2019 & 2032
- Table 113: South Korea Spinal Muscular Atrophy Medicine Industry Revenue (Million) Forecast, by Application 2019 & 2032
- Table 114: South Korea Spinal Muscular Atrophy Medicine Industry Volume (K Unit) Forecast, by Application 2019 & 2032
- Table 115: Rest of Asia Pacific Spinal Muscular Atrophy Medicine Industry Revenue (Million) Forecast, by Application 2019 & 2032
- Table 116: Rest of Asia Pacific Spinal Muscular Atrophy Medicine Industry Volume (K Unit) Forecast, by Application 2019 & 2032
- Table 117: Global Spinal Muscular Atrophy Medicine Industry Revenue Million Forecast, by Type 2019 & 2032
- Table 118: Global Spinal Muscular Atrophy Medicine Industry Volume K Unit Forecast, by Type 2019 & 2032
- Table 119: Global Spinal Muscular Atrophy Medicine Industry Revenue Million Forecast, by Procedure 2019 & 2032
- Table 120: Global Spinal Muscular Atrophy Medicine Industry Volume K Unit Forecast, by Procedure 2019 & 2032
- Table 121: Global Spinal Muscular Atrophy Medicine Industry Revenue Million Forecast, by Route of Administration 2019 & 2032
- Table 122: Global Spinal Muscular Atrophy Medicine Industry Volume K Unit Forecast, by Route of Administration 2019 & 2032
- Table 123: Global Spinal Muscular Atrophy Medicine Industry Revenue Million Forecast, by Country 2019 & 2032
- Table 124: Global Spinal Muscular Atrophy Medicine Industry Volume K Unit Forecast, by Country 2019 & 2032
- Table 125: GCC Spinal Muscular Atrophy Medicine Industry Revenue (Million) Forecast, by Application 2019 & 2032
- Table 126: GCC Spinal Muscular Atrophy Medicine Industry Volume (K Unit) Forecast, by Application 2019 & 2032
- Table 127: South Africa Spinal Muscular Atrophy Medicine Industry Revenue (Million) Forecast, by Application 2019 & 2032
- Table 128: South Africa Spinal Muscular Atrophy Medicine Industry Volume (K Unit) Forecast, by Application 2019 & 2032
- Table 129: Rest of Middle East and Africa Spinal Muscular Atrophy Medicine Industry Revenue (Million) Forecast, by Application 2019 & 2032
- Table 130: Rest of Middle East and Africa Spinal Muscular Atrophy Medicine Industry Volume (K Unit) Forecast, by Application 2019 & 2032
- Table 131: Global Spinal Muscular Atrophy Medicine Industry Revenue Million Forecast, by Type 2019 & 2032
- Table 132: Global Spinal Muscular Atrophy Medicine Industry Volume K Unit Forecast, by Type 2019 & 2032
- Table 133: Global Spinal Muscular Atrophy Medicine Industry Revenue Million Forecast, by Procedure 2019 & 2032
- Table 134: Global Spinal Muscular Atrophy Medicine Industry Volume K Unit Forecast, by Procedure 2019 & 2032
- Table 135: Global Spinal Muscular Atrophy Medicine Industry Revenue Million Forecast, by Route of Administration 2019 & 2032
- Table 136: Global Spinal Muscular Atrophy Medicine Industry Volume K Unit Forecast, by Route of Administration 2019 & 2032
- Table 137: Global Spinal Muscular Atrophy Medicine Industry Revenue Million Forecast, by Country 2019 & 2032
- Table 138: Global Spinal Muscular Atrophy Medicine Industry Volume K Unit Forecast, by Country 2019 & 2032
- Table 139: Brazil Spinal Muscular Atrophy Medicine Industry Revenue (Million) Forecast, by Application 2019 & 2032
- Table 140: Brazil Spinal Muscular Atrophy Medicine Industry Volume (K Unit) Forecast, by Application 2019 & 2032
- Table 141: Argentina Spinal Muscular Atrophy Medicine Industry Revenue (Million) Forecast, by Application 2019 & 2032
- Table 142: Argentina Spinal Muscular Atrophy Medicine Industry Volume (K Unit) Forecast, by Application 2019 & 2032
- Table 143: Rest of South America Spinal Muscular Atrophy Medicine Industry Revenue (Million) Forecast, by Application 2019 & 2032
- Table 144: Rest of South America Spinal Muscular Atrophy Medicine Industry Volume (K Unit) Forecast, by Application 2019 & 2032
Frequently Asked Questions
1. What is the projected Compound Annual Growth Rate (CAGR) of the Spinal Muscular Atrophy Medicine Industry?
The projected CAGR is approximately 14.50%.
2. Which companies are prominent players in the Spinal Muscular Atrophy Medicine Industry?
Key companies in the market include Novartis International AG, Isis Pharmaceuticals Inc, Sanofi Aventis Inc (GenZyme Corporation), Cytokinetics Inc, Avexis Inc, Biogen Inc, Catalyst Pharmaceutical, F Hoffmann - La Roche Ltd, Chugai Pharmaceutical, Pfizer Inc.
3. What are the main segments of the Spinal Muscular Atrophy Medicine Industry?
The market segments include Type, Procedure, Route of Administration.
4. Can you provide details about the market size?
The market size is estimated to be USD XX Million as of 2022.
5. What are some drivers contributing to market growth?
Growing Awareness Regarding Spinal Muscular Atrophy. Its Diagnostics. and Its Treatment; Rise in the Government Initiatives to Improve Healthcare Infrastructure; Increasing R&D Activities to Develop Novel Treatment Regimens for Rare Diseases.
6. What are the notable trends driving market growth?
The Gene Replacement Therapy Segment Dominates the Market. and the Same is Expected Over the Forecast Period.
7. Are there any restraints impacting market growth?
High Cost of Treatment; Lack of Skilled Professionals for Surgical Procedures and Physiotherapy Regimens.
8. Can you provide examples of recent developments in the market?
In August 2021, Novartis announced the lift of a partial clinical trial hold and planned to initiate a new, pivotal Phase 3 study of intrathecal OAV-101 in older patients with spinal muscular atrophy.
9. What pricing options are available for accessing the report?
Pricing options include single-user, multi-user, and enterprise licenses priced at USD 4750, USD 5250, and USD 8750 respectively.
10. Is the market size provided in terms of value or volume?
The market size is provided in terms of value, measured in Million and volume, measured in K Unit.
11. Are there any specific market keywords associated with the report?
Yes, the market keyword associated with the report is "Spinal Muscular Atrophy Medicine Industry," which aids in identifying and referencing the specific market segment covered.
12. How do I determine which pricing option suits my needs best?
The pricing options vary based on user requirements and access needs. Individual users may opt for single-user licenses, while businesses requiring broader access may choose multi-user or enterprise licenses for cost-effective access to the report.
13. Are there any additional resources or data provided in the Spinal Muscular Atrophy Medicine Industry report?
While the report offers comprehensive insights, it's advisable to review the specific contents or supplementary materials provided to ascertain if additional resources or data are available.
14. How can I stay updated on further developments or reports in the Spinal Muscular Atrophy Medicine Industry?
To stay informed about further developments, trends, and reports in the Spinal Muscular Atrophy Medicine Industry, consider subscribing to industry newsletters, following relevant companies and organizations, or regularly checking reputable industry news sources and publications.
Methodology
Step 1 - Identification of Relevant Samples Size from Population Database


Step 2 - Approaches for Defining Global Market Size (Value, Volume* & Price*)

Note*: In applicable scenarios
Step 3 - Data Sources
Primary Research
- Web Analytics
- Survey Reports
- Research Institute
- Latest Research Reports
- Opinion Leaders
Secondary Research
- Annual Reports
- White Paper
- Latest Press Release
- Industry Association
- Paid Database
- Investor Presentations

Step 4 - Data Triangulation
Involves using different sources of information in order to increase the validity of a study
These sources are likely to be stakeholders in a program - participants, other researchers, program staff, other community members, and so on.
Then we put all data in single framework & apply various statistical tools to find out the dynamic on the market.
During the analysis stage, feedback from the stakeholder groups would be compared to determine areas of agreement as well as areas of divergence
